High Performance Composites Market by Resin Type (Thermoset, Thermoplastic), Fiber Type (Carbon Fiber, S-Glass, Aramid Fiber) Application (Aerospace & Defense, Automotive, Pressure Vessel, Wind Turbine, Medical), Region - Global Forecast to 2022


[201 Pages Report] on High Performance Composites Market was valued at USD 23.50 Billion in 2016 and is projected to reach USD 33.33 Billion by 2022, at a CAGR of 6.0% from 2017 to 2022. The base year that has been considered for this study on the high performance composites market is 2016, while the forecast period is between 2017 and 2022.
Objectives of the report are as follows:
- To define and segment the high performance composites market on the basis of resin type, fiber type, application, and region.
- To provide detailed information regarding the major factors, such drivers, restraints, opportunities, and challenges influencing the growth of the high performance composites market
- To analyze and forecast the size of the high performance composites market, in terms of value
- To analyze the segmentation and project the size of the high performance composites market, in terms of value for five key regions, namely, North America, Europe, Asia Pacific, South America, and Middle East & Africa
- To strategically profile the key players operating in the high performance composites market
- To analyze competitive developments, such as new product launches, expansions, mergers & acquisitions, and partnerships & agreements taking place in the high performance composites market
Both, top-down and bottom-up approaches have been used to estimate and validate the size of the high performance composites market, and to determine the sizes of various other dependent submarkets. The research study that has been employed involved extensive use of secondary sources, directories, and databases, such as Hoovers, Bloomberg, Chemical Weekly, Factiva, and other government and private websites to identify and collect information useful for the technical, market-oriented, and commercial study of the high performance composites market.
To know about the assumptions considered for the study, download the pdf brochure
Toray Industries Inc. (Japan), Hexcel Corporation (US), Solvay S.A. (Belgium), SGL Group-The Carbon Company (Germany), Koninklijke TenCate NV (Netherlands), TPI Composites (US), Owens Corning Corporation (US), Teijin Limited (Japan), and BASF SE (Germany) are the key players operating in the high performance composites market.
Please visit 360Quadrants to see the vendor listing of Top 20 Composites Companies, Worldwide 2023
Key Target Audience:
- Suppliers of Raw Materials
- Manufacturers of High Performance Composites
- Traders, Distributors, and Suppliers of High Performance Composites
- Government & Regional Agencies, Research Organizations, and Investment Research Firms of Composites
Scope of the report:
This research report categorizes the high performance composites market on the basis of resin type, fiber type, application, and region.
High Performance Composites Market, by Resin Type:
- Thermoset Resins
- Thermoplastic Resins
High Performance Composites Market, by Fiber Type:
- Carbon Fiber Composites
- S-glass Composites
- Aramid Fiber Composites
- Others
High Performance Composites Market, by Application:
- Aerospace & Defense
- Automotive
- Pressure Vessel
- Wind Turbine
- Medical
- Construction
- Others
High Performance Composites Market, by Region:
- North America
- Europe
- Asia Pacific
- South America
- Middle East & Africa
The market has been further analyzed for the key countries in each of these regions.
Available Customizations:
With the given market data, MarketsandMarkets offers customizations according to the specific needs of the companies. The following customization options are available for the report:
Regional Analysis:
- Further breakdown of the regional high performance composites market into the key countries
Company Information:
- Detailed analysis and profiles of additional market players
Product Analysis
- Product matrix, which gives a detailed comparison of the product portfolio of each company
The high performance composites market was valued at USD 23.50 Billion in 2016 and is projected to reach USD 33.33 Billion by 2022, at a CAGR of 6.0% from 2017 to 2022. High performance composites are manufactured by using a polymer resin with fibers for reinforcements. These composites are being increasingly used in the automotive, aerospace & defense, pressure vessels, wind turbines, medical, and construction applications, owing to their lightweight and features offered by them, which include high strength, increased corrosion resistance, high impact strength, excellent design flexibility, enhanced dimensional stability, low thermal conductivity, and high durability. Moreover, high performance composites are non-conductive, non-magnetic, and radar transparent.
The thermoplastic resin type segment of the high performance composites market is projected to grow at the highest CAGR during the forecast period. The growth of this segment of the market can be attributed to increased use of high performance thermoplastic composites in various industries, owing to the flexibility of remelting and reforming offered by them due to the absence of crosslinking in thermoplastic resins. These composites offer high impact strength and smooth surface finish. They can be molded easily on reheating. The high performance thermoplastic composites are preferred over high performance thermosetting composites as they offer longer shelf-life, have faster manufacturing cycle, and are easier to recycle.
The S-glass fiber type segment of the high performance composites market is projected to grow at the highest CAGR during the forecast period. The growth of this segment can be attributed to increased use of S-glass high performance composites in military aircraft for fuselage skins, floor panels, and fire walls, owing to the capability of these composites to withstand the impact of force. Moreover, these composites have low flammability and high resistance to corrosion. S-glass high performance composites are lightweight and offer high strength and increased fatigue resistance. They are used for manufacturing blades of helicopters. As S-glass high performance composites have high strength, increased flexibility, and enhanced dimensional stability, they are increasingly used as robotic arms on space shuttles.
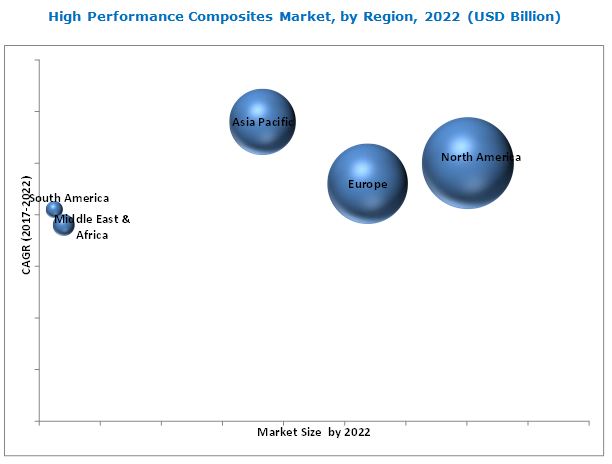
The North American region accounted for the largest share of the high performance composites market in 2016. It was followed by the European region. The increased demand for high performance composites in the Asia Pacific region can be attributed to the shifting of the manufacturing sector from the North American and European regions to the Asia Pacific region. Moreover, the increasing government spending on the aerospace & defense sector in the region is also expected to fuel the growth of the Asia Pacific high performance composites market during the forecast period.
Increasing competition from high performance thermoplastic resins may hamper the growth of the high performance thermoset composites segment of the high performance composites market as thermoplastic resins can be reformed, reshaped, and reused. Moreover, thermoplastic resins also skip the lengthy curing process required by thermoset resins.
Companies operating in the high performance composites market have adopted the strategies of new product launches, expansions, and mergers & acquisitions to enhance their market shares and expand their distribution networks across the globe. These companies engage in R&D activities to innovate and develop products that can open avenues for new applications. For instance, Toray Industries (Japan) launched TORAYCA prepreg. The product is supplied in the form of sheets consisting of resin-impregnated carbon fibers. It has major use in the aerospace sector due to its low weight and high strength characteristics. In the sports sector, it is used for manufacturing golf club shafts, fishing rods, and tennis racket frames.
Similarly, in February 2016, TPI Composites (US) expanded its wind blade production business by opening a new manufacturing facility in Mexico. The wind blades manufactured at this new production unit are supplied to Gamesa Technology Corp. (Spain). This expansion enabled the company to maintain its position as a global leader in the high performance composites market.
To speak to our analyst for a discussion on the above findings, click Speak to Analyst
 Exclusive indicates content/data unique to MarketsandMarkets and not available with any competitors.
Table of Contents
1 Introduction (Page No. - 19)
1.1 Objectives of the Study
1.2 Market Definition
1.3 Market Scope
1.3.1 Markets Covered
1.3.2 Years Considered for the Study
1.4 Currency
1.5 Package Size
1.6 Limitations
1.7 Stakeholders
2 Research Methodology (Page No. - 23)
2.1 Research Data
2.1.1 Secondary Data
2.1.1.1 Key Data From Secondary Sources
2.1.2 Primary Data
2.1.2.1 Key Data From Primary Sources
2.1.2.2 Key Industry Insights
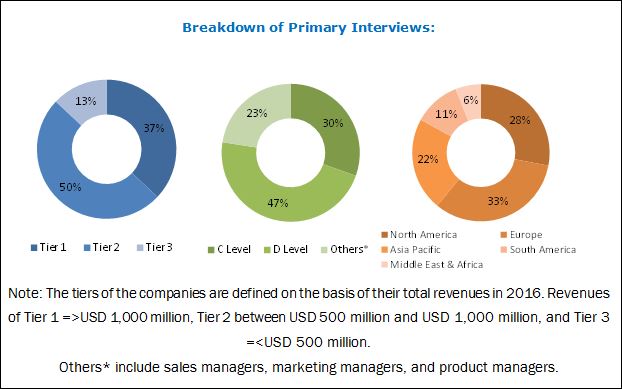
2.1.2.3 Breakdown of Primary Interviews
2.2 Market Size Estimation
2.2.1 Bottom-Up Approach
2.2.2 Top-Down Approach
2.3 Data Triangulation
2.4 Research Assumptions
3 Executive Summary (Page No. - 31)
4 Premium Insights (Page No. - 35)
4.1 Attractive Opportunities in High Performance Composites Market
4.2 High Performance Composites Market in Asia-Pacific, By Country and End-Use Industry, 2016
4.3 High Performance Composites Market, By Application
4.4 High Performance Composites Market, By Fiber Type
4.5 High Performance Composites Market, By Region 2017-2022
5 Market Overview (Page No. - 39)
5.1 Introduction
5.2 Market Dynamics
5.2.1 Drivers
5.2.1.1 Increase in Use of S-Glass and Carbon Fiber Reinforced Plastics in Boeing and Airbus Aircraft
5.2.1.2 Increasing Length of Wind Turbine Blades and Use of High Performance Composites in Wind Turbine Blades
5.2.2 Restraints
5.2.2.1 Concerns Pertaining to Recyclability
5.2.3 Opportunities
5.2.3.1 Growing Demand From Emerging Markets
5.2.4 Challenges
5.2.4.1 High Cost of High Performance Composites
5.2.4.2 Repairing High Performance Composite Parts
5.3 Porter’s Five Forces Analysis
5.3.1 Threat of New Entrants
5.3.2 Threat of Substitutes
5.3.3 Bargaining Power of Suppliers
5.3.4 Bargaining Power of Buyers
5.3.5 Intensity of Competitive Rivalry
5.4 Macroeconomic Overview and Key Drivers
5.4.1 Introduction
5.4.2 Automotive Industry Trends
5.4.2.1 Global Vehicle Sales (2013-2016)
5.4.3 Wind Energy Industry Trends
5.4.4 Aerospace Industry Trends
6 High Performance Composites Market, By Resin Type (Page No. - 50)
6.1 Introduction
6.2 High Performance Thermoset Composites
6.2.1 Polyester
6.2.2 Epoxy
6.2.3 Phenolics
6.2.4 Cyanate Esters
6.3 High Performance Thermoplastic Composites
6.3.1 Polyether Ether Ketone (PEEK)
6.3.2 Polyphenylene Sulfide (PPS)
7 High Performance Composites Market, By Fiber Type (Page No. - 55)
7.1 Introduction
7.2 Carbon Fiber Composites
7.3 S-Glass Composites
7.4 Aramid Fiber Composites
7.5 Others
8 High Performance Composites Market, By Manufacturing Process (Page No. - 62)
8.1 Introduction
8.2 Lay-Up Process
8.3 Compression Molding Process
8.4 Resin Transfer Molding Process
8.5 Other Processes
9 High Performance Composites Market, By Application (Page No. - 69)
9.1 Introduction
9.2 Aerospace & Defense
9.2.1 Commercial Airliners
9.2.2 Military Aircraft
9.2.3 Defense
9.3 Automotive
9.4 Pressure Vessels
9.5 Wind Turbines
9.6 Medical
9.7 Construction
9.8 Others
10 High Performance Composites Market, By Region (Page No. - 80)
10.1 Introduction
10.2 North America
10.2.1 U.S.
10.2.2 Canada
10.2.3 Mexico
10.3 Europe
10.3.1 Germany
10.3.2 U.K.
10.3.3 France
10.3.4 Italy
10.3.5 Spain
10.3.6 Rest of Europe
10.4 Asia-Pacific
10.4.1 China
10.4.2 Japan
10.4.3 South Korea
10.4.4 India
10.4.5 Indonesia
10.4.6 Rest of Asia-Pacific
10.5 Middle East & Africa
10.5.1 UAE
10.5.2 Saudi Arabia
10.5.3 South Africa
10.5.4 Rest of Middle East & Africa
10.6 South America
10.6.1 Brazil
10.6.2 Argentina
10.6.3 Rest of South America
11 Competitive Landscape (Page No. - 147)
11.1 Introduction
11.1.1 Visionary Leaders
11.1.2 Innovators
11.1.3 Dynamic Differentiators
11.1.4 Emerging Companies
11.2 Competitive Benchmarking
11.2.1 Strength of Product Portfolio
11.2.2 Business Strategy Excellence
11.3 Market Ranking of Key Players
12 Company Profiles (Page No. - 152)
(Business Overview, Products Offered, Scorecard of Product Offering, Scorecard of Business Strategy, and New Product Launch)
12.1 Toray Industries Inc.
12.2 SLG Group – the Carbon Company
12.3 Koninklijke Ten Cate BV
12.4 TPI Composites, Inc.
12.5 Solvay S.A.
12.6 Hexcel Corporation
12.7 Owens Corning Corporation
12.8 Teijin Ltd.
12.9 BASF SE
12.10 Albany International Corporation
12.11 Arkema SA
12.12 Other Market Players
12.12.1 Agy Holdings Corp.
12.12.2 E. I. Dupont De Nemours and Company
12.12.3 Huntsman Corporation
12.12.4 Plasan Carbon Composites
12.12.5 Momentive Performance Materials Inc.
12.12.6 Formosa Plastics Corporation
12.12.7 Mitsubishi Rayon Co. Ltd.
12.12.8 The 3M Company
12.12.9 PPG Industries Inc.
12.12.10 GKN PLC
12.12.11 Crawford Composites LLC
12.12.12 Argosy International Inc.
12.12.13 Saertex GmbH
12.12.14 Orbital Atk Inc.
*Details Might Not Be Captured in Case of Unlisted Companies.
13 Appendix (Page No. - 194)
13.1 Insights From Industry Experts
13.2 Discussion Guide
13.3 Knowledge Store: Marketsandmarkets Subscription Portal
13.4 Introducing RT: Real Time Market Intelligence
13.5 Available Customizations
13.6 Related Reports
13.7 Author Details
List of Tables (185 Tables)
Table 1 Global Wind Energy Capacities (GW)
Table 2 Number of New Airplane Deliveries, By Region (2016-2035)
Table 3 High Performance Composites Market Size, By Resin Type, 2015–2022 (USD Million)
Table 4 High Performance Composites Market Size, By Resin Type, 2015–2022 (Kiloton)
Table 5 High Performance Thermoset Composites Market Size, By Region, 2015–2022 (USD Million)
Table 6 High Performance Thermoset Composites Market Size, By Region, 2015–2022 (Kiloton)
Table 7 High Performance Thermoplastic Composites Market Size, By Region, 2015–2022 (USD Million)
Table 8 High Performance Thermoplastic Composites Market Size, By Region, 2015–2022 (Kiloton)
Table 9 High Performance Composites Market Size, By Fiber Type, 2015–2022 (USD Million)
Table 10 High Performance Composites Market Size, By Fiber Type, 2015–2022 (Kiloton)
Table 11 High Performance Carbon Fiber Composites Market Size, By Region, 2015–2022 (USD Million)
Table 12 High Performance Carbon Fiber Composites Market Size, By Region, 2015–2022 (Kiloton)
Table 13 High Performance S-Glass Composites Market Size, By Region, 2015–2022 (USD Million)
Table 14 High Performance S-Glass Composites Market Size, By Region, 2015–2022 (Kiloton)
Table 15 High Performance Aramid Composites Market Size, By Region, 2015–2022 (USD Million)
Table 16 High Performance Aramid Composites Market Size, By Region, 2015–2022 (Kiloton)
Table 17 Other High Performance Fiber Composites Market, By Region, 2015–2022 (USD Million)
Table 18 Other Fibers in High Performance Composites Market, By Region, 2015–2022 (Kiloton)
Table 19 High Performance Composites Market Size, By Manufacturing Process, 2015–2022 (USD Million)
Table 20 High Performance Composites Market Size, By Manufacturing Process, 2015–2022 (Kiloton)
Table 21 Lay-Up Process Market Size, By Region, 2015–2022 (USD Million)
Table 22 Lay-Up Process Market Size, By Region, 2015–2022 (Kiloton)
Table 23 Compression Molding Process Market Size, By Region, 2015–2022 (USD Million)
Table 24 Compression Molding Process Market Size, By Region, 2015–2022 (Kiloton)
Table 25 Rtm Process Market Size, By Region, 2015–2022 (USD Million)
Table 26 Rtm Process Market Size, By Region, 2015–2022 (Kiloton)
Table 27 Other Manufacturing Processes Market Size, By Region, 2015–2022 (USD Million)
Table 28 Other Manufacturing Processes Market Size, By Region, 2015–2022 (Kiloton)
Table 29 High Performance Composites Market Size, By Application, 2015–2022 (USD Million)
Table 30 High Performance Composites Market Size, By Application, 2015–2022 (Kiloton)
Table 31 High Performance Composites Market Size in Aerospace & Defense, By Region, 2015–2022 (USD Million)
Table 32 High Performance Composites Market Size in Aerospace & Defense, By Region, 2015–2022 (Kiloton)
Table 33 High Performance Composites Market Size in Automotive, By Region, 2015–2022 (USD Million)
Table 34 High Performance Composites Market Size in Automotive, By Region, 2015–2022 (Kiloton)
Table 35 High Performance Composites Market Size in Pressure Vessels, By Region, 2015–2022 (USD Million)
Table 36 High Performance Composites Market Size in Pressure Vessels, By Region, 2015–2022 (Kiloton)
Table 37 High Performance Composites Market Size in Wind Turbines, By Region, 2015–2022 (USD Million)
Table 38 High Performance Composites Market Size in Wind Turbines, By Region, 2015–2022 (Kiloton)
Table 39 High Performance Composites Market Size in Medical, By Region, 2015–2022 (USD Million)
Table 40 High Performance Composites Market Size in Medical, By Region, 2015–2022 (Kiloton)
Table 41 High Performance Composites Market Size in Construction, By Region, 2015–2022 (USD Million)
Table 42 High Performance Composites Market Size in Construction, By Region, 2015–2022 (Kiloton)
Table 43 High Performance Composites Market Size in Other Applications, By Region, 2015–2022 (USD Million)
Table 44 High Performance Composites Market Size in Other Applications, By Region, 2015–2022 (Kiloton)
Table 45 High Performance Composites Market Size, By Region, 2015–2022 (USD Million)
Table 46 High Performance Composites Market Size, By Region, 2015–2022 (Kiloton)
Table 47 North America: High Performance Composites Market Size, By Country, 2015–2022 (USD Million)
Table 48 North America: High Performance Composites Market Size, By Country, 2015–2022 (Kiloton)
Table 49 North America: High Performance Composites Market Size, By Resin Type, 2015–2022 (USD Million)
Table 50 North America: High Performance Composites Market Size, By Type, 2015–2022 (Kiloton)
Table 51 North America: High Performance Composites Market Size, By Fiber Type, 2015–2022 (USD Million)
Table 52 North America: High Performance Composites Market Size, By Fiber Type, 2015–2022 (Kiloton)
Table 53 North America: High Performance Composites Market Size, By Manufacturing Process, 2015–2022 (USD Million)
Table 54 North America: High Performance Composites Market Size, By Manufacturing Process, 2015–2022 (Kiloton)
Table 55 North America: High Performance Composites Market Size, By Application, 2015–2022 (USD Million)
Table 56 North America: High Performance Composites Market Size, By Application, 2015–2022 (Kiloton)
Table 57 U.S.: High Performance Composites Market Size, By Resin Type, 2015–2022 (USD Million)
Table 58 U.S.: High Performance Composites Market Size, By Fiber Type, 2015–2022 (USD Million)
Table 59 U.S.: High Performance Composites Market Size, By Manufacturing Process, 2015–2022 (USD Million)
Table 60 U.S.: High Performance Composites Market Size, By Application, 2015–2022 (USD Million)
Table 61 Canada: High Performance Composites Market Size, By Resin Type, 2015–2022 (USD Million)
Table 62 Canada: High Performance Composites Market Size, By Fiber Type, 2015–2022 (USD Million)
Table 63 Canada: High Performance Composites Market Size, By Manufacturing Process, 2015–2022 (USD Million)
Table 64 Canada: High Performance Composites Market Size, By Application, 2015–2022 (USD Million)
Table 65 Mexico: High Performance Composites Market Size, By Resin Type, 2015–2022 (USD Million)
Table 66 Mexico: High Performance Composites Market Size, By Fiber Type, 2015–2022 (USD Million)
Table 67 Mexico: High Performance Composites Market Size, By Manufacturing Process, 2015–2022 (USD Million)
Table 68 Mexico: High Performance Composites Market Size, By Application, 2015–2022 (USD Million)
Table 69 Europe: High Performance Composites Market Size, By Country, 2015–2022 (USD Million)
Table 70 Europe: High Performance Composites Market Size, By Country, 2015–2022 (Kiloton)
Table 71 Europe: High Performance Composites Market Size, By Resin Type, 2015–2022 (USD Million)
Table 72 Europe: High Performance Composites Market Size, By Resin Type, 2015–2022 (Kiloton)
Table 73 Europe: High Performance Composites Market Size, By Fiber Type, 2015–2022 (USD Million)
Table 74 Europe: High Performance Composites Market Size, By Fiber Type, 2015–2022 (Kiloton)
Table 75 Europe: High Performance Composites Market Size, By Manufacturing Process, 2015–2022 (USD Million)
Table 76 Europe: High Performance Composites Market Size, By Manufacturing Process, 2015–2022 (Kiloton)
Table 77 Europe: High Performance Composites Market Size, By Application, 2015–2022 (USD Million)
Table 78 Europe: High Performance Composites Market Size, By Application, 2015–2022 (Kiloton)
Table 79 Germany: High Performance Composites Market Size, By Resin Type, 2015–2022 (USD Million)
Table 80 Germany: High Performance Composites Market Size, By Fiber Type, 2015–2022 (USD Million)
Table 81 Germany: High Performance Composites Market Size, By Manufacturing Process, 2015–2022 (USD Million)
Table 82 Germany: High Performance Composites Market Size, By Application, 2015–2022 (USD Million)
Table 83 U.K.: High Performance Composites Market Size, By Resin Type, 2015–2022 (USD Million)
Table 84 U.K.: High Performance Composites Market Size, By Fiber Type, 2015–2022 (USD Million)
Table 85 U.K.: High Performance Composites Market Size, By Manufacturing Process, 2015–2022 (USD Million)
Table 86 U.K.: High Performance Composites Market Size, By Application, 2015–2022 (USD Million)
Table 87 France: High Performance Composites Market Size, By Resin Type, 2015–2022 (USD Million)
Table 88 France: High Performance Composites Market Size, By Fiber Type, 2015–2022 (USD Million)
Table 89 France: High Performance Composites Market Size, By Manufacturing Process, 2015–2022 (USD Million)
Table 90 France: High Performance Composites Market Size, By Application, 2015–2022 (USD Million)
Table 91 Italy: High Performance Composites Market Size, By Resin Type, 2015–2022 (USD Million)
Table 92 Italy: High Performance Composites Market Size, By Fiber Type, 2015–2022 (USD Million)
Table 93 Italy: High Performance Composites Market Size, By Manufacturing Process, 2015–2022 (USD Million)
Table 94 Italy: High Performance Composites Market Size, By Application, 2015–2022 (USD Million)
Table 95 Spain: High Performance Composites Market Size, By Resin Type, 2015–2022 (USD Million)
Table 96 Spain: High Performance Composites Market Size, By Fiber Type, 2015–2022 (USD Million)
Table 97 Spain: High Performance Composites Market Size, By Manufacturing Process, 2015–2022 (USD Million)
Table 98 Spain: High Performance Composites Market Size, By Application, 2015–2022 (USD Million)
Table 99 Rest of Europe: High Performance Composites Market Size, By Resin Type, 2015–2022 (USD Million)
Table 100 Rest of Europe: High Performance Composites Market Size, By Fiber Type, 2015–2022 (USD Million)
Table 101 Rest of Europe: High Performance Composites Market Size, By Manufacturing Process, 2015–2022 (USD Million)
Table 102 Rest of Europe: High Performance Composites Market Size, By Application, 2015–2022 (USD Million)
Table 103 Asia-Pacific: High Performance Composites Market Size, By Country, 2015–2022 (USD Million)
Table 104 Asia-Pacific: High Performance Composites Market Size, By Country, 2015–2022 (Kiloton)
Table 105 Asia-Pacific: High Performance Composites Market Size, By Resin Type, 2015–2022 (USD Million)
Table 106 Asia-Pacific: High Performance Composites Market Size, By Resin Type, 2015–2022 (Kiloton)
Table 107 Asia-Pacific: High Performance Composites Market Size, By Fiber Type, 2015–2022 (USD Million)
Table 108 Asia-Pacific: High Performance Composites Market Size, By Fiber Type, 2015–2022 (Kiloton)
Table 109 Asia-Pacific: High Performance Composites Market Size, By Manufacturing Process, 2015–2022 (USD Million)
Table 110 Asia-Pacific: High Performance Composites Market Size, By Manufacturing Process, 2015–2022 (Kiloton)
Table 111 Asia-Pacific: High Performance Composites Market Size, By Application, 2015–2022 (USD Million)
Table 112 Asia-Pacific: High Performance Composites Market Size, By Application, 2015–2022 (Kiloton)
Table 113 China: High Performance Composites Market Size, By Resin Type, 2015–2022 (USD Million)
Table 114 China: High Performance Composites Market Size, By Fiber Type, 2015–2022 (USD Million)
Table 115 China: High Performance Composites Market Size, By Manufacturing Process, 2015–2022 (USD Million)
Table 116 China: High Performance Composites Market Size, By Application, 2015–2022 (USD Million)
Table 117 Japan: High Performance Composites Market Size, By Resin Type, 2015–2022 (USD Million)
Table 118 Japan: High Performance Composites Market Size, By Fiber Type, 2015–2022 (USD Million)
Table 119 Japan: High Performance Composites Market Size, By Manufacturing Process, 2015–2022 (USD Million)
Table 120 Japan: High Performance Composites Market Size, By Application, 2015–2022 (USD Million)
Table 121 South Korea: High Performance Composites Market Size, By Resin Type, 2015–2022 (USD Million)
Table 122 South Korea: High Performance Composites Market Size, By Fiber Type, 2015–2022 (USD Million)
Table 123 South Korea: High Performance Composites Market Size, By Manufacturing Process, 2015–2022 (USD Million)
Table 124 South Korea: High Performance Composites Market Size, By Application, 2015–2022 (USD Million)
Table 125 India: High Performance Composites Market Size, By Resin Type, 2015–2022 (USD Million)
Table 126 India: High Performance Composites Market Size, By Fiber Type, 2015–2022 (USD Million)
Table 127 India: High Performance Composites Market Size, By Manufacturing Process, 2015–2022 (USD Million)
Table 128 India: High Performance Composites Market Size, By Application, 2015–2022 (USD Million)
Table 129 Indonesia: High Performance Composites Market Size, By Resin Type, 2015–2022 (USD Million)
Table 130 Indonesia: High Performance Composites Market Size, By Fiber Type, 2015–2022 (USD Million)
Table 131 Indonesia: High Performance Composites Market Size, By Manufacturing Process, 2015–2022 (USD Million)
Table 132 Indonesia: High Performance Composites Market Size, By Application, 2015–2022 (USD Million)
Table 133 Rest of Asia-Pacific: High Performance Composites Market Size, By Resin Type, 2015–2022 (USD Million)
Table 134 Rest of Asia-Pacific: High Performance Composites Market Size, By Fiber Type, 2015–2022 (USD Million)
Table 135 Rest of Asia-Pacific: High Performance Composites Market Size, By Manufacturing Process, 2015–2022 (USD Million)
Table 136 Rest of Asia-Pacific: High Performance Composites Market Size, By Application, 2015–2022 (USD Million)
Table 137 Middle East & Africa: High Performance Composites Market Size, By Country, 2015–2022 (USD Million)
Table 138 Middle East & Africa: High Performance Composites Market Size, By Country, 2015–2022 (Kiloton)
Table 139 Middle East & Africa: High Performance Composites Market Size, By Resin Type, 2015–2022 (USD Million)
Table 140 Middle East & Africa: High Performance Composites Market Size, By Resin Type, 2015–2022 (Kiloton)
Table 141 Middle East & Africa: High Performance Composites Market Size, By Fiber Type, 2015–2022 (USD Million)
Table 142 Middle East & Africa: High Performance Composites Market Size, By Fiber Type, 2015–2022 (Kiloton)
Table 143 Middle East & Africa: High Performance Composites Market Size, By Manufacturing Process, 2015–2022 (USD Million)
Table 144 Middle East & Africa: High Performance Composites Market Size, By Manufacturing Process, 2015–2022 (Kiloton)
Table 145 Middle East & Africa: High Performance Composites Market Size, By Application, 2015–2022 (USD Million)
Table 146 Middle East & Africa: High Performance Composites Market Size, By Application, 2015–2022 (Kiloton)
Table 147 UAE: High Performance Composites Market Size, By Resin Type, 2015–2022 (USD Million)
Table 148 UAE: High Performance Composites Market Size, By Fiber Type, 2015–2022 (USD Million)
Table 149 UAE: High Performance Composites Market Size, By Manufacturing Process, 2015–2022 (USD Million)
Table 150 UAE: High Performance Composites Market Size, By Application, 2015–2022 (USD Million)
Table 151 Saudi Arabia: High Performance Composites Market Size, By Resin Type, 2015–2022 (USD Million)
Table 152 Saudi Arabia: High Performance Composites Market Size, By Fiber Type, 2015–2022 (USD Million)
Table 153 Saudi Arabia: High Performance Composites Market Size, By Manufacturing Process, 2015–2022 (USD Million)
Table 154 Saudi Arabia: High Performance Composites Market Size, By Application, 2015–2022 (USD Million)
Table 155 South Africa: High Performance Composites Market Size, By Resin Type, 2015–2022 (USD Million)
Table 156 South Africa: High Performance Composites Market Size, By Fiber Type, 2015–2022 (USD Million)
Table 157 South Africa: High Performance Composites Market Size, By Manufacturing Process, 2015–2022 (USD Million)
Table 158 Saudi Arabia: High Performance Composites Market Size, By End-Use Industry, 2015–2022 (USD Million)
Table 159 Rest of Middle East & Africa: High Performance Composites Market Size, By Resin Type, 2015–2022 (USD Million)
Table 160 Rest of Middle East & Africa: High Performance Composites Market Size, By Fiber Type, 2015–2022 (USD Million)
Table 161 Rest of Middle East & Africa: High Performance Composites Market Size, By Manufacturing Process, 2015–2022 (USD Million)
Table 162 Rest of Middle East & Africa: High Performance Composites Market Size, By Application, 2015–2022 (USD Million)
Table 163 South America: High Performance Composites Market Size, By Country, 2015–2022 (USD Million)
Table 164 South America: High Performance Composites Market Size, By Country, 2015–2022 (Kiloton)
Table 165 South America: High Performance Composites Market Size, By Resin Type, 2015–2022 (USD Million)
Table 166 South America: High Performance Composites Market Size, By Resin Type, 2015–2022 (Kiloton)
Table 167 South America: High Performance Composites Market Size, By Fiber Type, 2015–2022 (USD Million)
Table 168 South America: High Performance Composites Market Size, By Fiber Type, 2015–2022 (Kiloton)
Table 169 South America: High Performance Composites Market Size, By Manufacturing Process, 2015–2022 (USD Million)
Table 170 South America : High Performance Composites Market Size, By Manufacturing Process, 2015–2022 (Kiloton)
Table 171 South America : High Performance Composites Market Size, By Application, 2015–2022 (USD Million)
Table 172 South America: High Performance Composites Market Size, By Application, 2015–2022 (Kiloton)
Table 173 Brazil: High Performance Composites Market Size, By Resin Type, 2015–2022 (USD Million)
Table 174 Brazil: High Performance Composites Market Size, By Fiber Type, 2015–2022 (USD Million)
Table 175 Brazil: High Performance Composites Market Size, By Manufacturing Process, 2015–2022 (USD Million)
Table 176 Brazil: High Performance Composites Market Size, By Application, 2015–2022 (USD Million)
Table 177 Argentina: High Performance Composites Market Size, By Resin Type, 2015–2022 (USD Million)
Table 178 Argentina: High Performance Composites Market Size, By Fiber Type, 2015–2022 (USD Million)
Table 179 Argentina: High Performance Composites Market Size, By Manufacturing Process, 2015–2022 (USD Million)
Table 180 Argentina: High Performance Composites Market Size, By Application, 2015–2022 (USD Million)
Table 181 Rest of the South America: High Performance Composites Market Size, By Resin Type, 2015–2022 (USD Million)
Table 182 Rest of the South America: High Performance Composites Market Size, By Fiber Type, 2015–2022 (USD Million)
Table 183 Rest of the South America: High Performance Composites Market Size, By Manufacturing Process, 2015–2022 (USD Million)
Table 184 Rest of the South America: High Performance Composites Market Size, By Application, 2015–2022 (USD Million)
Table 185 Major High Performance Composites Manufacturers and Their Ranks, 2016
List of Figures (36 Figures)
Figure 1 High Performance Composites Market Segmentation
Figure 2 High Performance Composites Market: Research Design
Figure 3 Market Size Estimation: Bottom-Up Approach
Figure 4 Market Size Estimation: Top-Down Approach
Figure 5 High Performance Composites Market: Data Triangulation
Figure 6 Thermosets to Be the Largest Segment Between 2017 and 2022
Figure 7 Carbon Fiber Composites to Be the Largest Fiber Type Segment Between 2017 and 2022
Figure 8 Lay-Up Process to Be the Largest Segment Between 2017 and 2022
Figure 9 Aerospace & Defense to Dominate High Performance Composites Market Between 2017 and 2022
Figure 10 North America Dominates High Performance Composites Market
Figure 11 Increasing Demand From Applications to Drive High Performance Composites Market
Figure 12 China the Largest Market and Aerospace & Defence the Largest Application for High Performance Composite
Figure 13 High Performance Composites Market in Aerospace & Defense Industry to Account for the Largest Share Between 2017 and 2022
Figure 14 Carbon Fiber Composites Accounted for the Largest Market Share in 2016
Figure 15 North America Led High Performance Composites Market in 2016
Figure 16 Drivers, Restraints, Opportunities, and Challenges in High Performance Composites Market
Figure 17 Porter’s Five Forces Analysis
Figure 18 Thermoset Resins Accounted for the Larger Market Size in the High Performance Composites Market Between 2017 and 2022
Figure 19 Carbon Fiber Composites Accounted for the Largest Share of the High Performance Composites Market Between 2017 and 2022
Figure 20 Lay-Up Manufacturing Process to Dominate the High Performance Composites Market, 2017–2022
Figure 21 Aerospace & Defense to Be the Largest Application for High Performance Composites Between 2017 and 2022
Figure 22 India and China are Emerging as the New Strategic Locations
Figure 23 North America High Performance Composites Market Snapshot: U.S. is the Largest and the Fastest-Growing Market
Figure 24 Asia-Pacific Market Snapshot: China Dominates the High Performance Composites in Asia-Pacific
Figure 25 Competitive Leadership Mapping, 2016
Figure 26 Toray Industries Inc.: Company Snapshot
Figure 27 SLG Group – the Carbon Company: Company Snapshot
Figure 28 Koninklijke Ten Cate BV: Company Snapshot
Figure 29 TPI Composites, Inc.: Company Snapshot
Figure 30 Solvay S.A.: Company Snapshot
Figure 31 Hexcel Corporation: Company Snapshot
Figure 32 Owens Corning Corporation: Company Snapshot
Figure 33 Teijin Ltd.: Company Snapshot
Figure 34 BASF SE: Company Snapshot
Figure 35 Albany International Corporation: Company Snapshot
Figure 36 Arkema SA: Company Snapshot


Growth opportunities and latent adjacency in High Performance Composites Market