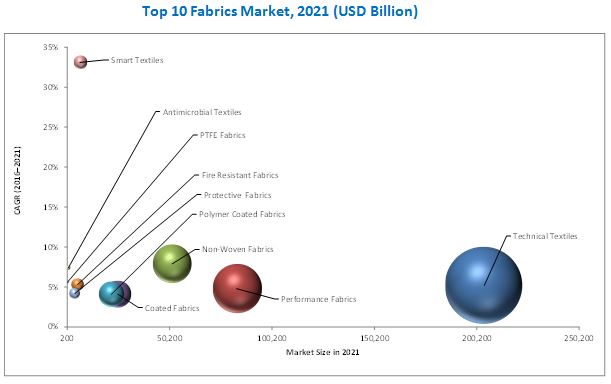
Top 10 Fabrics Market (Antimicrobial Textiles, Coated Fabrics, Fire Resistant Fabrics, Non- Woven Fabrics/Textiles, Performance Fabrics, Polymer Coated Fabrics, Protective Fabrics, PTFE Fabrics, Smart Textile, and Technical Textile) - Global Forecast to 2021


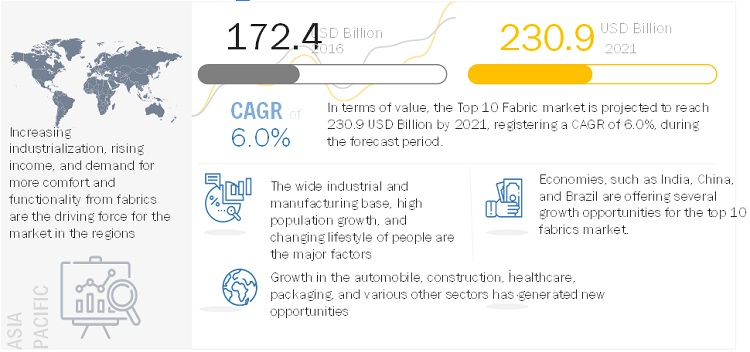
[202 Pages Report] The top 10 fabrics market size is estimated to be USD 172.4 billion in 2016 and is projected to reach USD 230.9 billion by 2021, at a CAGR of 6.0% between 2016 and 2021. This study analyzes and provides information on top 10 fabrics (textiles) markets. The markets which are covered are technical textile, performance fabrics, non-woven fabric, coated fabrics, polymer coated, fire resistant, protective, smart textile, antimicrobial textile and PTFE fabric.
Technical textiles are a global knowledge-based research-oriented industry. In the last few years, the sector has been gaining slow but steady growth worldwide, due to the technical performance and functional properties it offers to the global textiles industry. A technical textile is a special type of material or product designed for specific purposes and offers unique and exclusive characteristics and properties that are far different from those of normal fabrics. Performance fabrics are engineered for a wide variety of uses, where the performance of the fabric is the major parameter. They provide extra comfort and protection to the end user under normal to extreme conditions. Coated fabrics, polyamide, high-tenacity polyester, composite fabrics, and aramids are the leading performance fabrics used globally. Smart textiles are materials that can react or adapt to external stimuli (mechanical, electrical, thermal, or chemical) or changing environmental conditions. The stimuli can include changes in temperature, moisture, chemical sources, electric or magnetic fields, PH, or stress. The concept of smart textiles has materialized from the development of wearable electronics.
Attractive Opportunities in the Top 10 Fabrics Market
To know about the assumptions considered for the study, Request for Free Sample Report
Market Dynamics
The market for top 10 fabrics is primarily dependent on demand and supply relationships. Several factors directly and indirectly affect the top 10 fabrics market such as increasing demand for higher functioning and more comfortable fabrics, stringent regulations concerning worker safety, development in emerging regions, and availability of substitutes along with rising demand from the end-use industries.
The top 10 fabric market is expected to witness significant growth in the future with the increasing popularity of its benefits and number of applications offered in various industry. The industry has grown exponentially in the last few years and this trend is projected to continue. Growth in the automobile, construction, healthcare, packaging, and various other sectors has generated new opportunities.
�The fabrics is the largest type of top 10 fabrics for top 10 fabrics market in 2016�
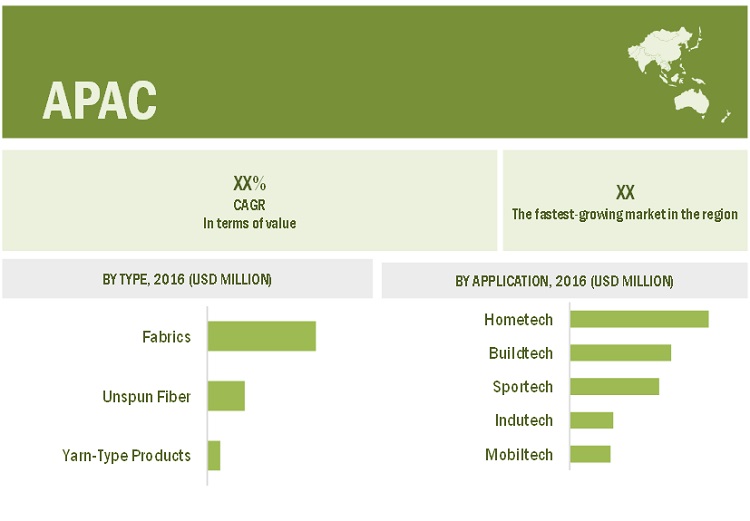
Fabrics products contribute to almost two-thirds of the overall market share for final textile products. It is widely used in industries such as construction, high-performance clothing & garments, carpets, furnishing, and heavyweight packaging. Unspun fiber products occupies second largest position of the overall market share, and is second widely used final product type. Yarn-type products have a lesser but significant share. It is used in applications such as sports components, thread, fishing line, swings, rope, and twine.
�Mobiltech is estimated to be the largest application of top 10 fabrics market between 2016 and 2021.�
Mobiltech is the largest market in terms of valie, in 2021. The growth in the segment is due to increase in concern for safety, security, and comfort in automobiles, railways, aerospace, and ships. Indutech and sportech are two other segments projected to be rapidly growing in the top 10 fabrics markets. The major prospective growth areas for Mobiltech in the global market are automobile, medical & hygiene, construction, clothing & garments, sports & leisure, pollution control, and environmental protection.
�Asia Pacific is expected to be the largest top 10 fabrics market during the forecast period, in terms of value.�
Asia-Pacific is the leading market for global top 10 fabrics market. The region�s market is projected to account for the largest of the global market by 2021. The wide industrial and manufacturing base, high population growth, and changing lifestyle of people are the major factors for Asia-Pacific�s dominance in the market. North America is likely to be the fastest-growing market between 2016 and 2021 due to its reviving industrial and construction sectors as well as rising fitness consciousness in North America.
To know about the assumptions considered for the study, download the pdf brochure
Key Market Players
The key market players profiled in the report include E.I. Du Pont De Nemours and Co (U.S.), Asahi Kasei Corporation (Japan), Kimberly-Clarke Corporation (U.S.), Mitsui Chemicals, Inc. (Tokyo), and Freudenberg & Co. KG. (Germany).
Recent Developments
- In 2016, Asahi Kasei developed new production line for Duranol Polycarbonatediol (PCD) and Duranate hexamethylene diisocyanate (HDI) in China
- In 2016, Mitsui Chemical Inc. expanded PP spunbound nonwovens in Japan.
Key questions addressed by the report
- What are the factors influencing the growth of top 10 fabrics market?
- What are different application of top 10 fabrics market?
- What is the biggest restraint for top 10 fabrics market?
To speak to our analyst for a discussion on the above findings, click Speak to Analyst
 Exclusive indicates content/data unique to MarketsandMarkets and not available with any competitors.
Top 10 fabrics are used in various industrial sectors such as building & construction, automobile, electricals & electronics, medical, and personal care. The top 10 fabrics market has been segmented into various markets such as, antimicrobial textiles, polymer coated fabrics Polytetrafluoroethylene (PTFE) fabrics, and many more.
Antimicrobial textiles are fiber based substrates on which antimicrobial agents are either coated or incorporated, to either kill or inhibit the growth of microorganisms. These are used for applications such as, sportswear, workwear, protective wear, curtains & drapes, carpets, surgical supplies, bedding, intimates, and footwear. The antimicrobial textiles market is witnessing high growth owing to increasing end-use applications such as medical textiles and apparel. The growth in the antimicrobial textiles market is also backed by the growing healthcare market and increasing awareness regarding health and hygiene.
Polymer coated fabrics are manufactured from various mixtures and emulsions of different polymers or using individual polymers such as PVC, PU, PP, PE, and nylon among others. Polymer coatings provide various properties to fabrics. Polymer coated fabrics have advantages such as, high resistance to fire, water and abrasion, and are relatively inexpensive when compared to other coated fabrics. Factors such as, the surging demand from the transportation, protective clothing, and industrial applications and increasing safety concerns and stringent government regulations for the provision of safety to workers are expected to augment the growth of the global polymer coated fabrics market.
PTFE fabric commonly known as Teflon, is used in end-use industries such as, construction, chemical, food, packaging, and textile, among others. The PTFE fabric has various notable properties such as, being non-stick, friction-free, self-lubricating, non-flammable, non-brittle, and non-toxic; and is resistant to atmospheric conditions, fungus growth, and chemicals. The rising demand from the construction industry in applications such as, pipe and line fittings, tubes, rods, and for constructing roofs or sheets, and also the rising demand from the medical industry in applications such as, cardiovascular & peripheral vascular grafts, plastic surgery, orthopedics, and dental, among others, are driving the growth of the PTFE fabric market.
Some of the key players in the top 10 fabrics market are, E. I. du Pont de Nemours and Company (U.S.), Koninklijke Ten Cate nv (Netherlands), W. L. Gore & Associates, Inc. (U.S.), Low & Bonar plc (U.K.), and Teijin Limited (Japan), among others. These players compete with each other, in terms of prices, and offer a wide range of products to meet the market requirements. The companies are primarily focused on research & development of new products for the market and this is evident in the high number of new product launches.
To speak to our analyst for a discussion on the above findings, click Speak to Analyst
Table of Contents
1 Introduction (Page No. - 24)
1.1 Objectives of the Study
1.2 Scope of the Study
1.2.1 Years Considered for the Study
1.3 Currency
1.4 Limitations
1.5 Stakeholders
2 Research Methodology (Page No. - 27)
2.1 Research Data
2.2 Market Size Estimation
2.3 Data Triangulation
2.4 Research Assumptions and Limitations
2.4.1 Assumptions
3 Executive Summary (Page No. - 32)
3.1 Market Segmentation
3.2 Antimicrobial Textiles
3.3 Coated Fabrics Market
3.4 Fire Resistant Fabrics Market
3.5 Non-Woven Fabrics/Textile Market
3.6 Performance Fabrics Market
3.7 Polymer Coated Fabrics Market
3.8 Protective Fabrics Market
3.9 PTFE Fabric Market
3.10 Smart Textiles Market
3.11 Technical Textile Market
4 Non-Woven Fabrics/Textiles Market (Page No. - 38)
4.1 Market Definition
4.2 Market Overview
4.2.1 Introduction
4.2.2 Market Dynamics
4.3 Industry Trends
4.3.1 Value Chain
4.3.1.1 Manufacturing
4.3.1.2 Bonding
4.3.1.2.1 Thermal Bonding
4.3.1.2.2 Chemical Bonding
4.3.1.2.3 Mechanical Bonding
4.3.1.3 Finishing
4.3.1.3.1 Chemical Finishing
4.3.1.3.2 Mechanical Finishing
4.3.2 Porter�s Five Forces Analysis
4.4 Non-Woven Fabrics Market, By Technology
4.4.1 Introduction
4.4.2 Non-Woven Fabrics Market, By Technology
4.4.2.1 Dry Laid
4.4.2.2 Spunmelt
4.4.2.3 Wet Laid
4.4.2.4 Others
4.5 Non-Woven Fabrics Market, By Material
4.5.1 Introduction
4.5.2 Non-Woven Fabrics Market Size, By Material
4.5.2.1 PP (Polypropylene)
4.5.2.2 PET (Polyethylene Terephthalate)
4.5.2.3 PE (Polyethylene)
4.5.2.4 Rayon
4.5.2.5 Wood Pulp
4.5.2.6 BICO
4.5.2.7 Others
4.6 Non-Woven Fabrics Market, By End Use
4.6.1 Introduction
4.6.2 Non-Woven Fabrics Market Size, By End Use
4.6.2.1 Hygiene
4.6.2.2 Construction
4.6.2.3 Wipes
4.6.2.4 Upholstery
4.6.2.5 Filtration
4.6.2.6 Automobile
4.6.2.7 Others
4.6.2.7.1 Medical
4.6.2.7.2 Industrial/Military
4.6.2.7.3 Geotextiles
4.6.2.7.4 Agriculture & Landscaping
4.6.2.7.5 Office & Stationary/Leisure/Shoe & Leather
4.7 Non-Woven Fabrics Market, By Function
4.7.1 Introduction
4.7.2 Non-Woven Fabrics Market Size, By Function
4.7.2.1 Disposable
4.7.2.2 Non-Disposable
4.8 Non-Woven Fabrics Market, By Region
4.8.1 Introduction
4.8.2 Non-Woven Fabrics Market Size, By Region
4.9 Competitive Landscape
4.9.1 Overview
5 Technical Textiles Market (Page No. - 59)
5.1 Market Definition
5.2 Market Overview
5.2.1 Introduction
5.2.2 Market Dynamics
5.3 Industry Trends
5.3.1 Introduction
5.3.2 Value Chain Analysis
5.3.3 Porter�s Five Forces Analysis
5.4 Technical Textiles Market, By Application
5.4.1 Introduction
5.4.2 Technical Textiles Market, By Application
5.5 Technical Textiles Market, By Product Type
5.5.1 Introduction
5.5.2 Technical Textiles Market, By Product Type
5.6 Technical Textiles Market, By Fiber Type
5.6.1 Introduction
5.6.2 Technical Textiles Market, By Fiber Type
5.7 Technical Textiles Market, By Fabric Type
5.7.1 Introduction
5.7.2 Technical Textiles Market, By Fabric Type
5.8 Technical Textiles Market, By Region
5.8.1 Introduction
5.9 Competitive Landscape
5.9.1 Introduction
5.9.2 Strategic Overview
6 Performance Fabrics Market (Page No. - 71)
6.1 Market Definition
6.2 Market Overview
6.2.1 Introduction
6.2.2 Market Dynamics
6.3 Industry Trends
6.3.1 Value-Chain Analysis
6.3.1.1 Raw Materials
6.3.1.2 Manufacturing
6.3.1.3 Distribution
6.3.1.4 Marketing and Sales
6.3.2 Porter�s Five Forces Analysis
6.4 Performance Fabrics Market, By Type
6.4.1 Introduction
6.4.2 Performance Fabrics Market, By Type
6.4.2.1 Coated Fabrics
6.4.2.2 Polyamide
6.4.2.3 High-Tenacity Polyester
6.4.2.4 Composite Fabrics
6.4.2.5 Aramid
6.4.2.6 Other Performance Fabrics
6.5 Performance Fabrics Market, By Application
6.5.1 Introduction
6.5.2 Performance Fabrics Market, By Application
6.5.2.1 Water Resistance
6.5.2.2 Stain Resistance
6.5.2.3 Abrasion Resistance
6.5.2.4 Anti-Microbial
6.5.2.5 Fire Resistance
6.5.2.6 UV Resistance
6.5.2.7 Other Applications
6.6 Performance Fabrics Market, By End-Use Industry
6.6.1 Introduction
6.6.2 Performance Fabrics Market, By End-Use Industry
6.6.2.1 Industrial
6.6.2.2 Defence & Public Safety
6.6.2.3 Construction
6.6.2.4 Fire-Fighting
6.6.2.5 Aerospace & Automotive
6.6.2.6 Sports Apparel
6.6.2.7 Other End-Use Industries
6.7 Performance Fabrics Market, By Region
6.7.1 Introduction
6.7.2 Performance Fabrics Market, By Region
6.8 Competitive Landscape
6.8.1 Overview
7 Coated Fabrics Market (Page No. - 86)
7.1 Market Definition
7.2 Market Overview
7.2.1 Introduction
7.2.2 Market Dynamics
7.3 Industry Trends
7.3.1 Introduction
7.3.2 Value Chain Analysis
7.3.3 Porter�s Five Forces Analysis: Coated Fabrics
7.4 Coated Fabrics Market, By Product
7.4.1 Introduction
7.4.2 Market Size and Projection, By Product
7.4.2.1 Polymer Coated Fabrics
7.4.2.2 Rubber Coated Fabrics
7.4.2.3 Fabric-Backed Wall Coverings
7.5 Coated Fabrics Market, By Application
7.5.1 Introduction
7.5.2 Market Size and Projection, By Application
7.5.2.1 Transportation
7.5.2.2 Protective Clothing
7.5.2.3 Industrial
7.5.2.4 Roofing, Awnings & Canopies
7.5.2.5 Furniture & Seating
7.5.2.6 Others
7.6 Coated Fabrics Market, By Region
7.6.1 Introduction
7.6.2 Market Size and Projection, By Region
7.7 Competitive Landscape
7.7.1 Overview
8 Polymer Coated Fabrics Market (Page No. - 99)
8.1 Market Definition
8.2 Market Overview
8.2.1 Introduction
8.2.2 Market Dynamics
8.3 Industry Trends
8.3.1 Introduction
8.3.2 Value Chain Analysis
8.3.3 Porter�s Five Forces Analysis: Polymer Coated Fabrics
8.4 Polymer Coated Fabrics Market, By Product
8.4.1 Introduction
8.4.2 Market Size & Projection, By Product
8.4.2.1 Vinyl Coated Fabrics
8.4.2.2 Pu Coated Fabrics
8.4.2.3 PE Coated Fabrics
8.4.2.4 Other Polymer Coated Fabrics
8.4.2.4.1 Other Polymer Coated Fabrics
8.5 Polymer Coated Fabrics Market, By Application
8.5.1 Introduction
8.5.2 Market Size & Projection, By Application
8.5.2.1 Transportation
8.5.2.2 Protective Clothing
8.5.2.3 Industrial
8.5.2.4 Roofing, Awnings, & Canopies
8.5.2.5 Furniture & Seating
8.5.2.6 Others
8.6 Polymer Coated Fabrics Market, By Region
8.6.1 Introduction
8.6.2 Market Size and Projection, By Region
8.7 Competitive Landscape
8.7.1 Overview
9 Protective Fabrics Market (Page No. - 112)
9.1 Market Definition
9.2 Market Overview
9.2.1 Introduction
9.2.2 Market Dynamics
9.3 Industry Trends
9.3.1 Value Chain Analysis
9.3.2 Porter�s Five Forces Analysis
9.4 Protective Fabrics Market, By Raw Material
9.4.1 Introduction
9.4.2 Market Size and Projection
9.4.2.1 Aramid
9.4.2.2 Polyamide
9.4.2.3 Polyolefin
9.4.2.4 PBI
9.4.2.5 Cotton Fibers
9.4.2.6 Polyesters
9.4.2.7 Others
9.5 Protective Fabrics Market, By Type
9.5.1 Introduction
9.5.2 Market Size and Projection
9.5.2.1 Fire- & Heat-Resistant Fabrics
9.5.2.2 Chemical-Resistant Fabrics
9.5.2.3 UV-Resistant Fabrics
9.5.2.4 Others
9.6 Protective Fabrics Market, By End-Use Industry
9.6.1 Introduction
9.6.1.1 Building & Construction
9.6.1.2 Visibility
9.6.1.3 Arc Protection
9.6.1.4 Oil & Gas
9.6.1.5 Firefighting
9.6.1.6 Cleaning Room Protection
9.6.1.7 Bio-Hazard Protection
9.6.1.8 Law Enforcement & Military
9.6.1.8.1 Tactical Vest
9.6.1.8.2 Helmets
9.6.1.8.3 Body Armor
9.6.1.8.4 Head Gear
9.6.1.8.5 Vehicles
9.6.1.9 Others
9.6.1.9.1 Thermal Resistance
9.6.1.9.2 Cut & Abrasion Resistance
9.6.1.9.3 Protection From Non-Hazardous Exposure
9.6.1.9.4 General Industrial Purpose
9.7 Protective Fabrics Market, By Region
9.7.1 Introduction
9.7.2 Protective Fabrics Market, By Region
9.8 Competitive Landscape
9.8.1 Overview
10 Fire Resistant Fabrics Market (Page No. - 126)
10.1 Market Definition
10.2 Market Overview
10.2.1 Introduction
10.2.2 Market Dynamics
10.3 Industry Trends
10.3.1 Introduction
10.3.2 Value Chain Analysis
10.3.2.1 Raw Materials
10.3.2.2 Manufacturing
10.3.2.3 Final Product
10.3.2.4 End-Use
10.3.3 Porter�s Five Forces Analysis
10.4 Fire-Resistant Fabrics Market, By Type
10.4.1 Introduction
10.4.2 Treated Fire-Resistant Fabrics
10.4.2.1 Fire-Resistant Cotton
10.4.2.2 Fire-Resistant Viscose
10.4.2.3 Fire-Resistant Polyester
10.4.2.4 Fire-Resistant Nylon 6
10.4.3 Inherent Fire-Resistant Fabrics
10.4.3.1 Aramid
10.4.3.2 PBI (Polybenzimidazole)
10.4.3.3 Modacrylic
10.4.3.4 Polyamide
10.4.3.5 PI (Polyimide)
10.5 Fire-Resistant Fabrics Market, By Application
10.5.1 Introduction
10.5.2 Market Size Estimation
10.5.2.1 Apparel
10.5.2.1.1 Protective Clothing
10.5.2.2 Non-Apparel
10.5.2.2.1 Interior Fabric for Transportation
10.5.2.2.2 Household & Industrial
10.6 Fire-Resistant Fabrics Market, By End-Use Industry
10.6.1 Introduction
10.6.2 Fire-Resistant Fabrics Market, By End-Use Industry
10.6.2.1 Industrial
10.6.2.1.1 Construction & Manufacturing
10.6.2.1.2 Oil & Gas
10.6.2.1.3 Others
10.6.2.2 Defense & Public Safety Services
10.6.2.2.1 Military
10.6.2.2.2 Firefighting & Law Enforcement
10.6.2.3 Transport
10.6.2.3.1 Railways
10.6.2.3.2 Aircraft
10.6.2.3.3 Marine
10.6.2.3.4 Automotive
10.6.2.3.5 Others
10.7 Fire-Resistant Fabrics Market, By Region
10.7.1 Introduction
10.7.2 Fire-Resistant Fabrics Market, By Region
10.8 Competitive Landscape
10.8.1 Overview
11 PTFE Fabric Market (Page No. - 141)
11.1 Market Definition
11.2 Market Overview
11.2.1 Introduction
11.2.2 Market Dynamics
11.3 Industry Trends
11.3.1 Value Chain Analysis
11.3.1.1 Raw Materials
11.3.1.2 Manufacturers
11.3.1.3 Processors
11.3.1.4 End-Use Industry
11.4 PTFE Fabric Market, By Type
11.4.1 Introduction
11.4.2 PTFE Fabric Market, By Type
11.4.2.1 Glass Mesh Fabric
11.4.2.2 Glass Fiber Fabric
11.5 PTFE Fabric Market, By End-Use Industry
11.5.1 Introduction
11.5.2 PTFE Fabric Market, By End-Use Industry
11.5.2.1 Construction
11.5.2.2 Packaging
11.5.2.3 Chemical
11.5.2.4 Textile
11.5.2.5 Others
11.6 PTFE Fabric Market, By Region
11.6.1 Introduction
11.6.2 PTFE Fabric Market, By Region
11.7 Competitive Landscape
11.7.1 Overview
12 Smart Textiles Market (Page No. - 149)
12.1 Market Definition
12.2 Market Overview
12.2.1 Introduction
12.2.2 Market Dynamics
12.3 Industry Trends
12.3.1 Porter�s Five Forces Analysis
12.4 Smart Textile Market, By Type
12.4.1 Introduction
12.4.2 Passive Smart Textiles
12.4.3 Active Smart Textiles
12.4.4 Ultra Smart Textiles
12.5 Smart Textiles Market, By Function
12.5.1 Introduction
12.5.1.1 Sensing
12.5.1.2 Energy Harvesting
12.5.1.3 Luminescence & Aesthetics
12.5.1.4 Thermo-Electricity
12.6 Smart Textiles Market, By End-User Industry
12.6.1 Introduction
12.6.1.1 Military and Protection
12.6.1.2 Architecture
12.6.1.3 Healthcare
12.6.1.4 Sports and Fitness
12.6.1.5 Fashion and Entertainment
12.6.1.6 Automotive
12.6.1.7 Others
12.7 Regional Analysis
12.7.1 Introduction
12.7.2 Regional Analysis
12.8 Competitive Landscape
12.8.1 Overview
13 Antimicrobial Textiles Market (Page No. - 160)
13.1 Market Definition
13.2 Market Overview
13.2.1 Introduction
13.2.2 Market Dynamics
13.3 Industry Trends
13.3.1 Introduction
13.3.2 Value-Chain Analysis
13.3.3 Porter�s Five Forces Analysis
13.4 Antimicrobial Textiles Market, By Agents
13.4.1 Introduction
13.4.2 Antimicrobial Textiles Market, By Agents
13.4.2.1 Synthetic Organic Compounds
13.4.2.1.1 Quaternary Ammonium Compounds
13.4.2.1.2 Triclosan
13.4.2.1.3 Polyhexamethylene Biguanides (PHMB)
13.4.2.1.4 Zinc Pyrithione
13.4.2.1.5 N-Halamine
13.4.2.2 Metal & Metallic Salts
13.4.2.2.1 Silver
13.4.2.2.2 Copper
13.4.2.2.3 Zinc
13.4.2.2.4 Others (Zeolites, Titanium Dioxides)
13.4.2.3 Bio-Based
13.4.2.3.1 Chitosan
13.4.2.3.2 Natural Dyes
13.4.2.3.3 Herbal Extracts
13.5 Antimicrobial Textiles Market, By Finishing Techniques
13.5.1 Introduction
13.5.2 Antimicrobial Textiles Market, By Finishing Techniques
13.5.2.1 Exhaust
13.5.2.2 Pad-Dry-Cure
13.5.2.3 Spraying
13.5.2.4 Foam Finishing Method
13.6 Antimicrobial Textiles Market, By Application
13.6.1 Introduction
13.6.2 Antimicrobial Textiles Market, By Application
13.6.2.1 Commercial
13.6.2.1.1 Protective Wear
13.6.2.1.2 Industrial Laundry
13.6.2.1.3 Others (Window Covers & Tents)
13.6.2.2 Apparel
13.6.2.2.1 Sportswear
13.6.2.2.2 Work Wear
13.6.2.2.3 Intimates
13.6.2.2.4 Outdoor Clothing
13.6.2.3 Medical
13.6.2.3.1 Curtains
13.6.2.3.2 Sheets & Blankets
13.6.2.3.3 Surgical Supplies
13.6.2.3.4 Others (Upholstery, Attire)
13.6.2.4 Home
13.6.2.4.1 Carpet
13.6.2.4.2 Bedding
13.6.2.4.3 Curtains & Drapes
13.6.2.4.4 Others (Awning, Upholstery, Towels, Cleaning Textiles)
13.6.2.5 Other Wearables
13.6.2.5.1 Footwear
13.6.2.5.2 Socks & Shoe Inserts
13.7 Antimicrobial Textiles Market, By Region
13.7.1 Introduction
13.7.2 Antimicrobial Textiles Market Size, By Region
13.8 Competitive Landscape
13.8.1 Overview
14 Company Profiles (Page No. - 177)
(Overview, Financial*, Products & Services, Strategy, and Developments)
14.1 E. I. Du Pont De Nemours and Company
14.2 Koninklijke Ten Cate NV
14.3 W. L. Gore & Associates, Inc.
14.4 Low & Bonar PLC
14.5 Teijin Limited
14.6 Saint Gobain S.A.
14.7 BASF SE
14.8 Kimberly-Clark Corporation
14.9 3M Company
14.10 Gentherm Incorporated
*Details Might Not Be Captured in Case of Unlisted Companies
15 Appendix (Page No. - 198)
15.1 Knowledge Store: Marketsandmarkets� Subscription Portal
15.2 Introducing RT: Real-Time Market Intelligence
15.3 Related Reports
15.4 Author Details
List of Tables (71 Tables)
Table 1 Market Size of Top Ten Fabrics Market (Value)
Table 2 Non-Woven Fabrics Market Size, By Technology, 2014�2021 (USD Million)
Table 3 Non-Woven Fabric Market Size, By Technology, 2014�2021 (KT)
Table 4 Non-Woven Fabrics Market Size, By Material, 2014�2021 (USD Million)
Table 5 Non-Woven Fabric Market Size, By Material, 2014�2021 (KT)
Table 6 Non-Woven Fabrics Market Size, By End-Use, 2014�2021 (USD Million)
Table 7 Non-Woven Fabric Market Size, By End-Use, 2014�2021 (KT)
Table 8 Non-Woven Fabrics Market Size, By Function, 2014�2021 (USD Million)
Table 9 Non-Woven Fabric Market Size, By Function, 2014�2021 (KT)
Table 10 Non-Woven Fabrics Market Size, By Region, 2014�2021 (USD Million)
Table 11 Non-Woven Fabric Market Size, By Region, 2014�2021 (KT)
Table 12 Technical Textiles Market Size, By Application, 2014�2021 (USD Billion)
Table 13 Technical Textiles Market Size, By Application, 2014�2021 (MMT)
Table 14 Technical Textiles Market Size, By Product Type, 2014�2021 (USD Billion)
Table 15 Technical Textiles Market Size, By Product Type, 2014�2021 (MMT)
Table 16 Technical Textiles Market Size, By Fiber Type, 2014�2021 (USD Billion)
Table 17 Technical Textiles Market Size, By Fiber Type , 2014�2021 (MMT)
Table 18 Technical Textiles Market Size, By Fabric Type, 2014�2021 (USD Billion)
Table 19 Technical Textiles Market Size, Fabric Type, 2014�2021 (MMT)
Table 20 Global Technical Textiles Market Size, By Region, 2014�2021 (USD Billion)
Table 21 Global Technical Textiles Market Size, By Region, 2014�2021 (MMT)
Table 22 Performance Fabrics Market Size, By Type, 2014-2021 (Million Square Meter)
Table 23 Performance Fabric Market Size, By Type, 2014-2021 (USD Million)
Table 24 Performance Fabrics Market Size, By Application, 2014-2021 (Million Square Meter)
Table 25 Performance Fabric Market Size, By Application, 2014-2021 (USD Million)
Table 26 Performance Fabrics Market Size, By Region, 2014-2021 ( Million Square Meter)
Table 27 Performance Fabric Market Size, By Region, 2014-2021 (USD Million)
Table 28 Coated Fabrics Market Size, By Product, 2014�2021 (Kiloton)
Table 29 Coated Fabric Market Size, By Product, 2013�2021 (Million Square Meter)
Table 30 Coated Fabrics Market Size, By Product, 2014�2021 (USD Million)
Table 31 Coated Fabric Market Size, By Application, 2014�2021 (Kiloton)
Table 32 Coated Fabrics Market Size, By Application, 2014�2021 (Million Square Meter)
Table 33 Coated Fabric Market Size, By Application, 2014�2021 (USD Million)
Table 34 Coated Fabrics Market Size, By Region, 2014�2021 (Kiloton)
Table 35 Coated Fabric Market Size, By Region, 2014�2021 (Million Square Meter)
Table 36 Coated Fabrics Market Size, By Region, 2014�2021 (USD Million)
Table 37 Polymer Coated Fabrics Market Size, By Product, 2014�2021 (Kiloton)
Table 38 Polymer Coated Fabric Market Size, By Product, 2014�2021 (Million Square Meter)
Table 39 Polymer Coated Fabrics Market Size, By Product, 2014�2021 (USD Million)
Table 40 Polymer Coated Fabric Market Size, By Application, 2014�2021 (Kiloton)
Table 41 Polymer Coated Fabrics Market Size, By Application, 2014�2021 (Million Square Meter)
Table 42 Polymer Coated Fabric Market Size, By Application, 2014�2021 (USD Million)
Table 43 Polymer Coated Fabrics Market Size, By Region, 2014�2021 (Kiloton)
Table 44 Polymer Coated Fabric Market Size, By Region, 2014�2021 (Million Square Meter)
Table 45 Polymer Coated Fabrics Market Size, By Region, 2014�2021 (USD Million)
Table 46 Protective Fabrics Market Size, By Raw Material, 2014�2021 (USD Million)
Table 47 Protective Fabric Market Size, By Type, 2014�2021 (USD Million)
Table 48 Protective Fabrics Market Size, By End-Use Industry, 2014�2021 (USD Million)
Table 49 Protective Fabric Market Size, By Region, 2014�2021 (Kiloton)
Table 50 Fire-Resistant Fabrics Market Size, By Type, 2014�2021 (Million Sq. Meter)
Table 51 Fire-Resistant Fabric Market Size, By Application, 2014�2021 (USD Million)
Table 52 Fire-Resistant Fabrics Market Size, By Application, 2014�2021 (Million Sq. Meter)
Table 53 Fire-Resistant Fabric Market Size, By End-Use Industry, 2014�2021 (USD Million)
Table 54 Fire-Resistant Fabrics Market Size, By End-Use Industry, 2014�2021 (Million Sq. Meter)
Table 55 Fire-Resistant Fabric Market Size, By Region, 2014�2021 (USD Million)
Table 56 Fire-Resistant Fabrics Market Size, By Region, 2014�2021 (Million Sq. Meter)
Table 57 PTFE Fabric Market, By Type, 2014�2021 (Kilotons)
Table 58 PTFE Fabric Market, By End-Use Industry, 2014�2021 (Kilotons)
Table 59 PTFE Fabric Market, By End-Use Industry, 2014�2021 (USD Million)
Table 60 PTFE Fabric Market, By Region, 2014�2021 (Kilotons)
Table 61 PTFE Fabric Market, By Region, 2014�2021 (USD Million)
Table 62 Smart Textile Market, By Type, 2014�2021 (USD Million)
Table 63 Smart Textiles Market, By Function, 2014�2021 (USD Million)
Table 64 Smart Textiles Market, By End-User Industry, 2014 - 2021 (USD Million)
Table 65 Smart Textiles Market, By Region, 2014�2021 (USD Million)
Table 66 Antimicrobial Textiles Market Size, By Agents, 2014�2021 (USD Million)
Table 67 Antimicrobial Textiles Market Size, By Agents, 2014�2021 (KT)
Table 68 Antimicrobial Textiles Market Size, By Application, 2014�2021 (USD Million)
Table 69 Antimicrobial Textiles Market Size, By Application, 2014�2021 (KT)
Table 70 Antimicrobial Textiles Market Size, By Region, 2014�2021 (USD Million)
Table 71 Antimicrobial Textiles Market Size, By Region, 2014�2021 (KT)
List of Figures (53 Figures)
Figure 1 Top 10 Fabrics
Figure 2 Bottom-Up Approach
Figure 3 Top-Down Approach
Figure 4 Data Triangulation
Figure 5 Top 10 Fabrics Market Segmentation
Figure 6 Changing Consumer Preferences are the Major Drivers of the Market
Figure 7 Non-Woven Fabrics Value Chain
Figure 8 Porter�s Five Forces Analysis
Figure 9 Companies Adopted New Product Development as Their Key Growth Strategy Over the Last Five Years (2011�2015)
Figure 10 Textile Development & Distribution are an Integral Part of the Value Chain in the Technical Textiles Market
Figure 11 Porter�s Five Forces Analysis
Figure 12 Companies Adopted New Product Development and Investments as Key Growth Strategies During the Studied Period (2012-2015)
Figure 13 Overview of Factors Governing the Global Performance Fabrics Market
Figure 14 Maximum Value is Added During Manufacturing and R&D
Figure 15 Porter�s Five Forces Analysis: Performance Fabrics Market
Figure 16 Companies Primarily Adopted Organic Growth Strategies
Figure 17 Overview of the Factors Governing the Global Coated Fabrics Market
Figure 18 Value Chain Analysis of the Coated Fabrics Market
Figure 19 Coated Fabrics Manufacturing Process
Figure 20 The Figure Below Represents the Porter�s Five Forces Analysis of the Polymer Coated Fabrics Market
Figure 21 New Product Launches Was the Key Growth Strategy From 2011 to 2016
Figure 22 Overview of the Factors Governing the Global Polymer Coated Fabrics Market
Figure 23 Value Chain Analysis of the Polymer Coated Fabrics Market
Figure 24 Polymer Coated Fabrics Manufacturing Process
Figure 25 Porter�s Five Forces Analysis of the Polymer Coated Fabrics Market
Figure 26 New Product Launches Was the Key Growth Strategy From 2011 to 2016
Figure 27 Overview of the Factors Governing the Protective Fabrics Market
Figure 28 Value Chain Analysis for Protective Fabrics
Figure 29 Porter�s Five Forces Analysis
Figure 30 Companies Adopted New Product Launches as the Key Growth Strategy Between 2012 and 2016
Figure 31 Overview of Factors Governing the Fire-Resistant Fabrics Market
Figure 32 Value Chain of the Fire-Resistant Fabrics Market
Figure 33 Porter�s Five Forces Analysis
Figure 34 New Product Launches: the Most Preferred Growth Strategy Adopted By Key Players Between 2012 and 2016
Figure 35 Drivers, Restraints, Opportunities & Challenges in the PTFE Fabric Market
Figure 36 PTFE Market: Value Chain Analysis
Figure 37 Companies Adopted New Product Launches as the Key Growth Strategy, 2011�2016
Figure 38 Uptrend in Wearable Electronics Industry Fueling the Growth of Smart Textiles Market
Figure 39 Emergence of IoT and Remote Health Monitoring are the Major Trends
Figure 40 Porter�s Five Forces Analysis (2015): Smart Textiles Market
Figure 41 Companies Adopted Partnerships as the Key Growth Strategy Over the Last Four Years (2012-2015)
Figure 42 Antimicrobial Textiles Market Dynamics
Figure 43 Antimicrobial Textiles: Value-Chain Analysis
Figure 44 Companies Adopted Partnerships, Agreements & Collaborations as Their Key Growth Strategy Over the Six Years (2011�2016)
Figure 45 E. I. Du Pont De Nemours and Company: Company Snapshot
Figure 46 Koninklijke Ten Cate NV: Company Snapshot
Figure 47 Low & Bonar PLC: Company Snapshot
Figure 48 Teijin Limited: Company Snapshot
Figure 49 Saint Gobain S.A.: Company Snapshot
Figure 50 BASF SE: Company Snapshot
Figure 51 Kimberly-Clark Corporation: Company Snapshot
Figure 52 3M Company: Company Snapshot
Figure 53 Gentherm Incorporated: Company Snapshot


Growth opportunities and latent adjacency in Top 10 Fabrics Market