Hydrogen Hubs Market by Industry (Automotive, Aviation, Marine), Supply Technique (SMR, Electrolysis), End Use (Liquid Hydrogen, Hydrogen Fuel Cell) and Region- Global Forecast to 2030
Update: 11/22/2024
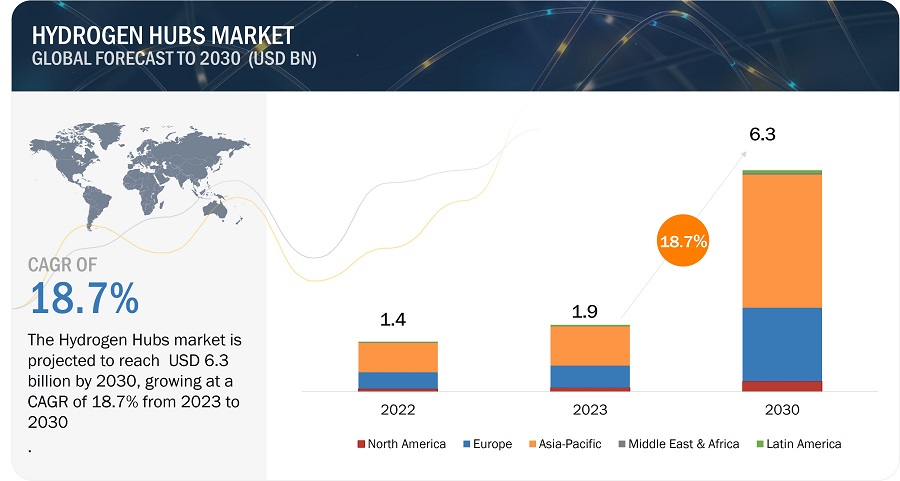
The Global Hydrogen Hubs Industry Size was valued at USD 1.9 billion in 2023 and is estimated to reach USD 6.3 billion by 2030, growing at a CAGR of 18.7% during the forecast period. The market for hydrogen hubs and on-site infrastructure is poised for a positive growth outlook in the period spanning 2023 to 2030. This optimistic trajectory is underpinned by several key factors. First and foremost, increased global emphasis on decarbonization and the transition to clean energy sources propels the demand for hydrogen as a versatile and low-carbon fuel. Government initiatives and ambitious climate targets further drive investments in hydrogen-related projects, fostering a conducive regulatory environment.
The growing focus on green and blue hydrogen production methods, coupled with advancements in technology, enhances the efficiency and competitiveness of green hydrogen hubs. As industries recognize the pivotal role of hydrogen in achieving sustainability goals, there is a surge in on-site infrastructure development, ensuring a reliable supply chain. The anticipated expansion of applications, ranging from transportation to industrial processes, reinforces the positive growth trajectory for hydrogen hubs and on-site infrastructure, marking a transformative period in the global energy landscape.
Hydrogen Hubs Market Forecast to 2030
To know about the assumptions considered for the study, Request for Free Sample Report
Hydrogen Hubs Industry Dynamics
Driver: Increasing Vertical Integration of Hydrogen Production Facilities
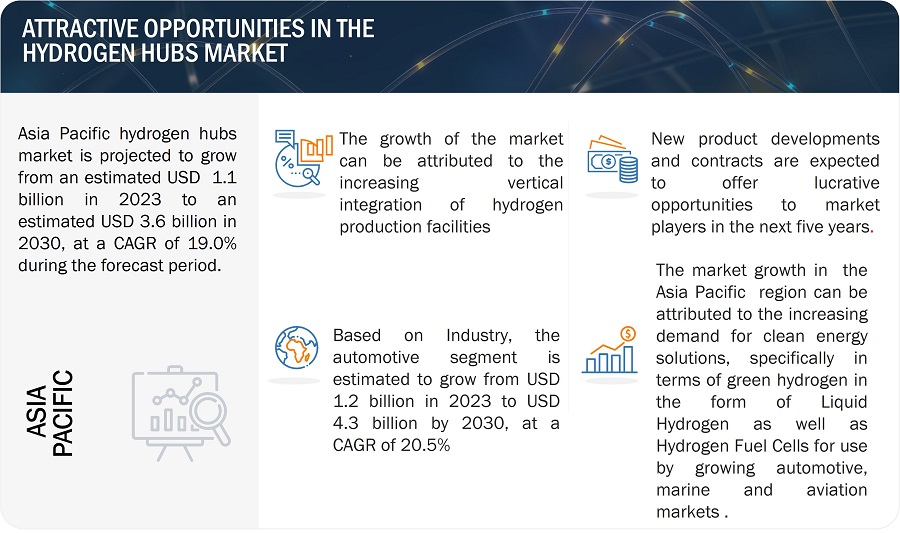
Vertical integration of on-site hydrogen production plants enables companies to own all the stages in the hydrogen production process, from the generation of renewable energy to the compression and storage of hydrogen. The strategy offers key advantages to both the end-users and suppliers such as reduced costs associated with the supply-chain, increased control over quality and improved security of supply for downstream industries such as refineries and fertilizers for whom hydrogen is a critical component in the manufacturing process. For instance, in 2022, Air Products and Chemicals Inc. (US) invested $500 million in a greenfield site in Massena, NY, for a 35 metric ton per day green liquid hydrogen facility, targeting operation by 2026-2027.The company is additionally exploring the option of establishing a hydrogen fueling station network in the U.S. northeast, potentially servicing its own hydrogen fuel cell truck fleet. This strategy showcases vertical integration, where Air Products invests across the hydrogen value chain — from production to distribution and end-use.
Restraints: Infrastructure and Production Limitations Based on site Selection
The successful development of H2Hubs is contingent on various factors related to the site selection of the hub, including access to abundant renewable energy resources such as solar and wind power, as green hydrogen production relies heavily on these. Additionally, the availability of sufficient land for essential infrastructure, water resources for electrolysis, and robust grid capacity are crucial considerations. Proximity to demand centers, geological suitability for underground storage, adherence to environmental regulations, community acceptance, and regulatory clarity further influence hub viability. Moreover, the accessibility of transportation infrastructure for hydrogen distribution plays a pivotal role. Overcoming these challenges is essential for the efficient establishment of clean hydrogen hubs, ensuring they align with environmental, economic, and societal considerations.
Opportunities: Reduction of Carbon Footprint For Downstream Industries
Hydrogen hubs, which are centralized locations for hydrogen production, storage, distribution, and utilization, are expected to play a pivotal role in accelerating the adoption of hydrogen across various industries. As such numerous industries that depend on hydrogen as a fundamental feedstock or fuel can benefit from the reduced footprint of hydrogen supplied by these hubs. In refining, hydrogen plays a crucial role in the removal of sulfur from crude oil, contributing to the production of cleaner fuels. The production of ammonia, a vital component in fertilizers, relies predominantly on hydrogen. Additionally, hydrogen is integral to steel production, where it is utilized to reduce iron ore to metallic iron. In the realm of glass manufacturing, hydrogen is employed in the production of float glass, a key component in various glass products, including windows. Furthermore, hydrogen is extensively utilized in chemical production, contributing to the synthesis of diverse chemicals such as methanol, acetic acid, and hydrochloric acid, highlighting its versatility across various industrial processes. These hydrogen-dependent industries are significant contributors to greenhouse gas emissions. Transitioning these industries to green hydrogen can significantly reduce their carbon footprint
Challenges: High Cost of Green Hydrogen production in Hubs
Green hydrogen, produced using renewable energy sources, is a promising alternative to fossil fuels for various applications, including transportation, power generation, and industrial processes. However, the processing of green hydrogen in faces several challenges that hinder its cost-effectiveness. The initial investment required for hydrogen hub infrastructure, including electrolyzers, storage facilities, and distribution networks, is substantial. This can deter potential investors and delay the widespread adoption of green hydrogen. Additionally, electrolyzers, the key component for green hydrogen production, still have limited efficiency, resulting in higher energy consumption and production costs. Advancements in electrolyzer technology are crucial for improving efficiency and reducing costs.
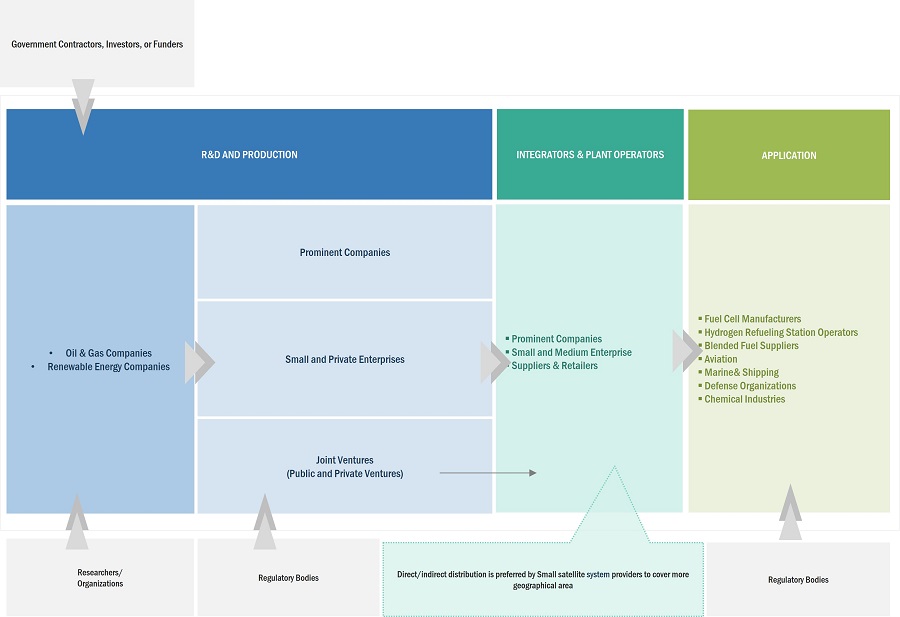
Market ecosystem map
Based on the industry, the automotive segment to lead the market for the Hydrogen hubs in 2023
Based on the industry, the hydrogen hubs market has been segmented broadly into automotive, aviation, marine and others(space, defense). The automotive segment is projected to grow from USD 1,162 million in 2023 to USD 4,299 million by 2030, at the highest CAGR of 20.5%The increasing use cases for hydrogen based mobility markets is expected to fuel this growth in the forecast period. The demand fuel cells as well as the rapid development of hydrogen hubs by Hydrogen Hubs Companies for hydrogen fuel stack supply is the reason this segment is expected to grow rapidly compared to other segments.
Based on the supply technique, the electrolysis segment is estimated to lead the hydrogen hubs marketing 2023.
Based on supply technique, the hydrogen hubs market has been segmented into steam methane reforming(SMR) and electrolysis. The electrolysis segment is projected to grow from USD 1,190 million in 2023 to USD 3,982 million by 2030, at the highest CAGR of 18.8%. electrolysis, linked to green hydrogen, utilizes renewable energy to split water into hydrogen and oxygen. While offering a cleaner alternative, electrolysis faces challenges related to high energy costs and the need for significant renewable energy infrastructure. The choice between these methods reflects the ongoing industry debate regarding trade-offs between cost efficiency and environmental impact in the pursuit of a sustainable hydrogen economy.
The Asia-Pacific market is projected to have the largest share in 2023 in the hydrogen hubs market
Hydrogen Hubs Market by Region
To know about the assumptions considered for the study, download the pdf brochure
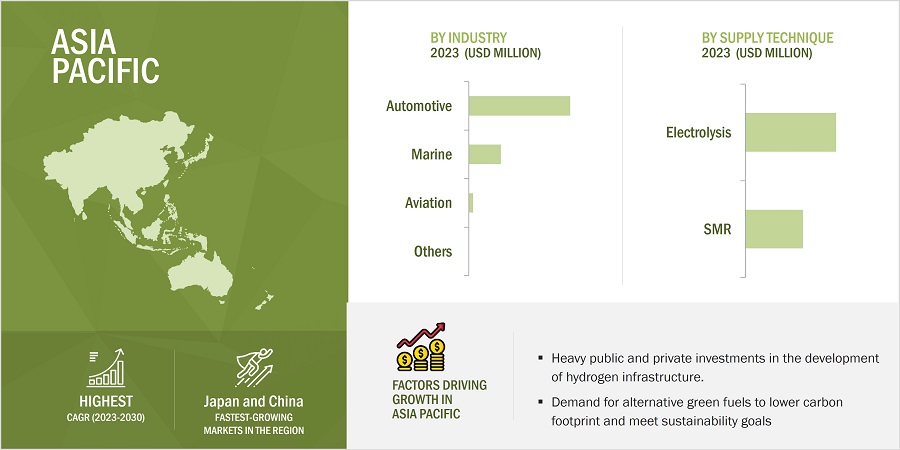
Based on region, the hydrogen hubs market has been segmented into North America, Europe, Asia Pacific, Middle East & Africa and Latin America. Asia-Pacific region seems to dominate the market in 2023. The Asia-Pacific region is experiencing significant growth in the burgeoning hydrogen hub market, primarily fueled by the heightened commitment of regional governments towards sustainable fuels and reduced carbon emissions. Governments across the Asia-Pacific are increasingly recognizing the pivotal role of hydrogen in addressing environmental concerns and achieving long-term sustainability goals. With a growing emphasis on green and blue hydrogen production methods, the region is witnessing a surge in investments and initiatives aimed at establishing comprehensive green hydrogen hubs. This strategic focus aligns with global trends towards cleaner energy sources, positioning the Asia-Pacific as a key player in the emerging hydrogen economy. The region's concerted efforts underscore a proactive approach towards fostering innovation and advancing the transition to a more sustainable and low-carbon energy landscape.
Key Market Players
The Hydrogen hubs companies are dominated by a few globally established players such as ARAMCO(Saudi Arabia), Shell plc. (UK), Linde plc. (UK),Airbus (Netherlands) and Sinopec(China), among others, are the key manufacturers that secured hydrogen hub contracts in the last few years.
Scope of the Report
|
Report Metric |
Details |
| Estimated Value | USD 1.9 Billion in 2023 |
| Projected Value | USD 6.3 Billion by 2030 |
| Growth Rate | CAGR of 18.7 % |
|
Market size available for years |
2021–2030 |
|
Base year considered |
2022 |
|
Forecast period |
2023-2030 |
|
Forecast units |
Value (USD Million/Billion) |
|
Segments Covered |
By Industry, Supply Technique, End-Use and region |
|
Geographies covered |
North America, Europe, Asia Pacific, Middle East& Africa and Latin America |
|
Companies covered |
ARAMCO(Saudi Arabia), Shell plc. (UK), Linde plc. (UK), Airbus (Netherlands) and Sinopec(China) are some of the major players in the hydrogen hubs market. (27 Companies) |
Hydrogen Hubs Market Highlights
The study categorizes the hydrogen hubs market based on offering, platform, application, frequency, and region.
|
Aspect |
Details |
|
By Industry |
|
|
By Supply Technique |
|
|
By End -Use |
|
|
By Region |
|
Recent Developments
- In April 2023, Linde entered a long-term agreement to provide green hydrogen to Evonik, a prominent specialty chemicals company. The plant aims to produce green hydrogen for Evonik's methionine production, a crucial component in animal feed, supporting Evonik's expansion plans and contributing to greenhouse gas emissions reduction in Singapore. Beyond servicing Evonik, Linde will also cater to the growing local demand for green hydrogen through the Jurong Island electrolyzer plant, expected to be operational in 2024 and becoming the largest electrolyzer installation in Singapore, revealed the inauguration of its production facilities in Bruchsal
- In July 2022, Shell Nederland B.V. and Shell Overseas Investments B.V., subsidiaries of Shell plc, made the investment decisions to construct Holland Hydrogen I, Europe's largest renewable hydrogen plant by 2025. The hydrogen produced will be utilized in the Shell Energy and Chemicals Park Rotterdam, replacing grey hydrogen in the refinery and contributing to the partial decarbonization of energy product production. This includes petrol, diesel, and jet fuel. Additionally, the renewable hydrogen can be directed towards decarbonizing commercial road transport as heavy-duty trucks and refueling networks expand.
Frequently Asked Questions (FAQs) Addressed by the Report:
Which are the major companies in the hydrogen hubs market? What are their major strategies to strengthen their market presence?
Some of the key players in the hydrogen hubs market are ARAMCO(Saudi Arabia), Shell plc. (UK), Linde plc. (UK),Airbus (Netherlands) and Sinopec(China), among others, are the key manufacturers that secured hydrogen hub contracts in the last few years. Contracts were the key strategies these companies adopted to strengthen their hydrogen hubs market presence.
What are the drivers and opportunities for the hydrogen hubs market?
The hydrogen hubs market experiences robust growing demand with drivers such as the rapidly increasing demand for hydrogen infrastructure, development of hydrogen fueling station facilities, and adoption of hydrogen hubs as a hydrogen strategy by key nations.
Which region is expected to grow most in the next five years?
The market in Asia Pacific is projected to grow at the highest CAGR from 2023 to 2030, showcasing strong demand for hydrogen hubs in the region. One key factor driving the APAC market is the increasing need to reduce carbon emissions and increase the adoption of green fuels in the region by all major industries.
What challenges does the hydrogen hub market face?
Challenges include high cost of green hydrogen and maturation of fuel cell technologies. These factors can impact the widespread adoption of hydrogen hubs.
What are the key technology trends prevailing in the hydrogen hubs market?
The emerging hydrogen hub market is witnessing transformative technological trends that are shaping its landscape. Advanced electrolysis technologies, such as high-temperature and solid oxide electrolysis, are bolstering the efficiency and cost-effectiveness of green hydrogen production, positioning electrolysis as a more competitive and sustainable method. The increasing demand for blue hydrogen is driving the integration of crucial carbon capture and storage (CCS) technologies, with ongoing developments enhancing methods to capture and store carbon emissions from hydrogen production. A notable shift towards decentralized hydrogen production, often coupled with renewable energy sources, is optimizing efficiency by offering localized solutions and reducing the reliance on extensive infrastructure and transportation. Additionally, advancements in hydrogen storage technologies, encompassing liquid and solid-state storage, are addressing transportation and storage challenges, rendering hydrogen a more accessible and secure option for diverse applications. These trends collectively underscore the dynamic evolution of the hydrogen hub market towards enhanced sustainability and efficiency.
What is the future outlook for hydrogen hubs?
The future of hydrogen hubs looks promising, with ongoing advancements in technology and regulatory frameworks, improved fuel cell technology and maturation of electrolyzers for scale production, and expanded use cases are expected to drive the growth of this market.
To speak to our analyst for a discussion on the above findings, click Speak to Analyst


- 5.1 INTRODUCTION
-
5.2 MARKET DYNAMICSDRIVERS- Increasing vertical integration of hydrogen production facilities- Rising public and private investments in hydrogen and associated fuel cell technologies- Growing development of regional green hydrogen hubsRESTRAINTS- Infrastructure and production limitationsOPPORTUNITIES- Industrial transition toward green hydrogen- Widespread adoption of hydrogen-based mobilityCHALLENGES- High production cost and complex storage and transportation- Low power density of hydrogen fuel cell stacks
- 5.3 RECESSION IMPACT ANALYSIS
- 5.4 INDICATIVE PRICING ANALYSIS
-
5.5 VALUE CHAIN ANALYSISR&DINFRASTRUCTURE DEVELOPMENTOPERATIONSPOST-PRODUCTION SERVICES
-
5.6 TRENDS/DISRUPTIONS IMPACTING CUSTOMER BUSINESS
-
5.7 ECOSYSTEM ANALYSISPROMINENT COMPANIESPRIVATE AND SMALL ENTERPRISESEND USERS
-
5.8 TECHNOLOGY ANALYSISELECTROLYSISHYDROGEN STORAGE TECHNOLOGIESCARBON CAPTURE, UTILIZATION, AND STORAGE
- 5.9 TECHNOLOGICAL ROADMAP
-
5.10 ANALYSIS OF NEW BUSINESS MODELSAUTOMOTIVE INDUSTRY: FUEL CELL STACKS AND HYDROGEN REFUELING STATIONSAVIATION INDUSTRY: HYDROGEN FUEL AND FUEL CELL-POWERED AIRCRAFT
-
5.11 PORTER’S FIVE FORCES ANALYSISTHREAT OF NEW ENTRANTSTHREAT OF SUBSTITUTESBARGAINING POWER OF SUPPLIERSBARGAINING POWER OF BUYERSINTENSITY OF COMPETITIVE RIVALRY
-
5.12 KEY STAKEHOLDERS AND BUYING CRITERIAKEY STAKEHOLDERS IN BUYING PROCESSBUYING CRITERIA
- 5.13 KEY CONFERENCES AND EVENTS, 2023–2024
-
5.14 USE CASE ANALYSISHAMBURG GREEN HYDROGEN HUBIMPROVED HYDROGEN MOBILITY
- 6.1 INTRODUCTION
-
6.2 TECHNOLOGY TRENDSHYDROGEN STORAGEAMMONIA CRACKING
-
6.3 IMPACT OF MEGATRENDSELECTROLYSISARTIFICIAL INTELLIGENCEDECARBONIZATION OF SUPPLY CHAIN AND INFRASTRUCTURE
- 6.4 SUPPLY CHAIN ANALYSIS
-
6.5 INNOVATIONS AND PATENT ANALYSISTYPES OF HYDROGEN PRODUCED AT HUB FACILITY- Green hydrogen- Blue hydrogenON-SITE INFRASTRUCTURE FOR HYDROGEN HUBS- On-site hydrogen production- On-site hydrogen storage- On-site hydrogen distribution network- Hydrogen conversion equipmentPRIMARY ENERGY SOURCE FOR HYDROGEN HUBS- Renewables- Natural gas- Others
- 7.1 INTRODUCTION
-
7.2 AUTOMOTIVERISING ADOPTION OF FUEL CELL ELECTRIC VEHICLES TO DRIVE MARKET
-
7.3 MARINEACCESS TO PORT-BASED HYDROGEN SUPPLY FROM COASTAL HUBS TO DRIVE MARKET
-
7.4 AVIATIONSEAMLESS INTEGRATION OF HYDROGEN IN EXISTING AIRPORT INFRASTRUCTURE TO DRIVE MARKET
-
7.5 OTHER INDUSTRIESDEFENSESPACE
- 8.1 INTRODUCTION
-
8.2 HYDROGEN FUEL CELLSURGENT NEED FOR CLEAN ENERGY SOLUTIONS TO DRIVE MARKET
-
8.3 LIQUID HYDROGENCOST-EFFECTIVE PRODUCTION PROCESS TO DRIVE MARKET
- 9.1 INTRODUCTION
-
9.2 STEAM METHANE REFORMINGSUSTAINABLE PRODUCTION AND STRATEGIC DISTRIBUTION TO DRIVE MARKET
-
9.3 ELECTROLYSISGLOBAL FOCUS ON GREEN HYDROGEN TO DRIVE MARKET
- 10.1 INTRODUCTION
- 10.2 REGIONAL RECESSION IMPACT ANALYSIS
-
10.3 NORTH AMERICANORTH AMERICA: PESTLE ANALYSISNORTH AMERICA: RECESSION IMPACT ANALYSISUS- Regional Clean Hydrogen Hubs program to drive marketCANADA- Abundant renewable energy resources and government funding to drive market
-
10.4 EUROPEEUROPE: PESTLE ANALYSISEUROPE: RECESSION IMPACT ANALYSISUK- Investments in hydrogen-based fuel to drive marketGERMANY- Decarbonization strategy to drive marketREST OF EUROPE
-
10.5 ASIA PACIFICASIA PACIFIC: PESTLE ANALYSISASIA PACIFIC: RECESSION IMPACT ANALYSISCHINA- National Hydrogen Energy Standardization Roadmap to drive marketJAPAN- Industrial decarbonization to drive marketREST OF ASIA PACIFIC
-
10.6 MIDDLE EAST & AFRICAMIDDLE EAST & AFRICA: PESTLE ANALYSISMIDDLE EAST & AFRICA: RECESSION IMPACT ANALYSISSAUDI ARABIA- Hydrogen Hub Strategy to drive marketUAE- Growing production of blue and green hydrogen to drive marketREST OF MIDDLE EAST & AFRICA
-
10.7 LATIN AMERICALATIN AMERICA: PESTLE ANALYSISLATIN AMERICA: RECESSION IMPACT ANALYSISCHILE- Large-scale hydrogen production to drive marketARGENTINA- National Hydrogen Strategy to drive marketREST OF LATIN AMERICA

- 11.1 INTRODUCTION
- 11.2 MARKET RANKING ANALYSIS
-
11.3 COMPANY EVALUATION MATRIXSTARSEMERGING LEADERSPERVASIVE PLAYERSPARTICIPANTS
- 11.4 COMPANY FOOTPRINT
-
11.5 COMPETITIVE SCENARIOPRODUCT LAUNCHESDEALS
- 12.1 INTRODUCTION
-
12.2 KEY PLAYERSLINDE PLC- Business overview- Products/Solutions/Services offered- Recent developments- MnM viewSAUDI ARABIAN OIL GROUP (ARAMCO)- Business overview- Products/Solutions/Services offered- Recent developments- MnM viewSHELL PLC- Business overview- Products/Solutions/Services offered- Recent developments- MnM viewSINOPEC CORP.- Business overview- Products/Solutions/Services offered- Recent developments- MnM viewAIRBUS SE- Business overview- Products/Solutions/Services offered- Recent developments- MnM viewAIR LIQUIDE SA- Business overview- Products/Solutions/Services offered- Recent developmentsAIR PRODUCTS AND CHEMICALS INC.- Business overview- Products/Solutions/Services offered- Recent developmentsCHEVRON CORPORATION- Business overview- Products/Solutions/Services offered- Recent developmentsIWATANI CORPORATION- Business overview- Products/Solutions/Services offered- Recent developmentsMESSERS GMBH- Business overview- Products/Solutions/Services offered- Recent developmentsBGR ENERGY SYSTEMS LTD.- Business overview- Products/Solutions/Services offered- Recent developmentsUNIPER SE- Business overview- Products/Services/Solutions offered- Recent developmentsGREENSTAT- Business overview- Products/Solutions/Services offered- Recent developmentsFUELCELL ENERGY, INC.- Business overview- Products/Solutions/Services offered- Recent developmentsCUMMINS INC.- Business overview- Products/Solutions/Services offered- Recent developmentsBLOOM ENERGY GROUP- Business overview- Products/Solutions/Services offered- Recent developmentsPLUG POWER INC.- Business overview- Products/Solutions/Services offered- Recent developmentsELEMENT 1 CORP.- Business overview- Products/Solutions/Services offered- Recent developmentsNEL HYDROGEN- Business overview- Products/Solutions/Services offered- Recent developmentsAW ENERGY- Business overview- Products/Solutions/Services offered- Recent developmentsNPROXX- Business overview- Products/Solutions/Services offered- Recent developmentsGARDNER CRYOGENICS- Business overview- Products/Solutions/Services offeredCALVERA HYDROGEN SA- Business overview- Products/Solutions/Services offered- Recent developmentsHEXAGON COMPOSITES- Business overview- Products/Solutions/Services offered- Recent developments
- 13.1 DISCUSSION GUIDE
- 13.2 KNOWLEDGESTORE: MARKETSANDMARKETS’ SUBSCRIPTION PORTAL
- 13.3 CUSTOMIZATION OPTIONS
- 13.4 RELATED REPORTS
- 13.5 AUTHOR DETAILS
- TABLE 1 INCLUSIONS AND EXCLUSIONS
- TABLE 2 USD EXCHANGE RATES
- TABLE 3 ROLE OF PLAYERS IN ECOSYSTEM
- TABLE 4 IMPACT OF PORTER’S FIVE FORCES
- TABLE 5 INFLUENCE OF STAKEHOLDERS ON BUYING PROCESS, BY INDUSTRY (%)
- TABLE 6 KEY BUYING CRITERIA, BY SUPPLY TECHNIQUE
- TABLE 7 KEY CONFERENCES AND EVENTS, 2023–2024
- TABLE 8 LIST OF PATENTS FOR HYDROGEN HUBS MARKET, 2019–2023
- TABLE 9 HYDROGEN HUBS MARKET, BY INDUSTRY, 2021–2022 (USD MILLION)
- TABLE 10 HYDROGEN HUBS MARKET, BY INDUSTRY, 2023–2030 (USD MILLION)
- TABLE 11 HYDROGEN HUBS MARKET, BY SUPPLY TECHNIQUE, 2021–2022 (USD MILLION)
- TABLE 12 HYDROGEN HUBS MARKET, BY SUPPLY TECHNIQUE, 2023–2030 (USD MILLION)
- TABLE 13 HYDROGEN HUBS MARKET, BY REGION, 2021–2022 (USD MILLION)
- TABLE 14 HYDROGEN HUBS MARKET, BY REGION, 2023–2030 (USD MILLION)
- TABLE 15 NORTH AMERICA: HYDROGEN HUBS MARKET, BY INDUSTRY, 2021–2022 (USD MILLION)
- TABLE 16 NORTH AMERICA: HYDROGEN HUBS MARKET, BY INDUSTRY, 2023–2030 (USD MILLION)
- TABLE 17 NORTH AMERICA: HYDROGEN HUBS MARKET, BY SUPPLY TECHNIQUE, 2021–2022 (USD MILLION)
- TABLE 18 NORTH AMERICA: HYDROGEN HUBS MARKET, BY SUPPLY TECHNIQUE, 2023–2030 (USD MILLION)
- TABLE 19 EUROPE: HYDROGEN HUBS MARKET, BY INDUSTRY, 2021–2022 (USD MILLION)
- TABLE 20 EUROPE: HYDROGEN HUBS MARKET, BY INDUSTRY, 2023–2030 (USD MILLION)
- TABLE 21 EUROPE: HYDROGEN HUBS MARKET, BY SUPPLY TECHNIQUE, 2021–2022 (USD MILLION)
- TABLE 22 EUROPE: HYDROGEN HUBS MARKET, BY SUPPLY TECHNIQUE, 2023–2030 (USD MILLION)
- TABLE 23 ASIA PACIFIC: HYDROGEN HUBS MARKET, BY INDUSTRY, 2021–2022 (USD MILLION)
- TABLE 24 ASIA PACIFIC: HYDROGEN HUBS MARKET, BY INDUSTRY, 2023–2030 (USD MILLION)
- TABLE 25 ASIA PACIFIC: HYDROGEN HUBS MARKET, BY SUPPLY TECHNIQUE, 2021–2022 (USD MILLION)
- TABLE 26 ASIA PACIFIC: HYDROGEN HUBS MARKET, BY SUPPLY TECHNIQUE, 2023–2030 (USD MILLION)
- TABLE 27 MIDDLE EAST & AFRICA: HYDROGEN HUBS MARKET, BY INDUSTRY, 2021–2022 (USD MILLION)
- TABLE 28 MIDDLE EAST & AFRICA: HYDROGEN HUBS MARKET, BY INDUSTRY, 2023–2030 (USD MILLION)
- TABLE 29 MIDDLE EAST & AFRICA: HYDROGEN HUBS MARKET, BY SUPPLY TECHNIQUE, 2021–2022 (USD MILLION)
- TABLE 30 MIDDLE EAST & AFRICA: HYDROGEN HUBS MARKET, BY SUPPLY TECHNIQUE, 2023–2030 (USD MILLION)
- TABLE 31 LATIN AMERICA: HYDROGEN HUBS MARKET, BY INDUSTRY, 2021–2022 (USD MILLION)
- TABLE 32 LATIN AMERICA: HYDROGEN HUBS MARKET, BY INDUSTRY, 2023–2030 (USD MILLION)
- TABLE 33 LATIN AMERICA: HYDROGEN HUBS MARKET, BY SUPPLY TECHNIQUE, 2021–2022 (USD MILLION)
- TABLE 34 LATIN AMERICA: HYDROGEN HUBS MARKET, BY SUPPLY TECHNIQUE, 2023–2030 (USD MILLION)
- TABLE 35 COMPANY PRODUCT FOOTPRINT
- TABLE 36 COMPANY FOOTPRINT, BY END USE
- TABLE 37 COMPANY FOOTPRINT, BY REGION
- TABLE 38 HYDROGEN HUBS MARKET: PRODUCT LAUNCHES, AUGUST 2020–SEPTEMBER 2023
- TABLE 39 HYDROGEN HUBS MARKET: DEALS, JANUARY 2020–NOVEMBER 2023
- TABLE 40 HYDROGEN HUBS MARKET: EXPANSIONS, FEBRUARY 2023-NOVEMBER 2023
- TABLE 41 LINDE PLC: COMPANY OVERVIEW
- TABLE 42 LINDE PLC: PRODUCTS/SOLUTIONS/SERVICES OFFERED
- TABLE 43 LINDE PLC: DEALS
- TABLE 44 SAUDI ARABIAN OIL GROUP (ARAMCO): COMPANY OVERVIEW
- TABLE 45 SAUDI ARABIAN OIL GROUP (ARAMCO): PRODUCTS/SOLUTIONS/SERVICES OFFERED
- TABLE 46 SAUDI ARABIAN OIL GROUP (ARAMCO): DEALS
- TABLE 47 SHELL PLC: COMPANY OVERVIEW
- TABLE 48 SHELL PLC: PRODUCTS/SOLUTIONS/SERVICES OFFERED
- TABLE 49 SHELL PLC: PRODUCT LAUNCHES
- TABLE 50 SHELL PLC: DEALS
- TABLE 51 SINOPEC CORP.: COMPANY OVERVIEW
- TABLE 52 SINOPEC CORP.: PRODUCTS/SOLUTIONS/SERVICES OFFERED
- TABLE 53 SINOPEC CORP.: PRODUCT LAUNCHES
- TABLE 54 AIRBUS SE: COMPANY OVERVIEW
- TABLE 55 AIRBUS SE: PRODUCTS/SOLUTIONS/SERVICES OFFERED
- TABLE 56 AIRBUS SE: DEALS
- TABLE 57 AIR LIQUIDE SA: COMPANY OVERVIEW
- TABLE 58 AIR LIQUIDE SA: PRODUCT/SOLUTIONS/SERVICES OFFERED
- TABLE 59 AIR LIQUIDE SA: PRODUCT LAUNCHES
- TABLE 60 AIR LIQUIDE SA: DEALS
- TABLE 61 AIR PRODUCTS AND CHEMICALS INC.: COMPANY OVERVIEW
- TABLE 62 AIR PRODUCTS AND CHEMICALS INC.: PRODUCTS/SOLUTIONS/SERVICES OFFERED
- TABLE 63 AIR PRODUCTS AND CHEMICALS INC.: DEALS
- TABLE 64 CHEVRON CORPORATION: COMPANY OVERVIEW
- TABLE 65 CHEVRON CORPORATION: PRODUCTS/SOLUTIONS/SERVICES OFFERED
- TABLE 66 CHEVRON CORPORATION: DEALS
- TABLE 67 IWATANI CORPORATION: COMPANY OVERVIEW
- TABLE 68 IWATANI CORPORATION: PRODUCTS/SOLUTIONS/SERVICES OFFERED
- TABLE 69 IWATANI CORPORATION: DEALS
- TABLE 70 MESSERS GMBH: COMPANY OVERVIEW
- TABLE 71 MESSERS GMBH: PRODUCTS/SOLUTIONS/SERVICES OFFERED
- TABLE 72 MESSERS GMBH: DEALS
- TABLE 73 BGR ENERGY SYSTEMS LTD.: COMPANY OVERVIEW
- TABLE 74 BGR ENERGY SYSTEMS LTD.: PRODUCTS/SOLUTIONS/SERVICES OFFERED
- TABLE 75 BGR ENERGY SYSTEMS LTD.: DEALS
- TABLE 76 UNIPER SE: COMPANY OVERVIEW
- TABLE 77 UNIPER SE: PRODUCTS/SOLUTIONS/SERVICES OFFERED
- TABLE 78 UNIPER SE: DEALS
- TABLE 79 GREENSTAT: COMPANY OVERVIEW
- TABLE 80 GREENSTAT: PRODUCTS/SOLUTIONS/SERVICES OFFERED
- TABLE 81 GREENSTAT: DEALS
- TABLE 82 FUELCELL ENERGY, INC.: COMPANY OVERVIEW
- TABLE 83 FUELCELL ENERGY, INC.: PRODUCTS/SOLUTIONS/SERVICES OFFERED
- TABLE 84 FUELCELL ENERGY, INC.: PRODUCT LAUNCHES
- TABLE 85 FUELCELL ENERGY, INC.: DEALS
- TABLE 86 CUMMINS INC.: COMPANY OVERVIEW
- TABLE 87 CUMMINS INC.: PRODUCTS/SOLUTIONS/SERVICES OFFERED
- TABLE 88 CUMMINS INC.: PRODUCT LAUNCHES
- TABLE 89 CUMMINS INC.: DEALS
- TABLE 90 BLOOM ENERGY GROUP: COMPANY OVERVIEW
- TABLE 91 BLOOM ENERGY GROUP: PRODUCTS/SOLUTIONS/SERVICES OFFERED
- TABLE 92 BLOOM ENERGY GROUP: PRODUCT LAUNCHES
- TABLE 93 BLOOM ENERGY GROUP: DEALS
- TABLE 94 PLUG POWER INC.: COMPANY OVERVIEW
- TABLE 95 PLUG POWER INC.: PRODUCTS/SOLUTIONS/SERVICES OFFERED
- TABLE 96 PLUG POWER INC.: DEALS
- TABLE 97 ELEMENT 1 CORP.: COMPANY OVERVIEW
- TABLE 98 ELEMENT 1 CORP.: PRODUCTS/SOLUTIONS/SERVICES OFFERED
- TABLE 99 ELEMENT 1 CORP.: PRODUCT LAUNCHES
- TABLE 100 ELEMENT 1 CORP.: DEALS
- TABLE 101 NEL HYDROGEN: COMPANY OVERVIEW
- TABLE 102 NEL HYDROGEN: PRODUCTS/SOLUTIONS/SERVICES OFFERED
- TABLE 103 NEL HYDROGEN: DEALS
- TABLE 104 AW ENERGY: COMPANY OVERVIEW
- TABLE 105 AW ENERGY: PRODUCTS/SOLUTIONS/SERVICES OFFERED
- TABLE 106 AW ENERGY: DEALS
- TABLE 107 AW ENERGY: OTHERS
- TABLE 108 NPROXX: COMPANY OVERVIEW
- TABLE 109 NPROXX: PRODUCTS/SOLUTIONS/SERVICES OFFERED
- TABLE 110 NPROXX: DEALS
- TABLE 111 GARDNER CRYOGENICS: COMPANY OVERVIEW
- TABLE 112 GARDNER CRYOGENICS: PRODUCTS/SOLUTIONS/SERVICES OFFERED
- TABLE 113 CALVERA HYDROGEN SA: COMPANY OVERVIEW
- TABLE 114 CALVERA HYDROGEN SA: PRODUCTS/SOLUTIONS/SERVICES OFFERED
- TABLE 115 CALVERA HYDROGEN SA: PRODUCT LAUNCHES
- TABLE 116 CALVERA HYDROGEN SA: DEALS
- TABLE 117 HEXAGON COMPOSITES: COMPANY OVERVIEW
- TABLE 118 HEXAGON COMPOSITES: PRODUCTS/SOLUTIONS/SERVICES OFFERED
- TABLE 119 HEXAGON COMPOSITES: DEALS
- FIGURE 1 HYDROGEN HUBS MARKET SEGMENTATION
- FIGURE 2 REPORT PROCESS FLOW
- FIGURE 3 RESEARCH DESIGN
- FIGURE 4 BREAKDOWN OF PRIMARY INTERVIEWS: BY COMPANY TYPE, DESIGNATION, AND REGION
- FIGURE 5 BOTTOM-UP APPROACH
- FIGURE 6 TOP-DOWN APPROACH
- FIGURE 7 DATA TRIANGULATION
- FIGURE 8 ELECTROLYSIS SEGMENT TO HOLD LARGEST MARKET SHARE DURING FORECAST PERIOD
- FIGURE 9 AUTOMOTIVE TO BE FASTEST-GROWING SEGMENT DURING FORECAST PERIOD
- FIGURE 10 ASIA PACIFIC TO REGISTER HIGHEST CAGR DURING FORECAST PERIOD
- FIGURE 11 INCREASED FOCUS ON GREEN AND CLEAN ENERGY SOLUTIONS TO DRIVE MARKET
- FIGURE 12 ELECTROLYSIS SEGMENT DOMINATED MARKET IN 2023
- FIGURE 13 AUTOMOTIVE INDUSTRY TO LEAD MARKET DURING FORECAST PERIOD
- FIGURE 14 HYDROGEN HUBS MARKET: DRIVERS, RESTRAINTS, OPPORTUNITIES, AND CHALLENGES
- FIGURE 15 NUMBER OF ACTIVE HYDROGEN FUELING STATIONS, BY TOP 10 COUNTRIES
- FIGURE 16 NUMBER OF HYDROGEN-ENABLED MARINE PORTS COMMISSIONED AS OF 2023, BY REGION
- FIGURE 17 NUMBER OF HYDROGEN-ENABLED AIRPORTS COMMISSIONED AS OF 2023, BY REGION
- FIGURE 18 VALUE CHAIN ANALYSIS
- FIGURE 19 REVENUE SHIFT AND NEW REVENUE POCKETS FOR PLAYERS IN HYDROGEN HUBS MARKET
- FIGURE 20 ECOSYSTEM MAPPING
- FIGURE 21 HUB OPERATORS AND DEVELOPERS
- FIGURE 22 SOLUTION PROVIDERS
- FIGURE 23 EVOLUTION OF HYDROGEN HUBS MARKET: A ROADMAP FROM 2000 TO 2030
- FIGURE 24 NEW BUSINESS MODELS FOR AUTOMOTIVE INDUSTRY BASED ON HYDROGEN HUBS
- FIGURE 25 NEW BUSINESS MODELS FOR AVIATION INDUSTRY BASED ON HYDROGEN HUBS
- FIGURE 26 INFLUENCE OF STAKEHOLDERS ON BUYING PROCESS, BY INDUSTRY
- FIGURE 27 KEY BUYING CRITERIA, BY SUPPLY TECHNIQUE
- FIGURE 28 SUPPLY CHAIN ANALYSIS
- FIGURE 29 LIST OF MAJOR PATENTS RELATED TO HYDROGEN HUBS MARKET
- FIGURE 30 PRODUCTION AND STORAGE OF GREEN AND BLUE HYDROGEN
- FIGURE 31 VERTICALLY INTEGRATED HYDROGEN HUB FACILITIES
- FIGURE 32 HYDROGEN HUBS MARKET, BY INDUSTRY, 2023–2030 (USD MILLION)
- FIGURE 33 HYDROGEN HUBS MARKET, BY SUPPLY TECHNIQUE, 2023–2030 (USD MILLION)
- FIGURE 34 HYDROGEN HUBS MARKET, BY REGION, 2023–2030
- FIGURE 35 NORTH AMERICA: HYDROGEN HUBS MARKET SNAPSHOT
- FIGURE 36 EUROPE: HYDROGEN HUBS MARKET SNAPSHOT
- FIGURE 37 ASIA PACIFIC: HYDROGEN HUBS MARKET SNAPSHOT
- FIGURE 38 MIDDLE EAST & AFRICA: HYDROGEN HUBS MARKET SNAPSHOT
- FIGURE 39 LATIN AMERICA: HYDROGEN HUBS MARKET SNAPSHOT
- FIGURE 40 MARKET RANKING OF TOP 5 PLAYERS, 2022
- FIGURE 41 COMPANY EVALUATION MATRIX, 2022
- FIGURE 42 LINDE PLC: COMPANY SNAPSHOT
- FIGURE 43 SAUDI ARABIAN OIL GROUP (ARAMCO): COMPANY SNAPSHOT
- FIGURE 44 SHELL PLC: COMPANY SNAPSHOT
- FIGURE 45 SINOPEC CORP.: COMPANY SNAPSHOT
- FIGURE 46 AIRBUS SE: COMPANY SNAPSHOT
- FIGURE 47 AIR LIQUIDE SA: COMPANY SNAPSHOT
- FIGURE 48 AIR PRODUCTS AND CHEMICALS INC.: COMPANY SNAPSHOT
- FIGURE 49 CHEVRON CORPORATION: COMPANY SNAPSHOT
- FIGURE 50 IWATANI CORPORATION: COMPANY SNAPSHOT
- FIGURE 51 BGR ENERGY SYSTEMS LTD.: COMPANY SNAPSHOT
- FIGURE 52 UNIPER SE: COMPANY SNAPSHOT
- FIGURE 53 FUELCELL ENERGY, INC.: COMPANY SNAPSHOT
- FIGURE 54 CUMMINS INC.: COMPANY SNAPSHOT
- FIGURE 55 BLOOM ENERGY GROUP: COMPANY SNAPSHOT
- FIGURE 56 PLUG POWER INC.: COMPANY SNAPSHOT
- FIGURE 57 NEL HYDROGEN: COMPANY SNAPSHOT
- FIGURE 58 HEXAGON COMPOSITES: COMPANY SNAPSHOT
The study involved extensive data collection, refinement and analysis to estimate the current size of the market for hydrogen hubs. This included exhaustive secondary research using various paid and open source databases to collect qualitative and quantitative information on the hydrogen hubs market, its adjacent markets as well as the parent markets. The next step was the validation of data, findings, assumptions of estimations, and sizing through primaries with industry experts across the hydrogen hub value chain. The demand analysis was carried out to arrive at the overall market size and was followed by market segmentation and data triangulation procedures to drill down on the sizes of segments and sub-segments of the hydrogen hubs market.
Secondary Research
Both paid and unpaid secondary data sources were used to determine the market positions of key players in the industry value chain such as automotive, aviation, marine among others (space, defense)- examining their product portfolios and operational segments. These companies were then ranked basis their sales performance and the strength of their product portfolios. These rankings were validated by primary sources.
The secondary data sources used for the study include financial statements, filings and annual reports of major companies that are vertically integrated in their hydrogen operations including production, conversion and storage of hydrogen. The collected data was analyzed to arrive at the overall size of the hydrogen hubs market, which is then validated via primaries.
Primary Research
Primary research with market players and participants was conducted after acquiring information on the key influencers and players in hydrogen hub market through secondary research. Several primary interviews were conducted with experts from both demand and supply sides across major regions such as North America, Europe, Asia Pacific, Middle East & Africa and Latin America. This primary data was collected in the form of questionnaires, emails and telephonic interviews.
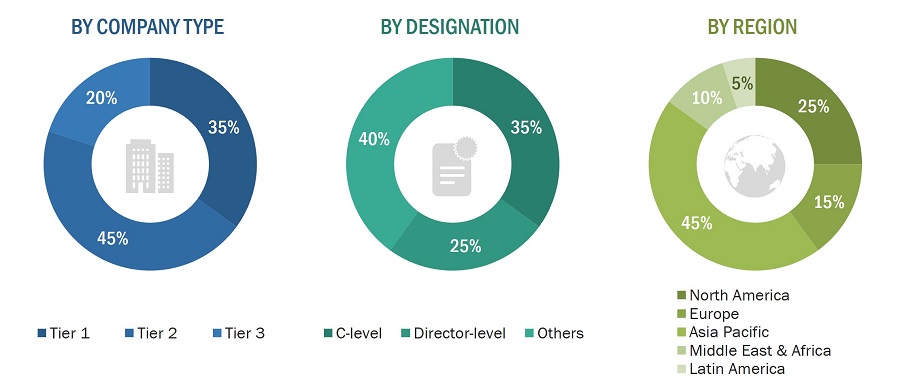
To know about the assumptions considered for the study, download the pdf brochure
Market Size Estimation
Market estimation is done using a bottom-up approach and validated by a top-down approach. Contracts and developments of on-site hydrogen infrastructure and hub based hydrogen supply contracts were mapped to determine the size of the market, based on the Industry segment. Such data sets provide information on each application's demand aspects Hy drogen hubs. For each Industry sub-segment, all possible end users in the market were identified.
Hydrogen Hubs Market Size: Bottom-up Approach

Hydrogen Hubs market Size: Top-Down Approach

Data Triangulation
After arriving at the overall size of the market, the total market was split into several segments and subsegments. The data triangulation and market breakdown procedures explained below were implemented wherever applicable, to complete the overall market engineering process and arrive at the exact statistics for various market segments and subsegments. The data was triangulated by studying various factors and trends from both, the demand and supply sides. Along with this, the market size was validated using both the top-down and bottom-up approaches.
The following figure indicates the market breakdown structure and the data triangulation procedure implemented in the market engineering process used to develop this report.
Market Definition
A hydrogen hub is an end-to-end facility for the on-site production, storage and effective utilization of hydrogen for end users across various mobility sectors such as Aviation, Marine, Automotive and Defense. The inclusions to the market will be the airports, marine ports, automotive hydrogen refueling stations that are capable of producing hydrogen on-site, storing it & make it available to the end users dependent on it such as Hydrogen powered vehicles, aircraft, ships.
Market Stakeholders
- Hydrogen Supplier
- On site hydrogen production companies
- Refineries and Chemical Companies
- Research Bodies
- Automobile Manufacturers
- Fuel Cell manufacturers
- Defense Organizations
Report Objectives
- To define, describe, segment, and forecast the size of the hydrogen hubs market based on industry, supply technique, end use and region.
- To analyze the degree of competition in the market by mapping the recent developments, products, and services of key market players
- To understand the structure of the hydrogen hubs market by identifying its various segments and subsegments
- To identify and analyze key drivers, restraints, opportunities, and challenges that influence the growth of the market.
- To provide an overview of the tariff and regulatory landscape for the adoption of hybrid boats across regions
- To forecast the size of market segments across North America, Europe, Asia Pacific, Latin America and Middle East &Africa along with major countries in each region
- To identify transportation industry trends, market trends, and technology trends currently prevailing in the market
- To analyze micromarkets1 with respect to individual technological trends and their contribution to the total market
- To analyze opportunities in the market for stakeholders by identifying key market trends
- To profile key market players and comprehensively analyze their market share and core competencies
- To provide a detailed competitive landscape of the market, along with an analysis of business and strategies such as mergers and acquisitions, partnerships, agreements, and product developments in the hydrogen hubs market
- To identify detailed financial positions, key products, and unique selling points of leading companies in the market
Available Customizations
MarketsandMarkets offers the following customizations for this market report:
- Additional country-level analysis of the Hydrogen Hubs market
- Profiling of other market players (up to 5)
Product Analysis
- Product matrix, which provides a detailed comparison of the product portfolio of each company in the Hydrogen Hubs market.




Growth opportunities and latent adjacency in Hydrogen Hubs Market