Industrial Gases-Glass Industry Market by Type (Oxygen, Hydrogen, Nitrogen, Others), Glass Type (Container, Flat, Fibre), Transportation Mode (Cylinders, Merchant Liquid, Tonnage Distribution), Function (Forming, Finishing, Atmospheric Control - Forecast to 2020


[245 Pages Report] The market for industrial gases in the glass industry is estimated to grow from USD 2.57 Billion in 2015 to reach USD 3.49 Billion by 2020, at an estimated CAGR of 6.29%. The segments considered for this report are based on type, glass type, function, transportation mode, and region. On the basis of type, hydrogen accounted for the largest market share, in terms of value, while oxygen was the most widely used industrial gas, in terms of volume, in the glass industry. The container glass segment accounted for the largest share of the market, in terms of both, volume and value, among all glass types. The transportation mode segment was dominated by the cylinder & packaged gas distribution. In terms of function, the market is segmented into forming & melting, atmospheric control, finishing & polishing, and others. The final segment, that is, region, consists of North America, Europe, Asia-Pacific, and Rest of the World (RoW). The base year considered for the study is 2014 and the market size is projected from 2015 to 2020.
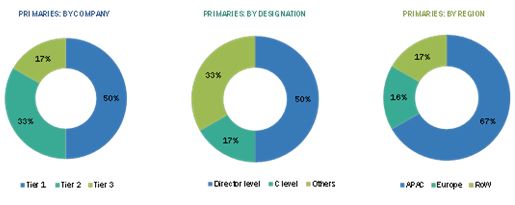
The research methodology used to estimate and forecast the market size was achieved through the top-down approach. The total market size of industrial gases was calculated. Accordingly, a certain percentage of the total market was allotted for glass manufacturing. This allotment and calculation were done on the basis of extensive primary interviews and secondary research. Primary research involved in this report includes extensive interviews with key people such as CEOs, VPs, directors, and executives. After arriving at the overall market size, the total market was split into several segments and subsegments. These data triangulation and market breakdown procedures were employed to complete the overall market engineering process and arrive at the exact statistics for all segments and subsegments. The breakdown of profiles of the primaries is depicted in the below figure:
The industrial gases in the glass industry is dominated by large players such as Air Products & Chemicals, Inc. (U.S.), The Linde Group (Germany), Praxair, Inc. (U.S.), Taiyo Nippon Sanso Corporation (Japan), and Air Liquide SA (France).
Target audience
- Glass manufacturers
- Industrial gas manufacturers
Scope of the Report
The research report segments industrial gases in the glass industry into the following submarkets:
By type:
- Hydrogen
- Oxygen
- Nitrogen
- Argon
- Acetylene
By glass type:
- Container Glass
- Flat Glass
- Glass Fiber
By function:
- Forming & Melting
- Atmospheric Control
- Finishing/Polishing
By transportation mode:
- Cylinder & Packaged Gas Distribution
- Merchant Liquid Distribution
- Tonnage Distribution
By region:
- North America
- Europe
- Asia-Pacific
- RoW
MarketsandMarkets projects that the market for industrial gases in the glass industry is to grow from USD 2.57 Billion in 2015 to USD 3.49 Billion by 2020, at a CAGR of 6.29%. The market for industrial gases in the glass industry is growing, courtesy of increasing applications of glass in the construction sector, growth in the glass packaging industry, and rising demand for energy-efficient glass production techniques. Growing demand from the automotive industry also provides an opportunity to the market to further grow, especially in the emerging Asia-Pacific and Latin American regions.
The industrial gases market in the glass industry is segmented on the basis of type, glass type, function, transportation mode, and region. On the basis of type, the hydrogen segment held the largest market share, in terms of value, while oxygen was the most widely used industrial gas, in terms of volume. The container glass segment accounted for the largest share of the market, in terms of both, volume and value, among all glass types. The transportation mode segment was dominated by the cylinder & packaged gas distribution segment. In terms of function, the market is segmented into forming & melting, atmospheric control, finishing & polishing, and others. The forming & melting function segment is projected to grow at the highest rate, during the forecast period.
On the basis of key regions, the market for industrial gases in the glass industry is segmented into North America, Europe, Asia-Pacific, and Rest of the World (RoW). The Asia-Pacific region held the largest share among all regions in 2014. This is mainly due to emerging economies in China and India, coupled with growing applications of glass in the construction and automotive industries.
Mergers & acquisitions was the major strategy adopted by most players in the market. Companies such as Air Products & Chemicals, Inc. (U.S.), The Linde Group (Germany), Praxair, Inc. (U.S.), Taiyo Nippon Sanso Corporation (Japan), Air Liquide SA (France), Gulf Cryo (Bahrain), HyGear (The Netherlands), Taiyo Nippon Sanso Corporation (Japan), SIG Gases Berhad (Malaysia), and Messer Group GmbH (Germany) were the key players who adopted this strategy to increase the reach of their offerings, improve their production capacity, and establish focus on core operations. Companies aim to serve the market efficiently by investing in manufacturing facilities and acquiring distribution centers in the fast-growing regions.
 Exclusive indicates content/data unique to MarketsandMarkets and not available with any competitors.
Table of Contents
1 Introduction (Page No. - 25)
1.1 Objectives of the Study
1.2 Market Definition
1.3 Study Scope
1.3.1 Years Considered
1.4 Currency Considered
1.5 Unit Considered
1.6 Stakeholders
2 Research Methodology (Page No. - 28)
2.1 Research Data
2.1.1 Secondary Data
2.1.1.1 Key Data From Secondary Sources
2.1.2 Primary Data
2.1.2.1 Key Data From Primary Sources
2.1.2.2 Breakdown of Primary Interviews
2.2 Factor Analysis
2.2.1 Demand-Side Analysis
2.2.1.1 Rising Population
2.2.1.2 Increasing Income and Spending Capacity
2.2.1.3 Industrialization
2.2.2 Supply-Side Analysis
2.2.2.1 Fluctuations in Fuel Prices
2.3 Market Size Estimation
2.4 Market Breakdown and Data Triangulation
2.5 Research Assumptions and Limitations
2.5.1 Assumptions
2.5.2 Limitations
3 Executive Summary (Page No. - 39)
3.1 Increasing Applications of Glass in the Construction Industry are Driving the Market for Industrial Gases in the Glass Industry
3.2 Driving Factors for the Use of Industrial Gases in the Glass Industry
3.3 Container Glass is Projected to Occupy the Largest Share Among All Glass Types, By 2020
3.4 Asia-Pacific is Projected to Dominate the Market for Industrial Gases in the Glass Industry By 2020
3.5 China is Projected to Grow at the Highest CAGR From 2015 to 2020
3.6 Leading Market Players Adopted Mergers & Acquisitions as the Key Strategies From 2011 to 2015
4 Premium Insights (Page No. - 44)
4.1 Attractive Market Opportunities in the Market for Industrial Gases in the Glass Industry
4.2 Hydrogen Segment is Projected to Account for the Largest Share Among All Industrial Gases in the Glass Industry, in Terms of Value, From 2015 to 2020
4.3 Industrial Gases in the Glass Industry in the Asia-Pacific Region
4.4 China is Projected to Grow at the Highest CAGR From 2015 to 2020
4.5 Asia-Pacific Occupied the Largest Market Share Among All Regions in 2014
4.6 Emerging Markets are Estimated to Grow at A Faster Rate Than Developed Markets
4.7 Forming & Melting Segment Accounted for the Largest Share Among Functions of Industrial Gases in the Glass Industry in 2014
4.8 Industrial Gases in the Glass Industry Life Cycle Analysis, By Region
5 Market Overview (Page No. - 52)
5.1 Introduction
5.2 Market Evolution
5.3 Market Dynamics
5.3.1 Drivers
5.3.1.1 Growth in the Glass Industry and Its End-Users
5.3.1.1.1 Increasing Application of Glass in the Construction Industry
5.3.1.1.2 Rising Glass Packaging Industry
5.3.1.2 Growing Demand for Energy-Efficient Glass Production Techniques
5.3.2 Restraints
5.3.2.1 Environmental Impacts Through Glass Production
5.3.3 Opportunities
5.3.3.1 High Demand From the Automotive Industry
5.3.4 Challenges
5.3.4.1 Intricate Manufacturing Process
6 Industry Trends (Page No. - 59)
6.1 Introduction
6.2 Value Chain
6.3 Porter�s Five Forces Analysis
6.3.1 Threat of New Entrants
6.3.2 Threat of Substitutes
6.3.3 Bargaining Power of Suppliers
6.3.4 Bargaining Power of Buyers
6.3.5 Intensity of Competitive Rivalry
6.4 Average Price Analysis
6.4.1 Industrial Gases in the Glass Industry Market, Average Price Analysis, By Region
6.4.2 Industrial Gases in the Glass Industry Market, Average Price Analysis, By Type
6.4.3 Industrial Gases in the Glass Industry Market, Average Price Analysis, By Function
6.4.4 Industrial Gases in the Glass Industry Market, Average Price Analysis, By Glasss Type
7 Industrial Gases in the Glass Industry, By Glass Type (Page No. - 66)
7.1 Introduction
7.1.1 Industrial Gases in the Glass Industry Market, By Glass Type
7.1.1.1 Container Glass Accounted for the Largest Market Share in 2014
7.2 Container Glass
7.3 Flat Glass
7.4 Fiber Glass
7.5 Others (Specialty Glass, Art & Tableware Glass)
8 Industrial Gases in the Glass Industry, By Type (Page No. - 71)
8.1 Introduction
8.1.1 Industrial Gases in the Glass Industry Market, By Type
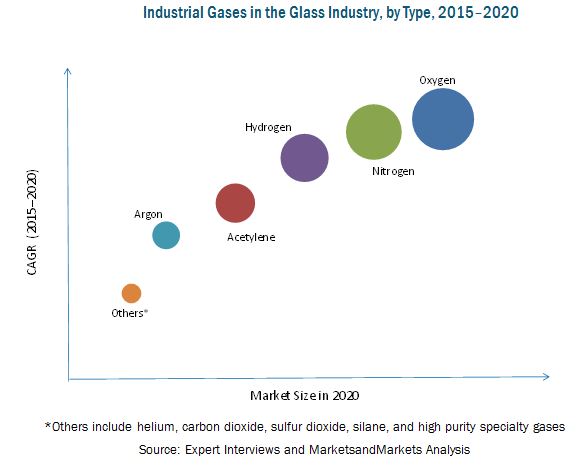
8.1.1.1 Oxygen Projected to Be the Fastest-Growing Type in Glass Manufacturing, By 2020
8.2 Oxygen
8.2.1 Oxygen in Glass Industry Market, By Transportation Mode
8.2.1.1 Cylinder & Packaged Gas Distribution Dominated the Market in 2014
8.3 Nitrogen
8.3.1 Nitrogen in Glass Industry Market Size, By Transportation Mode
8.3.1.1 Merchant Liquid Distribution Projected to Be the Fastest-Growing Transportation Mode of Nitrogen, By 2020
8.4 Hydrogen
8.4.1 Hydrogen in Glass Industry Market Size, By Transportation Mode
8.4.1.1 Cylinder & Packaged Gas Distribution Projected to Show Potential Growth Opportunities, By 2020
8.5 Acetylene
8.5.1 Acetylene in Glass Industry Market, By Transportation Mode
8.5.1.1 Merchant Liquid Distribution Projected to Have the Highest CAGR, Through 2020
8.6 Argon
8.6.1 Argon in Glass Industry Market, By Transportation Mode
8.6.1.1 Cylinder & Packaged Gas Distribution Held the Largest Market Share in 2014
8.7 Other Gases
8.7.1 Other Gases in Glass Industry Market, By Transportation Mode
8.7.1.1 Merchant Liquid Distribution Held the Second-Largest Share in 2014
9 By Transportation Mode (Page No. - 82)
9.1 Introduction
9.1.1 Industrial Gases in the Glass Industry Market Size, By Transportation Mode
9.1.1.1 Cylinder & Packaged Gas Distribution Dominated the Market, By Transportation Mode, in 2014
9.2 Cylinders & Packaged Gas
9.3 Merchant Liquid/Bulk
9.4 Tonnage Distribution
10 Industrial Gases in the Glass Industry, By Function (Page No. - 87)
10.1 Introduction
10.1.1 Industrial Gases in the Glass Industry Market, By Function
10.1.1.1 Forming & Melting Dominated the Market in 2014
10.2 Forming & Melting
10.3 Atmospheric Control
10.4 Finishing & Polishing
10.5 Others
11 Industrial Gases in the Glass Industry Market, By Region (Page No. - 91)
11.1 Introduction
11.1.1 Industrial Gases in the Glass Industry Market Size, By Region
11.1.1.1 Asia-Pacific Dominated the Market for Industrial Gases in the Glass Industry in 2014
11.1 Asia-Pacific
11.1.1 Asia-Pacific: Industrial Gases in the Glass Industry Market Size, By Country
11.1.1.1 China Dominated the Asia-Pacific Industrial Gases Market in Glass Industry in 2014
11.1.1.2 Asia-Pacific: Industrial Gases in the Glass Industry Market Size, By Type
11.1.1.2.1 Hydrogen Accounted for the Largest Market Share in 2014, By Value
11.1.1.3 Asia-Pacific: Industrial Gases in the Glass Industry Market Size, By Glass Type
11.1.1.3.1 Flat Glass to Grow at the Highest CAGR By 2020
11.1.1.4 Asia-Pacific: Industrial Gases in the Glass Industry Market Size, By Function
11.1.1.4.1 Forming & Melting to Grow at the Highest Rate By 2020
11.1.1.5 Asia-Pacific: Industrial Gases in the Glass Industry Market Size, By Transportation Mode
11.1.1.5.1 Cylinder & Packaged Gas Distribution Was the Largest Market in 2014
11.1.2 China
11.1.2.1 China: Industrial Gases in the Glass Industry Market Size, By Type
11.1.2.1.1 Growing Construction Industry is Driving the Glass Market in China
11.1.2.2 China: Industrial Gases in the Glass Industry Market Size, By Glass Type
11.1.2.2.1 Container Glass Dominated the Chinese Market
11.1.2.3 China: Industrial Gases in the Glass Industry Market Size, By Function
11.1.2.3.1 Forming & Melting Dominated the Market in China
11.1.2.4 China: Industrial Gases in the Glass Industry Market Size, By Transportation Mode
11.1.2.4.1 Merchant Liquid Distribution Projected to Grow at the Highest Rate By 2020
11.1.3 Japan
11.1.3.1 Japan: Industrial Gases in the Glass Industry Market Size, By Type
11.1.3.1.1 Oxygen to Grow at the Highest CAGR By 2020
11.1.3.2 Japan: Industrial Gases in the Glass Industry Market Size, By Glass Type
11.1.3.2.1 Flat Glass Projected to Grow at the Highest Rate By 2020
11.1.3.3 Japan: Industrial Gases in the Glass Industry Market Size, By Function
11.1.3.3.1 Function of Industrial Gases in the Glass Industry in Forming & Melting Was the Highest in 2014
11.1.3.4 Japan: Industrial Gases in the Glass Industry Market Size, By Transportation Mode
11.1.3.4.1 Cylinder & Packaged Gas Distribution Dominated the Market in 2014
11.1.4 India
11.1.4.1 India: Industrial Gases in the Glass Industry Market Size, By Type
11.1.4.1.1 Nitrogen Projected to Grow at the Highest Rate By 2020
11.1.4.2 India: Industrial Gases in the Glass Industry Market Size, By Glass Type
11.1.4.2.1 Glass Fiber Showing Potential for Growth in India
11.1.4.3 India: Industrial Gases in the Glass Industry Market Size, By Function
11.1.4.3.1 Glass Industry in India is Largely Driven By Growth in the Income of Middle-Class Population
11.1.4.4 India: Industrial Gases in the Glass Industry Market Size, By Transportation Mode
11.1.4.4.1 Cylinder & Packaged Gas Distribution Dominated the Market in 2014
11.1.5 South Korea
11.1.5.1 South Korea: Industrial Gases in the Glass Industry Market Size, By Type
11.1.5.1.1 Oxygen to Grow at the Second-Highest CAGR By 2020
11.1.5.2 South Korea: Industrial Gases in the Glass Industry Market Size, By Glass Type
11.1.5.2.1 Container Glass Accounted for the Largest Market Share in 2014
11.1.5.3 South Korea: Industrial Gases in the Glass Industry Market Size, By Function
11.1.5.3.1 Function of Industrial Gases in the Glass Industry in Forming & Melting Was the Largest in 2014
11.1.5.4 South Korea: Industrial Gases in the Glass Industry Market Size, By Transportation Mode
11.1.5.4.1 Merchant Liquid Distribution to Grow at the Highest Rate By 2020
11.1.6 Rest of Asia-Pacific
11.1.6.1 Rest of Asia-Pacific: Industrial Gases in the Glass Industry Market Size, By Type
11.1.6.1.1 Hydrogen Held the Largest Share in the Rest of Apac Industrial Gases in the Glass Industry
11.1.6.2 Rest of Asia-Pacific: Industrial Gases in the Glass Industry Market Size, By Glass Type
11.1.6.2.1 Flat Glass Was the Second-Largest Market in 2014
11.1.6.3 Rest of Asia-Pacific: Industrial Gases in the Glass Industry Market Size, By Function
11.1.6.3.1 Atmospheric Control Was the Second-Largest Function for Industrial Gases in the Glass Industry in 2014
11.1.6.4 Rest of Asia-Pacific: Industrial Gases in the Glass Industry Market Size, By Function
11.1.6.4.1 Cylinder & Packaged Gas Distribution Was the Largest Function for Industrial Gases in the Glass Industry in 2014
11.2 Europe
11.2.1 Europe: Industrial Gases in the Glass Industry Market Size, By Country
11.2.1.1 Germany Held the Largest Share in the European Industrial Gases in the Glass Industry Market
11.2.1.2 Europe: Industrial Gases in the Glass Industry Market Size, By Type
11.2.1.2.1 Oxygen to Grow at the Highest CAGR By 2020
11.2.1.3 Europe: Industrial Gases in the Glass Industry Market Size, By Glass Type
11.2.1.3.1 Growing Infrastructure Driving the Glass Industry in Europe
11.2.1.4 Europe: Industrial Gases in the Glass Industry Market Size, By Function
11.2.1.4.1 Forming & Melting Dominated the Market in Europe in 2014
11.2.1.5 Europe: Industrial Gases in the Glass Industry Market Size, By Transportation Mode
11.2.1.5.1 Merchant Liquid Distribution Dominated the Market in Europe
11.2.2 Germany
11.2.2.1 Germany: Industrial Gases in the Glass Industry Market Size, By Type
11.2.2.1.1 Hydrogen Accounted for the Largest Market Share in 2014
11.2.2.2 Germany: Industrial Gases in the Glass Industry Market Size, By Glass Type
11.2.2.2.1 Container Glass Accounted for the Largest Market Share in 2014
11.2.2.3 Germany: Industrial Gases in the Glass Industry Market Size, By Function
11.2.2.3.1 Atmospheric Control Was the Second-Largest Market in 2014 in Germany
11.2.2.4 Germany: Industrial Gases in the Glass Industry Market Size, By Transportation Mode
11.2.2.4.1 Merchant Liquid Distribution Was the Second-Largest Market in 2014 in Germany
11.2.3 U.K.
11.2.3.1 U.K.: Industrial Gases in the Glass Industry Market Size, By Type
11.2.3.1.1 Nitrogen Projected to Grow at the Second-Highest Rate
11.2.3.2 U.K.: Industrial Gases in the Glass Industry Market Size, By Glass Type
11.2.3.2.1 Glass Fiber to Grow at the Second-Highest Rate By 2020 in the U.K.
11.2.3.3 U.K.: Industrial Gases in the Glass Industry Market Size, By Function
11.2.3.3.1 Forming & Melting Dominated the U.K. Market for Industrial Gases in the Glass Industry
11.2.3.4 U.K.: Industrial Gases in the Glass Industry Market Size, By Transportation Mode
11.2.3.4.1 Merchant Liquid Distribution Showing Growth Potential in the U.K.
11.2.4 Italy
11.2.4.1 Italy: Industrial Gases in the Glass Industry Market Size, By Type
11.2.4.1.1 Increasing Number of Integrated Packaging Manufacturers is Driving the Demand for Industrial Gases in the Glass Industry in Italy
11.2.4.2 Italy: Industrial Gases in the Glass Industry Market Size, By Glass Type
11.2.4.2.1 Container Glass Dominated the Market in Italy in 2014
11.2.4.3 Italy: Industrial Gases in the Glass Industry Market Size, By Function
11.2.4.3.1 Forming & Melting Dominated the Market in 2014
11.2.4.4 Italy: Industrial Gases in the Glass Industry Market Size, By Function
11.2.4.4.1 Cylinder & Packaged Gas Distribution Dominated the Market in 2014
11.2.5 France
11.2.5.1 France: Industrial Gases in the Glass Industry Market Size, By Type
11.2.5.1.1 Oxygen Projected to Grow at the Highest Rate By 2020
11.2.5.2 France: Industrial Gases in the Glass Industry Market Size, By Glass Type
11.2.5.2.1 Growing Construction Activities Driving the Glass Industry
11.2.5.3 France: Industrial Gases in the Glass Industry Market Size, By Function
11.2.5.3.1 Forming & Melting Dominated the Market
11.2.5.4 France: Industrial Gases in the Glass Industry Market Size, By Transportation Mode
11.2.5.4.1 Cylinder & Packaged Gas Distribution Accounted for the Largest Share in Italy
11.2.6 Rest of Europe
11.2.6.1 Rest of Europe: Industrial Gases in the Glass Industry Market Size, By Type
11.2.6.1.1 Oxygen to Grow at the Highest CAGR By 2020
11.2.6.2 Rest of Europe: Industrial Gases in the Glass Industry Market Size, By Glass Type
11.2.6.2.1 Glass Fiber to Grow at the Second-Highest Rate By 2020
11.2.6.3 Rest of Europe: Industrial Gases in the Glass Industry Market Size, By Function
11.2.6.3.1 Forming & Melting Accounted for the Largest Share in 2014 and is Also Projected to Grow at the Highest CAGR By 2020
11.2.6.4 Rest of Europe: Industrial Gases in the Glass Industry Market Size, By Transportation Mode
11.2.6.4.1 Merchant Liquid Distribution Projected to Grow at the Highest CAGR By 2020
11.3 North America
11.3.1 North America: Industrial Gases in the Glass Industry Market Size, By Country
11.3.1.1 Mexico is Projected to Be the Fastest-Growing Market By 2020
11.3.1.2 North America: Industrial Gases in the Glass Industry Market Size, By Type
11.3.1.2.1 North American Market Driven By Growing Glass Packaging Industry
11.3.1.3 North America: Industrial Gases in the Glass Industry Market Size, By Glass Type
11.3.1.3.1 Flat Glass Segment to Grow at the Highest Rate By 2020
11.3.1.4 North America: Industrial Gases in the Glass Industry Market Size, By Function
11.3.1.4.1 Forming & Melting Segment Accounted for the Largest Share Owing to Its Growing Function in the Glass Industry
11.3.1.5 North America: Industrial Gases in the Glass Industry Market Size, By Transportation Mode
11.3.1.5.1 Cylinder & Packaged Gas Distribution Segment Dominated the Market in North America
11.3.2 U.S.
11.3.2.1 U.S.: Industrial Gases in the Glass Industry Market Size, By Type
11.3.2.1.1 Hydrogen Segment Dominated the Market in the U.S., in 2014
11.3.2.2 U.S.: Industrial Gases in the Glass Industry Market Size, By Glass Type
11.3.2.2.1 Container Glass Segment Accounted for the Largest Share in 2014
11.3.2.3 U.S.: Industrial Gases in the Glass Industry Market Size, By Function
11.3.2.3.1 Atmospheric Control Showing Signs of Potential Growth in the U.S.
11.3.2.4 U.S.: Industrial Gases in the Glass Industry Market Size, By Transportation Mode
11.3.2.4.1 Cylinder & Packaged Gas Distribution Segment Dominated the Market in 2014
11.3.3 Canada
11.3.3.1 Canada: Industrial Gases in the Glass Industry Market Size, By Type
11.3.3.1.1 Hydrogen Was the Largest Segment in 2014
11.3.3.2 Canada: Industrial Gases in the Glass Industry Market Size, By Glass Type
11.3.3.2.1 Flat Glass Segment to Grow at the Highest CAGR in the Canadian Market
11.3.3.3 Canada: Industrial Gases in the Glass Industry Market Size, By Function
11.3.3.3.1 Forming & Melting Function Dominated the Industrial Gases Market in 2014
11.3.3.4 Canada: Industrial Gases in the Glass Industry Market Size, By Transportation Mode
11.3.3.4.1 Merchant Liquid Distribution Segment to Grow at the Highest Rate By 2020
11.3.4 Mexico
11.3.4.1 Mexico: Industrial Gases in the Glass Industry Market Size, By Type
11.3.4.1.1 Mexican Industrial Gases in the Glass Industry Market, By Type, Was Dominated By Hydrogen Segment in 2014
11.3.4.2 Mexico: Industrial Gases in the Glass Industry Market Size, By Glass Type
11.3.4.2.1 Container Glass Segment Dominated the Market in 2014
11.3.4.3 Mexico: Industrial Gases in the Glass Industry Market Size, By Function
11.3.4.3.1 Atmospheric Control Segment to Grow at the Second-Highest Rate By 2020
11.3.4.4 Mexico: Industrial Gases in the Glass Industry Market Size, By Transportation Mode
11.3.4.4.1 Merchant Liquid Distribution Segment to Grow at the Highest Rate By 2020
11.4 Rest of the World (RoW)
11.4.1 RoW: Industrial Gases in the Glass Industry Market Size, By Country
11.4.1.1 Brazil Dominated the RoW Industrial Gases in the Glass Industry Market in 2014
11.4.1.2 RoW: Industrial Gases in the Glass Industry Market Size, By Type
11.4.1.2.1 Nitrogen Segment to Grow at the Second-Highest Rate By 2020
11.4.1.3 RoW: Industrial Gases in the Glass Industry Market Size, By Glass Type
11.4.1.3.1 Glass Fiber Segment is Projected to Have Potential Growth By 2020
11.4.1.4 RoW: Industrial Gases in the Glass Industry Market Size, By Function
11.4.1.4.1 Forming & Melting Segment Dominated the Market in 2014, in RoW
11.4.1.5 RoW: Industrial Gases in the Glass Industry Market Size, By Transportation Mode
11.4.1.5.1 Cylinder & Packaged Gas Distribution Segment Dominated the Market in 2014
11.4.2 Brazil
11.4.2.1 Brazil: Industrial Gases in the Glass Industry Market Size, By Type
11.4.2.1.1 Industrial Gases in the Glass Industry Market in Brazil Was Dominated By the Hydrogen Segment in 2014
11.4.2.2 Brazil: Industrial Gases in the Glass Industry Market Size, By Glass Type
11.4.2.2.1 Flat Glass Segment is Projected to Grow at the Highest CAGR By 2020
11.4.2.3 Brazil: Industrial Gases in the Glass Industry Market Size, By Function
11.4.2.3.1 Forming & Melting Segment Dominated the Brazilian Market for Industrial Gases in the Glass Industry in 2014
11.4.2.4 Brazil: Industrial Gases in the Glass Industry Market Size, By Function
11.4.2.4.1 Cylinder & Packaged Gas Distribution to Grow at the Second-Highest Rate By 2020
11.4.3 Argentina
11.4.3.1 Argentina: Industrial Gases in the Glass Industry Market Size, By Type
11.4.3.1.1 Oxygen Segment Projected to Grow at the Highest Rate in Argentina, By 2020
11.4.3.2 Argentina: Industrial Gases in the Glass Industry Market Size, By Glass Type
11.4.3.2.1 Flat Glass Segment is Projected to Grow at the Highest CAGR By 2020
11.4.3.3 Argentina: Industrial Gases in the Glass Industry Market Size, By Function
11.4.3.3.1 Atmospheric Control Segment Projected to Grow at the Second-Highest Rate By 2020
11.4.3.4 Argentina: Industrial Gases in the Glass Industry Market Size, By Transportation Mode
11.4.3.4.1 Cylinder & Packaged Gas Distribution Showing Potential for Growth in Argentina
11.4.4 South Africa
11.4.4.1 South Africa: Industrial Gases in the Glass Industry Market Size, By Type
11.4.4.1.1 Hydrogen Segment Dominated the Market in South Africa
11.4.4.2 South Africa: Industrial Gases in the Glass Industry Market Size, By Glass Type
11.4.4.2.1 Container Glass Dominated the Market in 2014
11.4.4.3 South Africa: Industrial Gases in the Glass Industry Market Size, By Function
11.4.4.3.1 Atmospheric Control Segment is Expected to Have Potential Growth Opportunities By 2020
11.4.4.4 South Africa: Industrial Gases in the Glass Industry Market Size, By Transportation Mode
11.4.4.4.1 Merchant Liquid Distribution Segment Projected to Grow at the Highest Rate By 2020
11.4.5 Other Countries in RoW
11.4.5.1 Other Countries in RoW: Industrial Gases in the Glass Industry Market Size, By Type
11.4.5.1.1 Oxygen Segment Projected to Grow at the Highest Rate By 2020
11.4.5.2 Other Countries in RoW: Industrial Gases in the Glass Industry Market Size, By Glass Type
11.4.5.2.1 Container Glass Segment Accounted for the Largest Market Share in 2014
11.4.5.3 Other Countries in RoW: Industrial Gases in the Glass Industry Market Size, By Function
11.4.5.3.1 Atmospheric Control Segment is Projected to Grow at the Second-Highest CAGR By 2020
11.4.5.4 Other Countries in RoW: Industrial Gases in the Glass Industry Market Size, By Transportation Mode
11.4.5.4.1 Cylinder & Packaged Gas Distribution Segment is Projected to Grow at the Second-Highest CAGR By 2020
12 Competitive Landscape (Page No. - 204)
12.1 Overview
12.2 Competitive Situations & Trends
12.3 Key Growth Strategies, 2011�2015
12.3.1 Mergers & Acquisitions
12.3.2 Investments & Expansions
12.3.3 Partnerships, Agreements & Joint Ventures
12.3.4 New Product Developments
13 Company Profiles (Page No. - 211)
13.1 Introduction
13.2 Air Products & Chemicals, Inc.
13.2.1 Business Overview
13.2.2 Products
13.2.3 Recent Developments
13.2.4 MnM View
13.2.5 SWOT Analysis
13.3 the Linde Group
13.3.1 Business Overview
13.3.2 Products Offered
13.3.3 Recent Developments
13.3.4 MnM View
13.3.5 SWOT Analysis
13.4 Praxair, Inc.
13.4.1 Business Overview
13.4.2 Products Offered
13.4.3 Recent Developments
13.4.4 MnM View
13.4.5 SWOT Analysis
13.5 Air Liquide SA
13.5.1 Business Overview
13.5.2 Products Offered
13.5.3 Recent Developments
13.5.4 MnM View
13.5.5 SWOT Analysis
13.6 Taiyo Nippon Sanso Corporation
13.6.1 Business Overview
13.6.2 Products Offered
13.6.3 Recent Developments
13.6.4 MnM View
13.6.5 SWOT Analysis
13.7 Messer Group GmbH
13.7.1 Business Overview
13.7.2 Products Offered
13.7.3 Recent Developments
13.8 Gulf Cryo
13.8.1 Business Overview
13.8.2 Products Offered
13.8.3 Recent Developments
13.9 Hygear
13.9.1 Business Overview
13.9.2 Products Offered
13.9.3 Recent Developments
13.10 SIG Gases Berhad
13.10.1 Business Overview
13.10.2 Products Offered
13.10.3 Recent Developments
13.11 Air Water, Inc.
13.11.1 Business Overview
13.11.2 Products Offered
14 Appendix (Page No. - 238)
14.1 Insights of Industry Experts
14.2 Discussion Guide
14.3 Company Developments
14.3.1 New Product Launches
14.3.2 Mergers & Acquisitions
14.3.3 Expansions
14.4 Introducing RT: Real-Time Market Intelligence
14.5 Available Customizations
14.6 Related Reports
List of Tables (204 Tables)
Table 1 Glass Packaging Production Data, By Country
Table 2 Industrial Gases in the Glass Industry Market Size, By Glass Type, 2013�2020 (USD Million)
Table 3 Industrial Gases in the Glass Industry Market Size, By Glass Type, 2013�2020 (KT)
Table 4 Industrial Gases in the Glass Industry Market Size, By Type, 2013�2020 (USD Million)
Table 5 Industrial Gases in the Glass Industry Market Size, By Type, 2013�2020 (KT)
Table 6 Oxygen in Glass Industry Market Size, By Transportation Mode, 2013�2020 (USD Million)
Table 7 Oxygen in Glass Industry Market Size, By Transportation Mode, 2013�2020 (KT)
Table 8 Nitrogen in Glass Industry Market Size, By Transportation Mode, 2013�2020 (USD Million)
Table 9 Nitrogen in Glass Industry Market Size, By Transportation Mode, 2013�2020 (KT)
Table 10 Hydrogen in Glass Industry Market Size, By Transportation Mode, 2013�2020 (USD Million)
Table 11 Hydrogen in Glass Industry Market Size, By Transportation Mode, 2013�2020 (KT)
Table 12 Acetylene in Glass Industry Market Size, By Transportation Mode, 2013�2020 (USD Million)
Table 13 Acetylene in Glass Industry Market Size, By Transportation Mode, 2013�2020 (KT)
Table 14 Argon in Glass Industry Market Size, By Transportation Mode, 2013�2020 (USD Million)
Table 15 Argon in Glass Industry Market Size, By Transportation Mode, 2013�2020 (KT)
Table 16 Other Gases in Glass Industry Market Size, By Transportation Mode, 2013�2020 (USD Million)
Table 17 Other Gases in Glass Industry Market Size, By Transportation Mode, 2013�2020 (KT)
Table 18 Gases in Glass Industry Market Size, By Transportation Mode, 2013�2020 (USD Million)
Table 19 Gases in Glass Industry Market Size, By Transportation Mode, 2013�2020 (KT)
Table 20 Regulations on Transportation and Storage of Gas Cylinders
Table 21 Industrial Gases in the Glass Industry Market Size, By Function, 2013�2020 (USD Million)
Table 22 Industrial Gases in the Glass Industry Market Size, By Function, 2013�2020 (KT)
Table 23 Industrial Gases in the Glass Industry Market Size, By Region, 2013�2020 (USD Million)
Table 24 Industrial Gases in the Glass Industry Market Size, By Region, 2013�2020 (KT)
Table 25 Asia-Pacific: Industrial Gases in the Glass Industry Market Size, By Country, 2013�2020 (USD Million)
Table 26 Asia-Pacific: Industrial Gases in the Glass Industry Market Size, By Country, 2013�2020 (KT)
Table 27 Asia-Pacific: Industrial Gases in the Glass Industry Market Size, By Type, 2013�2020 (USD Million)
Table 28 Asia-Pacific: Industrial Gases in the Glass Industry Market Size, By Type, 2013�2020 (KT)
Table 29 Asia-Pacific: Industrial Gases in the Glass Industry Market Size, By Glass Type, 2013�2020 (USD Million)
Table 30 Asia-Pacific: Industrial Gases in the Glass Industry Market Size, By Glass Type, 2013�2020 (KT)
Table 31 Asia-Pacific: Industrial Gases in the Glass Industry Market Size, By Function, 2013�2020 (USD Million)
Table 32 Asia-Pacific: Industrial Gases in the Glass Industry Market Size, By Function, 2013�2020 (KT)
Table 33 Asia-Pacific: Industrial Gases in the Glass Industry Market Size, By Transportation Mode, 2013�2020 (USD Million)
Table 34 Asia-Pacific: Industrial Gases in the Glass Industry Market Size, By Transportation Mode, 2013�2020 (KT)
Table 35 China: Industrial Gases in the Glass Industry Market Size, By Type, 2013�2020 (USD Million)
Table 36 China: Industrial Gases in the Glass Industry Market Size, By Type, 2013�2020 (KT)
Table 37 China: Industrial Gases in the Glass Industry Market Size, By Glass Type, 2013�2020 (USD Million)
Table 38 China: Industrial Gases in the Glass Industry Market Size, By Glass Type, 2013�2020 (KT)
Table 39 China: Industrial Gases in the Glass Industry Market Size, By Function, 2013�2020 (USD Million)
Table 40 China: Industrial Gases in the Glass Industry Market Size, By Function, 2013�2020 (KT)
Table 41 China: Industrial Gases in the Glass Industry Market Size, By Transportation Mode, 2013�2020 (USD Million)
Table 42 China: Industrial Gases in the Glass Industry Market Size, By Transportation Mode, 2013�2020 (KT)
Table 43 Japan: Industrial Gases in the Glass Industry Market Size, By Type, 2013�2020 (USD Million)
Table 44 Japan: Industrial Gases in the Glass Industry Market Size, By Type, 2013�2020 (KT)
Table 45 Japan: Industrial Gases in the Glass Industry Market Size, By Glass Type, 2013�2020 (USD Million)
Table 46 Japan: Industrial Gases in the Glass Industry Market Size, By Glass Type, 2013�2020 (KT)
Table 47 Japan: Industrial Gases in the Glass Industry Market Size, By Function, 2013�2020 (USD Million)
Table 48 Japan: Industrial Gases in the Glass Industry Market Size, By Function, 2013�2020 (KT)
Table 49 Japan: Industrial Gases in the Glass Industry Market Size, By Transportation Mode, 2013�2020 (USD Million)
Table 50 Japan: Industrial Gases in the Glass Industry Market Size, By Transportation Mode, 2013�2020 (KT)
Table 51 India: Industrial Gases in the Glass Industry Market Size, By Type, 2013�2020 (USD Million)
Table 52 India: Industrial Gases in the Glass Industry Market Size, By Type, 2013�2020 (KT)
Table 53 India: Industrial Gases in the Glass Industry Market Size, By Glass Type, 2013�2020 (USD Million)
Table 54 India: Industrial Gases in the Glass Industry Market Size, By Glass Type, 2013�2020 (KT)
Table 55 India: Industrial Gases in the Glass Industry Market Size, By Function, 2013�2020 (USD Million)
Table 56 India: Industrial Gases in the Glass Industry Market Size, By Function, 2013�2020 (KT)
Table 57 India: Industrial Gases in the Glass Industry Market Size, By Transportation Mode, 2013�2020 (USD Million)
Table 58 India: Industrial Gases in the Glass Industry Market Size, By Transportation Mode, 2013�2020 (KT)
Table 59 South Korea: Industrial Gases in the Glass Industry Market Size, By Type, 2013�2020 (USD Million)
Table 60 South Korea: Industrial Gases in the Glass Industry Market Size, By Type, 2013�2020 (KT)
Table 61 South Korea: Industrial Gases in the Glass Industry Market Size, By Glass Type, 2013�2020 (USD Million)
Table 62 South Korea: Industrial Gases in the Glass Industry Market Size, By Glass Type, 2013�2020 (KT)
Table 63 South Korea: Industrial Gases in the Glass Industry Market Size, By Function, 2013�2020 (USD Million)
Table 64 South Korea: Industrial Gases in the Glass Industry Market Size, By Function, 2013�2020 (KT)
Table 65 South Korea: Industrial Gases in the Glass Industry Market Size, By Transportation Mode, 2013�2020 (USD Million)
Table 66 South Korea: Industrial Gases in the Glass Industry Market Size, By Transportation Mode, 2013�2020 (KT)
Table 67 Rest of Asia-Pacific: Industrial Gases in the Glass Industry Market Size, By Type, 2013�2020 (USD Million)
Table 68 Rest of Asia-Pacific: Industrial Gases in the Glass Industry Market Size, By Type, 2013�2020 (KT)
Table 69 Rest of Asia-Pacific: Industrial Gases in the Glass Industry Market Size, By Glass Type, 2013�2020 (USD Million)
Table 70 Rest of Asia-Pacific: Industrial Gases in the Glass Industry Market Size, By Glass Type, 2013�2020 (KT)
Table 71 Rest of Asia-Pacific: Industrial Gases in the Glass Industry Market Size, By Function, 2013�2020 (USD Million)
Table 72 Rest of Asia-Pacific: Industrial Gases in the Glass Industry Market Size, By Function, 2013�2020 (KT)
Table 73 Rest of Asia-Pacific: Industrial Gases in the Glass Industry Market Size, By Transportation Mode, 2013�2020 (USD Million)
Table 74 Rest of Asia-Pacific: Industrial Gases in the Glass Industry Market Size, By Transportation Mode, 2013�2020 (KT)
Table 75 Europe: Industrial Gases in the Glass Industry Market Size, By Country, 2013�2020 (USD Million)
Table 76 Europe: Industrial Gases in the Glass Industry Market Size, By Country, 2013�2020 (KT)
Table 77 Europe: Industrial Gases in the Glass Industry Market Size, By Type, 2013�2020 (USD Million)
Table 78 Europe: Industrial Gases in the Glass Industry Market Size, By Type, 2013�2020 (KT)
Table 79 Europe: Industrial Gases in the Glass Industry Market Size, By Glass Type, 2013�2020 (USD Million)
Table 80 Europe: Industrial Gases in the Glass Industry Market Size, By Glass Type, 2013�2020 (KT)
Table 81 Europe: Industrial Gases in The Glass Industry Market Size, By Function, 2013�2020 (USD Million)
Table 82 Europe: Industrial Gases in the Glass Industry Market Size, By Function, 2013�2020 (KT)
Table 83 Europe: Industrial Gases in the Glass Industry Market Size, By Transportation Mode, 2013�2020 (USD Million)
Table 84 Europe: Industrial Gases in the Glass Industry Market Size, By Transportation Mode, 2013�2020 (KT)
Table 85 Germany: Industrial Gases in the Glass Industry Market Size, By Type, 2013�2020 (USD Million)
Table 86 Germany: Industrial Gases in the Glass Industry Market Size, By Type, 2013�2020 (KT)
Table 87 Germany: Industrial Gases in the Glass Industry Market Size, By Glass Type, 2013�2020 (USD Million)
Table 88 Germany: Industrial Gases in the Glass Industry Market Size, By Glass Type, 2013�2020 (KT)
Table 89 Germany: Industrial Gases in the Glass Industry Market Size, By Function, 2013�2020 (USD Million)
Table 90 Germany: Industrial Gases in the Glass Industry Market Size, By Function, 2013�2020 (KT)
Table 91 Germany: Industrial Gases in the Glass Industry Market Size, By Transportation Mode, 2013�2020 (USD Million)
Table 92 Germany: Industrial Gases in the Glass Industry Market Size, By Transportation Mode, 2013�2020 (KT)
Table 93 U.K.: Industrial Gases in the Glass Industry Market Size, By Type, 2013�2020 (USD Million)
Table 94 U.K.: Industrial Gases in the Glass Industry Market Size, By Material, 2013�2020 (KT)
Table 95 U.K.: Industrial Gases in the Glass Industry Market Size, By Glass Type, 2013�2020 (USD Million)
Table 96 U.K.: Industrial Gases in the Glass Industry Market Size, By Glass Type, 2013�2020 (KT)
Table 97 U.K.: Industrial Gases in the Glass Industry Market Size, By Function, 2013�2020 (USD Million)
Table 98 U.K.: Industrial Gases in the Glass Industry Market Size, By Function, 2013�2020 (KT)
Table 99 U.K.: Industrial Gases in the Glass Industry Market Size, By Transportation Mode, 2013�2020 (USD Million)
Table 100 U.K.: Industrial Gases in the Glass Industry Market Size, By Transportation Mode, 2013�2020 (KT)
Table 101 Italy: Industrial Gases in the Glass Industry Market Size, By Type, 2013�2020 (USD Million)
Table 102 Italy: Industrial Gases in the Glass Industry Market Size, By Type, 2013�2020 (KT)
Table 103 Italy: Industrial Gases in the Glass Industry Market Size, By Glass Type, 2013�2020 (USD Million)
Table 104 Italy: Industrial Gases in the Glass Industry Market Size, By Glass Type, 2013�2020 (KT)
Table 105 Italy: Industrial Gases in the Glass Industry Market Size, By Function, 2013�2020 (USD Million)
Table 106 Italy: Industrial Gases in the Glass Industry Market Size, By Function, 2013�2020 (KT)
Table 107 Italy: Industrial Gases in the Glass Industry Market Size, By Transportation Mode, 2013�2020 (USD Million)
Table 108 Italy: Industrial Gases in the Glass Industry Market Size, By Transportation Mode, 2013�2020 (KT)
Table 109 France: Industrial Gases in the Glass Industry Market Size, By Type, 2013�2020 (USD Million)
Table 110 France: Industrial Gases in the Glass Industry Market Size, By Type, 2013�2020 (KT)
Table 111 France: Industrial Gases in the Glass Industry Market Size, By Glass Type, 2013�2020 (USD Million)
Table 112 France: Industrial Gases in the Glass Industry Market Size, By Glass Type, 2013�2020 (KT)
Table 113 France: Industrial Gases in the Glass Industry Market Size, By Function, 2013�2020 (USD Million)
Table 114 France: Industrial Gases in the Glass Industry Market Size, By Function, 2013�2020 (KT)
Table 115 France: Industrial Gases in the Glass Industry Market Size, By Transportation Mode, 2013�2020 (USD Million)
Table 116 France: Industrial Gases in the Glass Industry Market Size, By Transportation Mode, 2013�2020 (KT)
Table 117 Rest of Europe: Industrial Gases in the Glass Industry Market Size, By Type, 2013�2020 (USD Million)
Table 118 Rest of Europe: Industrial Gases in the Glass Industry Market Size, By Type, 2013�2020 (KT)
Table 119 Rest of Europe: Industrial Gases in the Glass Industry Market Size, By Glass Type, 2013�2020 (USD Million)
Table 120 Rest of Europe: Industrial Gases in the Glass Industry Market Size, By Glass Type, 2013�2020 (KT)
Table 121 Rest of Europe: Industrial Gases in the Glass Industry Market Size, By Function, 2013�2020 (USD Million)
Table 122 Rest of Europe: Industrial Gases in the Glass Industry Market Size, By Function, 2013�2020 (KT)
Table 123 Rest of Europe: Industrial Gases in the Glass Industry Market Size, By Transportation Mode, 2013�2020 (USD Million)
Table 124 Rest of Europe: Industrial Gases in the Glass Industry Market Size, By Transportation Mode, 2013�2020 (KT)
Table 125 North America: Industrial Gases in the Glass Industry Market Size, By Country, 2013�2020 (USD Million)
Table 126 North America: Industrial Gases in the Glass Industry Market Size, By Country, 2013�2020 (KT)
Table 127 North America: Industrial Gases in the Glass Industry Market Size, By Type, 2013�2020 (USD Million)
Table 128 North America: Industrial Gases in the Glass Industry Market Size, By Type, 2013�2020 (KT)
Table 129 North America: Industrial Gases in the Glass Industry Market Size, By Glass Type, 2013�2020 (USD Million)
Table 130 North America: Industrial Gases in the Glass Industry Market Size, By Glass Type, 2013�2020 (KT)
Table 131 North America: Industrial Gases in the Glass Industry Market Size, By Function, 2013�2020 (USD Million)
Table 132 North America: Industrial Gases in the Glass Industry Market Size, By Function, 2013�2020 (KT)
Table 133 North America: Industrial Gases in the Glass Industry Market Size, By Transportation Mode, 2013�2020 (USD Million)
Table 134 North America: Industrial Gases in the Glass Industry Market Size, By Transportation Mode, 2013�2020 (KT)
Table 135 U.S.: Industrial Gases in the Glass Industry Market Size, By Type, 2013�2020 (USD Million)
Table 136 U.S.: Industrial Gases in the Glass Industry Market Size, By Type, 2013�2020 (KT)
Table 137 U.S.: Industrial Gases in the Glass Industry Market Size, By Glass Type, 2013�2020 (USD Million)
Table 138 U.S.: Industrial Gases in the Glass Industry Market Size, By Glass Type, 2013�2020 (KT)
Table 139 U.S.: Industrial Gases in the Glass Industry Market Size, By Function, 2013�2020 (USD Million)
Table 140 U.S.: Industrial Gases in the Glass Industry Market Size, By Function, 2013�2020 (KT)
Table 141 U.S.: Industrial Gases in the Glass Industry Market Size, By Transportation Mode, 2013�2020 (USD Million)
Table 142 U.S.: Industrial Gases in the Glass Industry Market Size, By Transportation Mode, 2013�2020 (KT)
Table 143 Canada: Industrial Gases in the Glass Industry Market Size, By Type, 2013�2020 (USD Million)
Table 144 Canada: Industrial Gases in the Glass Industry Market Size, By Type, 2013�2020 (KT)
Table 145 Canada: Industrial Gases in the Glass Industry Market Size, By Glass Type, 2013�2020 (USD Million)
Table 146 Canada: Industrial Gases in the Glass Industry Market Size, By Glass Type, 2013�2020 (KT)
Table 147 Canada: Industrial Gases in the Glass Industry Market Size, By Function, 2013�2020 (USD Million)
Table 148 Canada: Industrial Gases in the Glass Industry Market Size, By Function, 2013�2020 (KT)
Table 149 Canada: Industrial Gases in the Glass Industry Market Size, By Transportation Mode, 2013�2020 (USD Million)
Table 150 Canada: Industrial Gases in the Glass Industry Market Size, By Transportation Mode, 2013�2020 (KT)
Table 151 Mexico: Industrial Gases in the Glass Industry Market Size, By Type, 2013�2020 (USD Million)
Table 152 Mexico: Industrial Gases in the Glass Industry Market Size, By Type, 2013�2020 (KT)
Table 153 Mexico: Industrial Gases in the Glass Industry Market Size, By Glass Type, 2013�2020 (USD Million)
Table 154 Mexico: Industrial Gases in the Glass Industry Market Size, By Glass Type, 2013�2020 (KT)
Table 155 Mexico: Industrial Gases in the Glass Industry Market Size, By Function, 2013�2020 (USD Million)
Table 156 Mexico: Industrial Gases in the Glass Industry Market Size, By Function, 2013�2020 (KT)
Table 157 Mexico: Industrial Gases in the Glass Industry Market Size, By Transportation Mode, 2013�2020 (USD Million)
Table 158 Mexico: Industrial Gases in the Glass Industry Market Size, By Transportation Mode, 2013�2020 (KT)
Table 159 RoW: Industrial Gases in the Glass Industry Market Size, By Country, 2013�2020 (USD Million)
Table 160 RoW: Industrial Gases in the Glass Industry Market Size, By Country, 2013�2020 (KT)
Table 161 RoW: Industrial Gases in the Glass Industry Market Size, By Type, 2013�2020 (USD Million)
Table 162 RoW: Industrial Gases in the Glass Industry Market Size, By Type, 2013�2020 (KT)
Table 163 RoW: Industrial Gases in the Glass Industry Market Size, By Glass Type, 2013�2020 (USD Million)
Table 164 RoW: Industrial Gases in the Glass Industry Market Size, By Glass Type, 2013�2020 (KT)
Table 165 RoW: Industrial Gases in the Glass Industry Market Size, By Function, 2013�2020 (USD Million)
Table 166 RoW: Industrial Gases in the Glass Industry Market Size, By Function, 2013�2020 (KT)
Table 167 RoW: Industrial Gases in the Glass Industry Market Size, By Transportation Mode, 2013�2020 (USD Million)
Table 168 RoW: Industrial Gases in the Glass Industry Market Size, By Transportation Mode, 2013�2020 (KT)
Table 169 Brazil: Industrial Gases in the Glass Industry Market Size, By Type, 2013�2020 (USD Million)
Table 170 Brazil: Industrial Gases in the Glass Industry Market Size, By Type, 2013�2020 (KT)
Table 171 Brazil: Industrial Gases in the Glass Industry Market Size, By Glass Type, 2013�2020 (USD Million)
Table 172 Brazil: Industrial Gases in the Glass Industry Market Size, By Glass Type, 2013�2020 (KT)
Table 173 Brazil: Industrial Gases in the Glass Industry Market Size, By Function, 2013�2020 (USD Million)
Table 174 Brazil: Industrial Gases in the Glass Industry Market Size, By Function, 2013�2020 (KT)
Table 175 Brazil: Industrial Gases in the Glass Industry Market Size, By Transportation Mode, 2013�2020 (USD Million)
Table 176 Brazil: Industrial Gases in the Glass Industry Market Size, By Transportation Mode, 2013�2020 (KT)
Table 177 Argentina: Industrial Gases in the Glass Industry Market Size, By Type, 2013�2020 (USD Million)
Table 178 Argentina: Industrial Gases in the Glass Industry Market Size, By Type, 2013�2020 (KT)
Table 179 Argentina: Industrial Gases in the Glass Industry Market Size, By Glass Type, 2013�2020 (USD Million)
Table 180 Argentina: Industrial Gases in the Glass Industry Market Size, By Glass Type, 2013�2020 (KT)
Table 181 Argentina: Industrial Gases in the Glass Industry Market Size, By Function, 2013�2020 (USD Million)
Table 182 Argentina: Industrial Gases in the Glass Industry Market Size, By Function, 2013�2020 (KT)
Table 183 Argentina: Industrial Gases in the Glass Industry Market Size, By Transportation Mode, 2013�2020 (USD Million)
Table 184 Argentina: Industrial Gases in the Glass Industry Market Size, By Transportation Mode, 2013�2020 (KT)
Table 185 South Africa: Industrial Gases in the Glass Industry Market Size, By Type, 2013�2020 (USD Million)
Table 186 South Africa: Industrial Gases in the Glass Industry Market Size, By Type, 2013�2020 (KT)
Table 187 South Africa: Industrial Gases in the Glass Industry Market Size, By Glass Type, 2013�2020 (USD Million)
Table 188 South Africa: Industrial Gases in the Glass Industry Market Size, By Glass Type, 2013�2020 (KT)
Table 189 South Africa: Industrial Gases in the Glass Industry Market Size, By Function, 2013�2020 (USD Million)
Table 190 South Africa: Industrial Gases in the Glass Industry Market Size, By Function, 2013�2020 (KT)
Table 191 South Africa: Industrial Gases in the Glass Industry Market Size, By Transportation Mode, 2013�2020 (USD Million)
Table 192 South Africa: Industrial Gases in the Glass Industry Market Size, By Transportation Mode, 2013�2020 (KT)
Table 193 Other Countries in RoW: Industrial Gases in the Glass Industry Market Size, By Type, 2013�2020 (USD Million)
Table 194 Other Countries in RoW: Industrial Gases in the Glass Industry Market Size, By Type, 2013�2020 (KT)
Table 195 Other Countries in RoW: Industrial Gases in the Glass Industry Market Size, By Glass Type, 2013�2020 (USD Million)
Table 196 Other Countries in RoW: Industrial Gases in the Glass Industry Market Size, By Glass Type, 2013�2020 (KT)
Table 197 Other Countries in RoW: Industrial Gases in the Glass Industry Market Size, By Function, 2013�2020 (USD Million)
Table 198 Other Countries in RoW: Industrial Gases in the Glass Industry Market Size, By Function, 2013�2020 (KT)
Table 199 Other Countries in RoW: Industrial Gases in the Glass Industry Market Size, By Transportation Mode, 2013�2020 (USD Million)
Table 200 Other Countries in RoW: Industrial Gases in the Glass Industry Market Size, By Transportation Mode, 2013�2020 (KT)
Table 201 Mergers & Acquisitions, 2011�2015
Table 202 Investments & Expansions, 2011�2015
Table 203 Partnerships, Agreements & Joint Ventures, 2011�2015
Table 204 New Product Developments, 2011�2015
List of Figures (60 Figures)
Figure 1 Industrial Gas in the Glass Industry Market Segmentation
Figure 2 Industrial Gases in the Glass Industry: Research Design
Figure 3 Population Growth has Increased By 3 Billion in the Last Three Decades
Figure 4 Increase in the Total Expenditure of Middle-Class Families
Figure 5 Growth in Manufacturing & Service Sectors
Figure 6 Crude Oil Spot Prices, 2004-2014
Figure 7 Natural Gas Prices, 2004-2014
Figure 8 Market Size Estimation Methodology: Top-Down Approach
Figure 9 Data Triangulation Methodology
Figure 10 Glass Type, 2015 vs 2020 (USD Million)
Figure 11 Industrial Gases in the Glass Industry Market Size, By Region, 2015 vs 2020 (USD Million)
Figure 12 China is Projected to Be the Fastest-Growing Market for Industrial Gases in the Glass Industry From 2015 to 2020
Figure 13 Leading Market Players Adopted Mergers & Acquisitions as the Key Strategies, 2011�2015
Figure 14 Emerging Economies Offer Attractive Opportunities in the Industrial Gases in the Glass Industry
Figure 15 Hydrogen Held the Largest Share in 2014, in Terms of Value
Figure 16 Cylinder & Packaged Gas Distribution Segment Captured the Largest Share in the Emerging Asia-Pacific Market in 2014
Figure 17 China Projected to Be the Fastest-Growing Country for Industrial Gases in the Glass Industry, 2015-2020
Figure 18 Asia-Pacific Occupied the Largest Market Share Among All Regions in 2014
Figure 19 Emerging Markets to Grow Faster Than Developed Markets (2015-2020)
Figure 20 Forming & Melting Accounted for the Largest Share in 2014
Figure 21 The Market for Industrial Gases in the Glass Industry in Asia-Pacific Region is Experiencing High Growth
Figure 22 Evolution of Industrial Gases in the Glass Manufacturing Industry
Figure 23 Increasing Demand From End-Use Industries is the Main Driver for the Growth of Industrial Gas Market
Figure 24 Environmental Impacts By the Glass Manufacturing Process
Figure 25 Global Vehicle Production From 2009 to 2014
Figure 26 Industrial Gases in the Glass Industry Value Chain
Figure 27 Porter�s Five Forces Analysis
Figure 28 Industrial Gases in the Glass Industry Market, Average Price Analysis, By Region
Figure 29 Industrial Gases in the Glass Industry Market, Average Price Analysis, By Type
Figure 30 Industrial Gases in the Glass Industry Market, Average Price Analysis, By Function
Figure 31 Industrial Gases in the Glass Industry Market, Average Price Analysis, By Glass Type
Figure 32 Container Glass Held the Largest Share Among All Glass Types in 2014
Figure 33 Hydrogen Dominated the Market for Industrial Gases in the Glass Industry, in 2014
Figure 34 Cylinder & Packaged Gas Distribution Projected to Account for the Largest Share By 2020
Figure 35 Forming & Melting Held the Largest Share Among All Functions in 2014
Figure 36 Geographical Snapshot: Industrial Gases in the Glass Industry Growth Rate (2015-2020)
Figure 37 China Poised to Grow at the Highest CAGR By 2020
Figure 38 Asia-Pacific: the Market for Potential Growth for Industrial Gases in the Glass Industry
Figure 39 Germany: Fastest-Growing Market in Europe
Figure 40 Mexico: Fastest-Growing Market in North America Between 2015 and 2020
Figure 41 Brazil: Fastest-Growing Market in RoW
Figure 42 Companies Adopted Mergers & Acquisitions as Their Key Growth Strategy Over the Last Five Years
Figure 43 Industrial Gases in the Glass Industry: Revenue of the Linde Group Grew at the Highest Rate Between 2011 & 2014
Figure 44 Mergers & Acquisitions Fueled the Growth of the Industrial Gases in the Glass Industry
Figure 45 Geographic Revenue Mix of Top 5 Players
Figure 46 Air Products & Chemicals, Inc.: Company Snapshot
Figure 47 Air Products and Chemicals: SWOT Analysis
Figure 48 The Linde Group: Company Snapshot
Figure 49 The Linde Group: SWOT Analysis
Figure 50 Praxair, Inc.: Company Snapshot
Figure 51 Praxair Inc.: SWOT Analysis
Figure 52 Air Liquide SA: Company Snapshot
Figure 53 Air Liquide S.A.: SWOT Analysis
Figure 54 Taiyo Nippon Sanso Corporation: Company Snapshot
Figure 55 Taiyo Nippon Sanso Corporation: SWOT Analysis
Figure 56 Messer Group GmbH: Company Snapshot
Figure 57 Gulf Cryo: Company Snapshot
Figure 58 Hygear: Company Snapshot
Figure 59 SIG Gases Berhad: Company Snapshot
Figure 60 Air Water, Inc.: Company Snapshot


Growth opportunities and latent adjacency in Industrial Gases-Glass Industry Market