2
RESEARCH METHODOLOGY
44
5
MARKET OVERVIEW
Emerging markets and tech innovations drive infectious disease diagnostics' decentralized growth.
69
5.2.1.1
RISING PREVALENCE OF INFECTIOUS DISEASES
5.2.1.2
RISING FOCUS ON R&D AND FUNDING INVESTMENTS FOR INFECTIOUS DISEASE DIAGNOSTIC PRODUCTS
5.2.1.3
ADOPTION OF INNOVATIVE & ADVANCED TECHNOLOGIES FOR INFECTIOUS DISEASE DIAGNOSIS
5.2.1.4
GRADUAL SHIFT FROM CENTRALIZED LABORATORIES TO DECENTRALIZED POC TESTING CENTERS
5.2.2.1
UNFAVORABLE REIMBURSEMENTS
5.2.3.1
HIGH GROWTH POTENTIAL OF EMERGING ECONOMIES
5.2.4.1
STRINGENT REGULATORY GUIDELINES FOR IVD PRODUCTS
5.2.4.2
OPERATIONAL BARRIERS AND SHORTAGE OF SKILLED LABORATORY TECHNICIANS
5.3.1
INDICATIVE SELLING PRICE TREND OF INFECTIOUS DISEASE DIAGNOSTICS PRODUCTS, 2023−2025
5.3.2
INDICATIVE SELLING PRICE TREND OF INFECTIOUS DISEASE TEST KITS & ASSAYS, BY KEY PLAYER,2023−2025
5.3.3
INDICATIVE SELLING PRICE TREND OF INFECTIOUS DISEASE DIAGNOSTIC PRODUCTS, BY REGION, 2023−2025
5.4.1
LIST OF MAJOR PATENTS
5.6
SUPPLY CHAIN ANALYSIS
5.7.1
TRADE ANALYSIS FOR DIAGNOSTIC & LABORATORY REAGENTS
5.7.2
IMPORT DATA (HS CODE 3822)
5.7.3
EXPORT DATA (HS CODE 3822)
5.8.1
INFECTIOUS DISEASE DIAGNOSTICS MARKET: ROLE IN ECOSYSTEM
5.9
PORTER’S FIVE FORCES ANALYSIS
5.9.1
THREAT OF NEW ENTRANTS
5.9.2
THREAT OF SUBSTITUTES
5.9.3
BARGAINING POWER OF BUYERS
5.9.4
BARGAINING POWER OF SUPPLIERS
5.9.5
INTENSITY OF COMPETITIVE RIVALRY
5.10
REGULATORY LANDSCAPE
5.10.1
REGULATORY FRAMEWORK
5.10.2
REGULATORY BODIES, GOVERNMENT AGENCIES, AND OTHER ORGANIZATIONS
5.11.1.1
IMMUNODIAGNOSTICS
5.11.2
COMPLEMENTARY TECHNOLOGIES
5.11.2.1
POLYMERASE CHAIN REACTION (PCR)
5.11.3
ADJACENT TECHNOLOGIES
5.11.3.1
NEXT-GENERATION SEQUENCING (NGS)
5.12
KEY CONFERENCES & EVENTS, 2025–2026
5.13
TRENDS/DISRUPTIONS IMPACTING CUSTOMERS’ BUSINESSES
5.14
KEY STAKEHOLDERS & BUYING CRITERIA
5.14.1
KEY STAKEHOLDERS IN BUYING PROCESS
5.15
INVESTMENT & FUNDING SCENARIO
5.16.1
CASE STUDY 1: IMPLEMENTING RAPID PCR TESTING TO IMPROVE NOROVIRUS DIAGNOSIS & BED MANAGEMENT
5.16.2
CASE STUDY 2: USING MOLECULAR DIAGNOSTICS TO IDENTIFY ATYPICAL RESPIRATORY INFECTIONS
5.16.3
CASE STUDY 3: RAPID DIFFERENTIATION OF VIRAL & BACTERIAL INFECTION IN PEDIATRIC PATIENTS
5.17
IMPACT OF AI/GENERATIVE AI ON INFECTIOUS DISEASE DIAGNOSTICS MARKET
5.17.2
MARKET POTENTIAL OF AI
5.17.4
IMPLEMENTATION OF AI, BY KEY COMPANY & CASE
5.17.5
FUTURE OF AI IN INFECTIOUS DISEASE DIAGNOSTICS MARKET
5.18
TRUMP TARIFF IMPACT ON INFECTIOUS DISEASE DIAGNOSTICS MARKET
5.18.3
PRICE IMPACT ANALYSIS
5.18.4
KEY IMPACT ON COUNTRY/REGION
5.18.5
IMPACT ON END-USE INDUSTRIES
5.18.5.1
DIAGNOSTIC LABORATORIES
5.18.5.2
HOSPITALS & CLINICS
5.18.5.3
ACADEMIC RESEARCH INSTITUTES
6
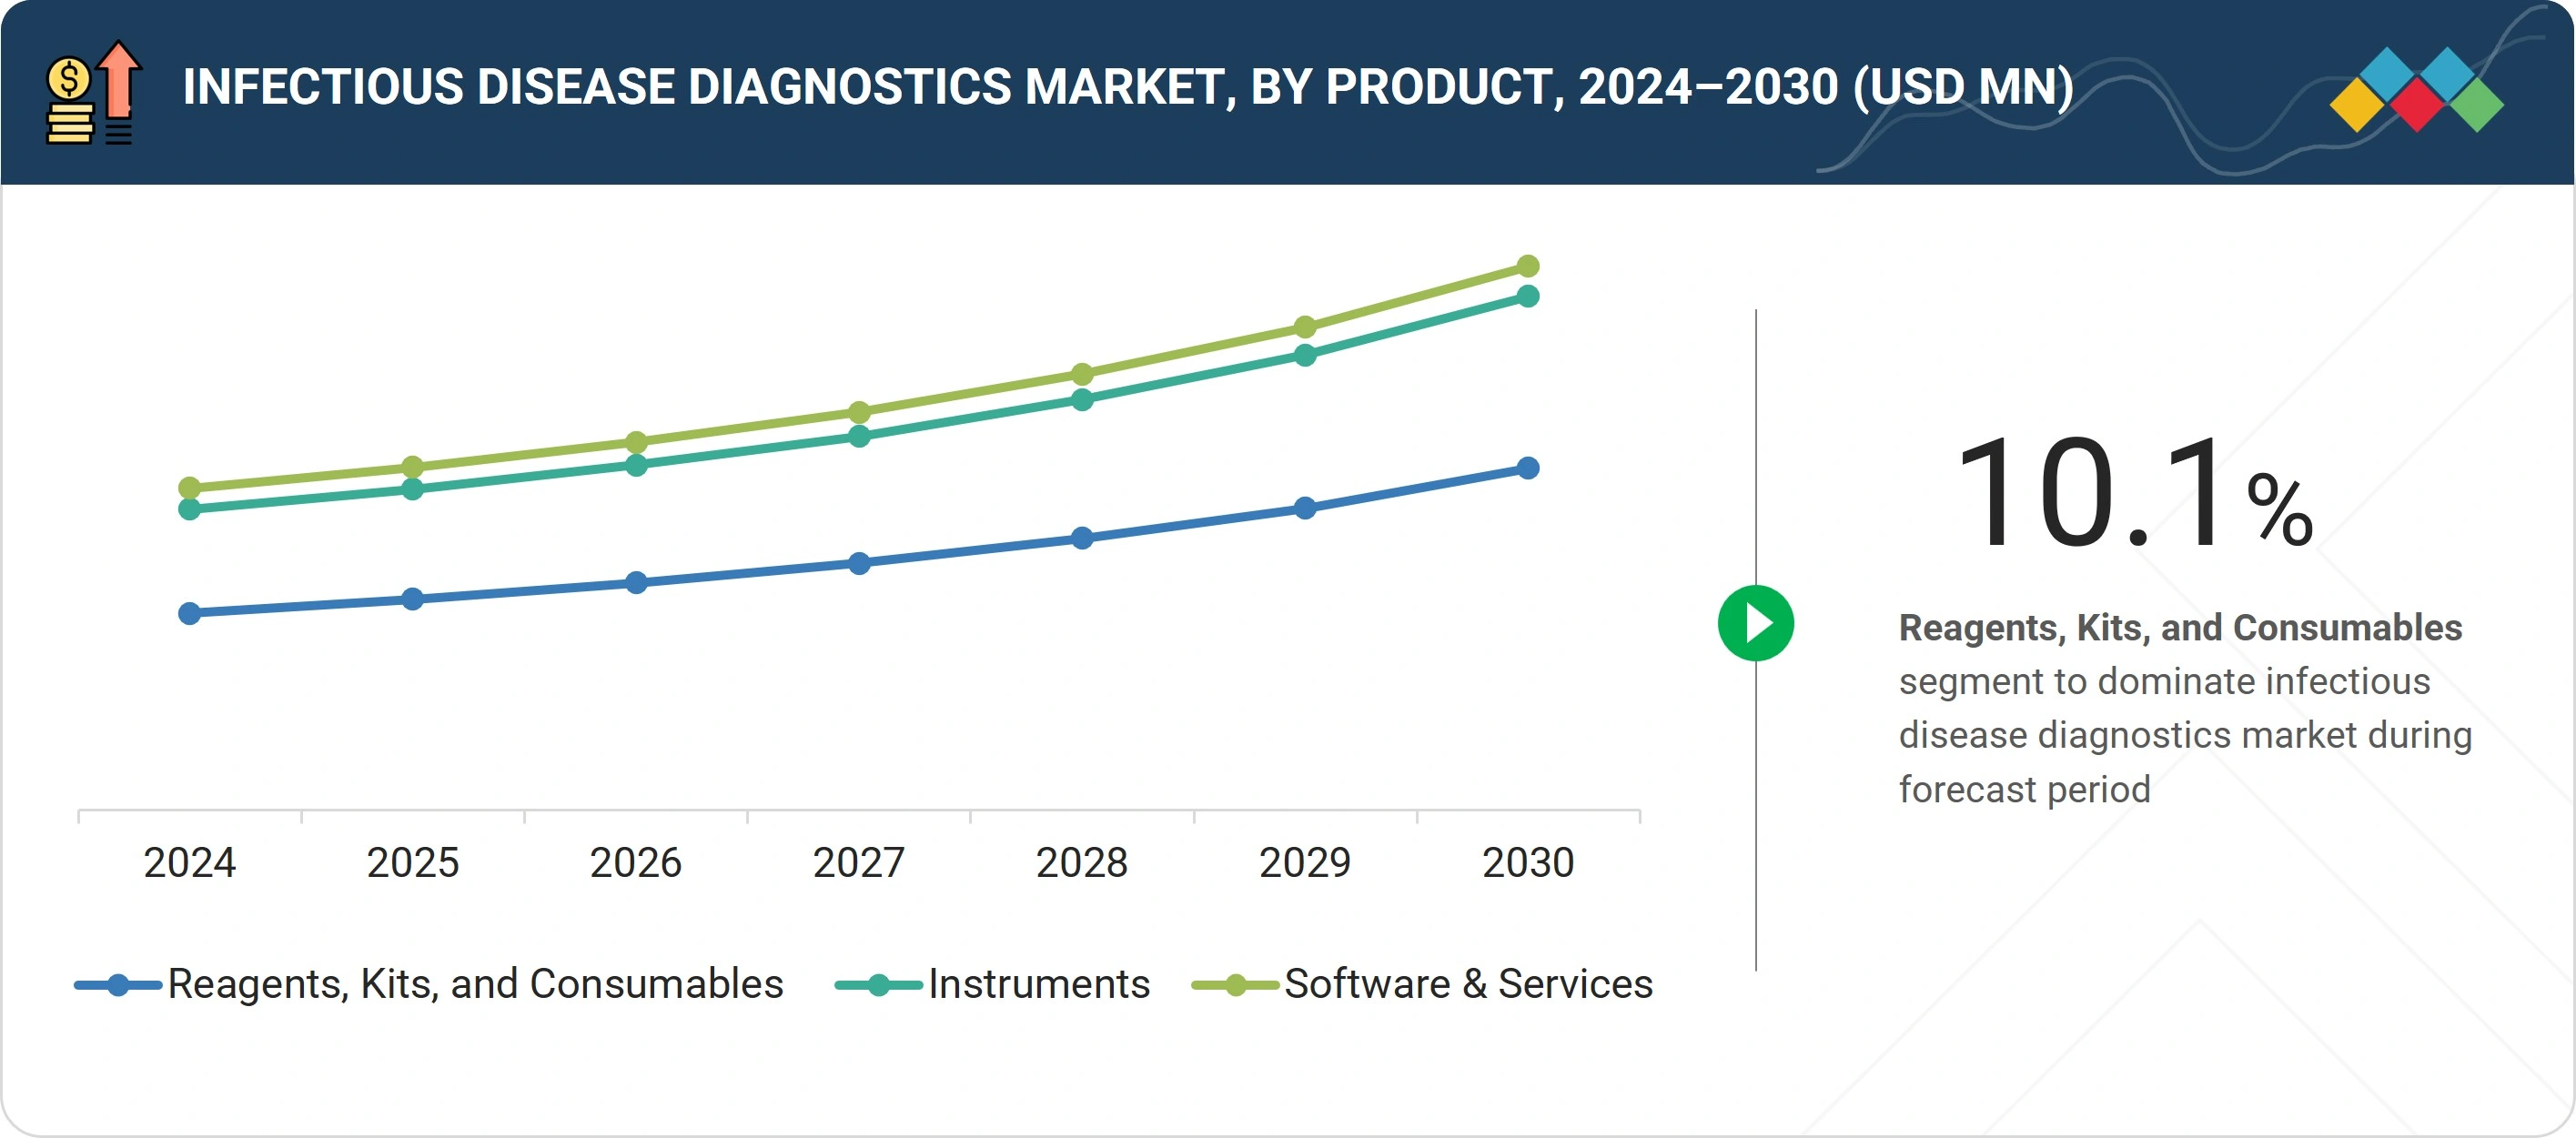
INFECTIOUS DISEASE DIAGNOSTICS MARKET, BY PRODUCT & SERVICE
Market Size & Growth Rate Forecast Analysis to 2030 in USD Million | 22 Data Tables
108
6.2
REAGENTS, KITS, AND CONSUMABLES
6.2.1
RECURRENT PURCHASE TO PROPEL MARKET
6.3.1
RAPID TECHNOLOGICAL ADVANCEMENTS FOR ADVANCED ACCURACY TO DRIVE MARKET
6.4.1
INCREASING FOCUS ON VALUE-ADDED SERVICES TO SUPPORT MARKET GROWTH
7
INFECTIOUS DISEASE DIAGNOSTICS MARKET, BY TYPE OF TESTING
Market Size & Growth Rate Forecast Analysis to 2030 in USD Million | 15 Data Tables
122
7.2.1
HIGHER SENSITIVITY & SPECIFICITY TO FUEL UPTAKE
7.3.1
RAPID TURNAROUND TIME AND INCREASING CLIA APPROVALS FOR POC TESTS TO PROPEL MARKET
8
INFECTIOUS DISEASE DIAGNOSTICS MARKET, BY SAMPLE TYPE
Market Size & Growth Rate Forecast Analysis to 2030 in USD Million | 19 Data Tables
130
8.2
BLOOD, SERUM, AND PLASMA
8.2.1
HIGHER VERSATILITY, ENHANCED CLINICAL EFFICACY, AND IMPROVED REIMBURSEMENT POLICIES TO DRIVE MARKET
8.3.1
NON-INVASIVE NATURE AND ENHANCED PATIENT CONVENIENCE TO BOOST DEMAND
9
INFECTIOUS DISEASE DIAGNOSTICS MARKET, BY DISEASE TYPE
Market Size & Growth Rate Forecast Analysis to 2030 in USD Million | 96 Data Tables
140
9.2.1.1
HIGHLY CONTAGIOUS INFECTION AND REQUIREMENT FOR REGULAR MONITORING TO FUEL MARKET
9.2.2.1
RISING INCIDENCE OF CHRONIC HCV AND SUPPORTIVE GOVERNMENT INITIATIVES TO DRIVE MARKET
9.2.3
OTHER HEPATITIS DISEASES
9.3.1
INCREASING PREVALENCE OF AIDS TO BOOST DEMAND
9.4
HOSPITAL-ACQUIRED INFECTIONS
9.4.1
RISING BURDEN OF MRSA INFECTIONS TO FUEL MARKET
9.5
MOSQUITO-BORNE DISEASES
9.5.1
RISING INCIDENCE OF DENGUE & MALARIA TO PROPEL MARKET
9.6.1
RAPID TECHNOLOGICAL ADVANCES TO BOOST DEMAND
9.7
CHLAMYDIA TRACHOMATIS
9.7.1
INCREASING AWARENESS INITIATIVES TO SUPPORT MARKET UPTAKE
9.8.1
RISING INCIDENCE OF GONORRHEA TO FUEL MARKET
9.9.1
INCREASING BURDEN OF TB IN UNDERSERVED AREAS TO DRIVE MARKET
9.10.1
INCREASING FOCUS ON RAPID DIAGNOSIS USING POC TESTING METHODS TO FUEL MARKET
9.11.1
IMPROVED SCREENING TECHNOLOGIES TO SUPPORT MARKET UPTAKE
9.12
OTHER INFECTIOUS DISEASES
10
INFECTIOUS DISEASE DIAGNOSTICS MARKET, BY TECHNOLOGY
Market Size & Growth Rate Forecast Analysis to 2030 in USD Million | 49 Data Tables
184
10.2.1
RISING PREVALENCE OF INFECTIOUS DISEASES AND DEMAND FOR RAPID DIAGNOSTIC KITS TO DRIVE MARKET
10.3
CLINICAL MICROBIOLOGY
10.3.1
RAPID TURNAROUND TIME WITH HIGHER SENSITIVITY & RELIABLE RESULTS TO BOOST DEMAND
10.4
POLYMERASE CHAIN REACTION
10.4.1
CONVENIENCE & COST-EFFECTIVENESS TO FUEL UPTAKE
10.5
ISOTHERMAL NUCLEIC ACID AMPLIFICATION TECHNOLOGY
10.5.1
ENHANCED SUITABILITY FOR POC TESTING WITH LOW-COST FEATURES TO FUEL UPTAKE
10.6
DNA SEQUENCING & NEXT-GENERATION SEQUENCING
10.6.1
ADVANCEMENTS IN SEQUENCING TECHNOLOGIES AND RISING FOCUS ON MOLECULAR TARGETED DRUGS TO PROPEL MARKET
10.7.1
HIGH INSTRUMENT COSTS TO LIMIT MARKET
11
INFECTIOUS DISEASE DIAGNOSTICS MARKET, BY CLINICAL APPLICATION
Market Size & Growth Rate Forecast Analysis to 2030 in USD Million | 15 Data Tables
206
11.2.1
INCREASING CLINICAL NEED FOR CONFIRMATORY TESTING & TIMELY TREATMENT TO DRIVE MARKET
11.3.1
GROWING IMPORTANCE OF EARLY DISEASE DETECTION TO FUEL MARKET
12
INFECTIOUS DISEASE DIAGNOSTICS MARKET, BY END USER
Market Size & Growth Rate Forecast Analysis to 2030 in USD Million | 25 Data Tables
214
12.2
DIAGNOSTIC LABORATORIES
12.2.1
ABILITY TO CATER TO HIGH-END SPECIALTY TESTING TO PROPEL MARKET
12.3.1
IMPROVED REIMBURSEMENTS AND CAPABILITY OF PURCHASING ADVANCED EQUIPMENT TO DRIVE MARKET
12.4
ACADEMIC RESEARCH INSTITUTES
12.4.1
INCREASING R&D FUNDING INVESTMENTS TO FUEL MARKET
13
INFECTIOUS DISEASE DIAGNOSTICS MARKET, BY REGION
Comprehensive coverage of 7 Regions with country-level deep-dive of 16 Countries | 196 Data Tables.
227
13.2.1
NORTH AMERICA: MACROECONOMIC OUTLOOK
13.2.2.1
HIGH HEALTHCARE EXPENDITURE TO DRIVE MARKET
13.2.3.1
SUPPORTIVE GOVERNMENT INITIATIVES FOR INFECTIOUS DISEASE PREVENTION TO FUEL MARKET
13.3.1
EUROPE: MACROECONOMIC OUTLOOK
13.3.2.1
HIGH ADOPTION OF ADVANCED TECHNOLOGIES TO PROPEL MARKET
13.3.3.1
INCREASING NUMBER OF DIAGNOSTIC CENTERS TO FUEL UPTAKE
13.3.4.1
RISING EXPENDITURE ON LIFE SCIENCES R&D TO DRIVE MARKET
13.3.5.1
RISING INCIDENCE OF CHRONIC DISEASES TO BOOST DEMAND
13.3.6.1
HIGH PREVALENCE OF HIV AND CONSOLIDATION OF DIAGNOSTIC LABORATORIES TO DRIVE MARKET
13.4.1
ASIA PACIFIC: MACROECONOMIC OUTLOOK
13.4.2.1
INCREASING BURDEN OF HEPATITIS B VIRUS CASES AND GROWING GOVERNMENT FOCUS ON HEALTH SURVEILLANCE TO DRIVE MARKET
13.4.3.1
PRESENCE OF ESTABLISHED HEALTHCARE SYSTEM AND UNIVERSAL REIMBURSEMENT POLICIES TO FUEL UPTAKE
13.4.4.1
HIGH PREVALENCE OF TB & HIV TO PROPEL MARKET
13.4.5
REST OF ASIA PACIFIC
13.5.1
LATIN AMERICA: MACROECONOMIC OUTLOOK
13.5.2.1
RISING FOCUS ON INITIATING PUBLIC-PRIVATE INVESTMENTS FOR HEALTHCARE IMPROVEMENT TO FUEL UPTAKE
13.5.3.1
IMPROVING ACCESSIBILITY & AFFORDABILITY OF HEALTHCARE SERVICES TO SUPPORT MARKET GROWTH
13.5.4
REST OF LATIN AMERICA
13.6
MIDDLE EAST & AFRICA
13.6.1
MIDDLE EAST & AFRICA: MACROECONOMIC OUTLOOK
13.6.2
KINGDOM OF SAUDI ARABIA (KSA)
13.6.2.1
INTEGRATION OF DIGITAL HEALTH SYSTEMS AND IMPROVEMENTS IN HEALTHCARE INFRASTRUCTURE TO FUEL MARKET
13.6.3
UNITED ARAB EMIRATES (UAE)
13.6.3.1
RISING REQUIREMENT OF HIGH-QUALITY HEALTHCARE SERVICES TO SUPPORT MARKET GROWTH
13.6.4
REST OF MIDDLE EAST & AFRICA
14
COMPETITIVE LANDSCAPE
Discover key players' strategies and market dominance in infectious disease diagnostics.
332
14.2
KEY PLAYER STRATEGIES/RIGHT TO WIN
14.2.1
OVERVIEW OF STRATEGIES DEPLOYED BY PLAYERS IN INFECTIOUS DISEASE DIAGNOSTICS MARKET
14.3
REVENUE SHARE ANALYSIS, 2022−2024
14.4
MARKET SHARE ANALYSIS, 2024
14.5
COMPANY EVALUATION MATRIX: KEY PLAYERS, 2024
14.5.5
COMPANY FOOTPRINT: KEY PLAYERS, 2024
14.5.5.1
COMPANY FOOTPRINT
14.5.5.2
REGION FOOTPRINT
14.5.5.3
PRODUCT & SERVICE FOOTPRINT
14.5.5.4
TYPE OF TESTING FOOTPRINT
14.5.5.5
SAMPLE TYPE FOOTPRINT
14.6
COMPANY EVALUATION MATRIX: STARTUPS/SMES, 2024
14.6.1
PROGRESSIVE COMPANIES
14.6.2
RESPONSIVE COMPANIES
14.6.5
COMPANY EVALUATION MATRIX: STARTUPS/SMES, 2024
14.6.5.1
DETAILED LIST OF KEY STARTUPS/SMES
14.6.5.2
COMPETITIVE BENCHMARKING OF STARTUPS/SMES (1/2)
14.6.5.3
COMPETITIVE BENCHMARKING OF STARTUPS/SMES (2/2)
14.7
COMPANY VALUATION & FINANCIAL METRICS
14.8
BRAND/PRODUCT COMPARISON
14.8.1
BRAND/PRODUCT COMPARATIVE ANALYSIS
14.9
COMPETITIVE SCENARIO
14.9.1
PRODUCT/SERVICES LAUNCHES & APPROVALS
15
COMPANY PROFILES
In-depth Company Profiles of Leading Market Players with detailed Business Overview, Product and Service Portfolio, Recent Developments, and Unique Analyst Perspective (MnM View)
349
15.1.1
F. HOFFMANN-LA ROCHE LTD.
15.1.1.1
BUSINESS OVERVIEW
15.1.1.2
PRODUCTS/SERVICES OFFERED
15.1.1.3
RECENT DEVELOPMENTS
15.1.3
DANAHER CORPORATION
15.1.5
THERMO FISHER SCIENTIFIC INC.
15.1.6
SIEMENS HEALTHINEERS AG
15.1.8
BECTON, DICKINSON AND COMPANY (BD)
15.2.1
QUIDELORTHO CORPORATION
15.2.4
BIO-RAD LABORATORIES, INC.
15.2.5
SYSMEX CORPORATION
15.2.6
ORASURE TECHNOLOGIES, INC.
15.2.7
CO-DIAGNOSTICS, INC.
15.2.8
SD BIOSENSOR, INC.
15.2.11
BRUKER (ELITECHGROUP)
15.2.12
GENETIC SIGNATURES
15.2.13
EPITOPE DIAGNOSTICS, INC.
15.2.14
TRIVITRON HEALTHCARE
15.2.15
MERIL LIFE SCIENCES PVT. LTD.
15.2.16
INBIOS INTERNATIONAL, INC.
15.2.19
MOLBIO DIAGNOSTICS LIMITED
16.2
KNOWLEDGESTORE: MARKETSANDMARKETS’ SUBSCRIPTION PORTAL
16.3
CUSTOMIZATION OPTIONS
TABLE 1
INFECTIOUS DISEASE DIAGNOSTICS MARKET: INCLUSIONS & EXCLUSIONS
TABLE 2
INFECTIOUS DISEASE DIAGNOSTICS MARKET: KEY DATA FROM PRIMARY SOURCES
TABLE 3
INFECTIOUS DISEASE DIAGNOSTICS MARKET: RISK ASSESSMENT ANALYSIS
TABLE 4
REGIONAL HIV DATA, 2024
TABLE 5
INDICATIVE SELLING PRICING TREND OF INFECTIOUS DISEASE DIAGNOSTIC PRODUCTS, 2023–2025
TABLE 6
INDICATIVE SELLING PRICE TREND OF INFECTIOUS DISEASE TEST KITS & ASSAYS, BY KEY PLAYER, 2023–2025
TABLE 7
INDICATIVE SELLING PRICE TREND OF INFECTIOUS DISEASE DIAGNOSTIC PRODUCTS, BY REGION, 2023–2025
TABLE 8
INFECTIOUS DISEASE DIAGNOSTICS MARKET: LIST OF MAJOR PATENTS
TABLE 9
IMPORT DATA FOR DIAGNOSTIC & LABORATORY REAGENTS (HS CODE 3822), BY COUNTRY, 2020–2024 (USD MILLION)
TABLE 10
EXPORT DATA FOR DIAGNOSTIC & LABORATORY REAGENTS (HS CODE 3822), BY COUNTRY, 2020–2024 (USD MILLION)
TABLE 11
INFECTIOUS DISEASE DIAGNOSTICS MARKET: ROLE IN ECOSYSTEM
TABLE 12
INFECTIOUS DISEASE DIAGNOSTICS MARKET: PORTER’S FIVE FORCES ANALYSIS
TABLE 13
CLASSIFICATION OF IVD DEVICES IN EUROPE
TABLE 14
TIME, COST, AND COMPLEXITY OF REGISTRATION PROCESS IN JAPAN
TABLE 17
ASIA PACIFIC: LIST OF KEY REGULATORY BODIES, GOVERNMENT AGENCIES, AND OTHER ORGANIZATIONS
TABLE 20
INFECTIOUS DISEASE DIAGNOSTICS MARKET: DETAILED LIST OF KEY CONFERENCES & EVENTS, JANUARY 2025–DECEMBER 2026
TABLE 21
INFLUENCE OF STAKEHOLDERS ON BUYING PROCESS FOR INFECTIOUS DISEASE DIAGNOSTIC PRODUCTS (%)
TABLE 22
KEY BUYING CRITERIA FOR INFECTIOUS DISEASE DIAGNOSTIC PRODUCTS, BY RANK
TABLE 23
IMPLEMENTATION OF AI, BY KEY COMPANY & CASE
TABLE 24
US-ADJUSTED RECIPROCAL TARIFF RATES
TABLE 25
INFECTIOUS DISEASE DIAGNOSTICS MARKET, BY PRODUCT & SERVICE, 2023–2030 (USD MILLION)T
TABLE 26
KEY REAGENTS, KITS, AND CONSUMABLES CURRENTLY AVAILABLE
TABLE 27
INFECTIOUS DISEASE DIAGNOSTICS MARKET FOR REAGENTS, KITS, AND CONSUMABLES, BY REGION, 2023–2030 (USD MILLION)
TABLE 28
NORTH AMERICA: INFECTIOUS DISEASE DIAGNOSTICS MARKET FOR REAGENTS, KITS, AND CONSUMABLES, BY COUNTRY, 2023–2030 (USD MILLION)
TABLE 29
EUROPE: INFECTIOUS DISEASE DIAGNOSTICS MARKET FOR REAGENTS, KITS, AND CONSUMABLES, BY COUNTRY, 2023–2030 (USD MILLION)
TABLE 30
ASIA PACIFIC: INFECTIOUS DISEASE DIAGNOSTICS MARKET FOR REAGENTS, KITS, AND CONSUMABLES, BY COUNTRY, 2023–2030 (USD MILLION)
TABLE 31
LATIN AMERICA: INFECTIOUS DISEASE DIAGNOSTICS MARKET FOR REAGENTS, KITS, AND CONSUMABLES, BY COUNTRY, 2023–2030 (USD MILLION)
TABLE 32
MIDDLE EAST & AFRICA: INFECTIOUS DISEASE DIAGNOSTICS MARKET FOR REAGENTS, KITS, AND CONSUMABLES, BY COUNTRY, 2023–2030 (USD MILLION)
TABLE 33
KEY INSTRUMENTS CURRENTLY AVAILABLE
TABLE 34
INFECTIOUS DISEASE DIAGNOSTICS MARKET FOR INSTRUMENTS, BY REGION, 2023–2030 (USD MILLION)
TABLE 35
NORTH AMERICA: INFECTIOUS DISEASE DIAGNOSTICS MARKET FOR INSTRUMENTS, BY COUNTRY, 2023–2030 (USD MILLION)
TABLE 36
EUROPE: INFECTIOUS DISEASE DIAGNOSTICS MARKET FOR INSTRUMENTS, BY COUNTRY, 2023–2030 (USD MILLION)
TABLE 37
ASIA PACIFIC: INFECTIOUS DISEASE DIAGNOSTICS MARKET FOR INSTRUMENTS, BY COUNTRY, 2023–2030 (USD MILLION)
TABLE 38
LATIN AMERICA: INFECTIOUS DISEASE DIAGNOSTICS MARKET FOR INSTRUMENTS, BY COUNTRY, 2023–2030 (USD MILLION)
TABLE 39
MIDDLE EAST & AFRICA: INFECTIOUS DISEASE DIAGNOSTICS MARKET FOR INSTRUMENTS, BY COUNTRY, 2023–2030 (USD MILLION)
TABLE 40
KEY SOFTWARE & SERVICES CURRENTLY AVAILABLE
TABLE 41
INFECTIOUS DISEASE DIAGNOSTICS MARKET FOR SOFTWARE & SERVICES, BY REGION, 2023–2030 (USD MILLION)
TABLE 42
NORTH AMERICA: INFECTIOUS DISEASE DIAGNOSTICS MARKET FOR SOFTWARE & SERVICES, BY COUNTRY, 2023–2030 (USD MILLION)
TABLE 43
EUROPE: INFECTIOUS DISEASE DIAGNOSTICS MARKET FOR SOFTWARE & SERVICES, BY COUNTRY, 2023–2030 (USD MILLION)
TABLE 44
ASIA PACIFIC: INFECTIOUS DISEASE DIAGNOSTICS MARKET FOR SOFTWARE & SERVICES, BY COUNTRY, 2023–2030 (USD MILLION)
TABLE 45
LATIN AMERICA: INFECTIOUS DISEASE DIAGNOSTICS MARKET FOR SOFTWARE & SERVICES, BY COUNTRY, 2023–2030 (USD MILLION)
TABLE 46
MIDDLE EAST & AFRICA: INFECTIOUS DISEASE DIAGNOSTICS MARKET FOR SOFTWARE & SERVICES, BY COUNTRY, 2023–2030 (USD MILLION)
TABLE 47
INFECTIOUS DISEASE DIAGNOSTICS MARKET, BY TYPE OF TESTING, 2023–2030 (USD MILLION)
TABLE 48
KEY LABORATORY TEST TYPES CURRENTLY AVAILABLE
TABLE 49
INFECTIOUS DISEASE DIAGNOSTICS MARKET FOR LABORATORY TESTING, BY REGION, 2023–2030 (USD MILLION)
TABLE 50
NORTH AMERICA: INFECTIOUS DISEASE DIAGNOSTICS MARKET FOR LABORATORY TESTING, BY COUNTRY, 2023–2030 (USD MILLION)
TABLE 51
EUROPE: INFECTIOUS DISEASE DIAGNOSTICS MARKET FOR LABORATORY TESTING, BY COUNTRY, 2023–2030 (USD MILLION)
TABLE 52
ASIA PACIFIC: INFECTIOUS DISEASE DIAGNOSTICS MARKET FOR LABORATORY TESTING, BY COUNTRY, 2023–2030 (USD MILLION)
TABLE 53
LATIN AMERICA: INFECTIOUS DISEASE DIAGNOSTICS MARKET FOR LABORATORY TESTING, BY COUNTRY, 2023–2030 (USD MILLION)
TABLE 54
MIDDLE EAST & AFRICA: INFECTIOUS DISEASE DIAGNOSTICS MARKET FOR LABORATORY TESTING, BY COUNTRY, 2023–2030 (USD MILLION)
TABLE 55
KEY POC TESTING TYPES CURRENTLY AVAILABLE
TABLE 56
INFECTIOUS DISEASE DIAGNOSTICS MARKET FOR POC TESTING, BY REGION, 2023–2030 (USD MILLION)
TABLE 57
NORTH AMERICA: INFECTIOUS DISEASE DIAGNOSTICS MARKET FOR POC TESTING, BY COUNTRY, 2023–2030 (USD MILLION)
TABLE 58
EUROPE: INFECTIOUS DISEASE DIAGNOSTICS MARKET FOR POC TESTING, BY COUNTRY, 2023–2030 (USD MILLION)
TABLE 59
ASIA PACIFIC: INFECTIOUS DISEASE DIAGNOSTICS MARKET FOR POC TESTING, BY COUNTRY, 2023–2030 (USD MILLION)
TABLE 60
LATIN AMERICA: INFECTIOUS DISEASE DIAGNOSTICS MARKET FOR POC TESTING, BY COUNTRY, 2023–2030 (USD MILLION)
TABLE 61
MIDDLE EAST & AFRICA: INFECTIOUS DISEASE DIAGNOSTICS MARKET FOR POC TESTING, BY COUNTRY, 2023–2030 (USD MILLION)
TABLE 62
INFECTIOUS DISEASE DIAGNOSTICS MARKET, BY SAMPLE TYPE, 2023–2030 (USD MILLION)
TABLE 63
INFECTIOUS DISEASE DIAGNOSTICS MARKET FOR BLOOD, SERUM, AND PLASMA SAMPLES, BY REGION, 2023–2030 (USD MILLION)
TABLE 64
NORTH AMERICA: INFECTIOUS DISEASE DIAGNOSTICS MARKET FOR BLOOD, SERUM, AND PLASMA SAMPLES, BY COUNTRY, 2023–2030 (USD MILLION)
TABLE 65
EUROPE: INFECTIOUS DISEASE DIAGNOSTICS MARKET FOR BLOOD, SERUM, AND PLASMA SAMPLES, BY COUNTRY, 2023–2030 (USD MILLION)
TABLE 66
ASIA PACIFIC: INFECTIOUS DISEASE DIAGNOSTICS MARKET FOR BLOOD, SERUM, AND PLASMA SAMPLES, BY COUNTRY, 2023–2030 (USD MILLION)
TABLE 67
LATIN AMERICA: INFECTIOUS DISEASE DIAGNOSTICS MARKET FOR BLOOD, SERUM, AND PLASMA SAMPLES, BY COUNTRY, 2023–2030 (USD MILLION)
TABLE 68
MIDDLE EAST & AFRICA: INFECTIOUS DISEASE DIAGNOSTICS MARKET FOR BLOOD, SERUM, AND PLASMA SAMPLES, BY COUNTRY, 2023–2030 (USD MILLION)
TABLE 69
INFECTIOUS DISEASE DIAGNOSTICS MARKET FOR URINE SAMPLES, BY REGION, 2023–2030 (USD MILLION)
TABLE 70
NORTH AMERICA: INFECTIOUS DISEASE DIAGNOSTICS MARKET FOR URINE SAMPLES, BY COUNTRY, 2023–2030 (USD MILLION)
TABLE 71
EUROPE: INFECTIOUS DISEASE DIAGNOSTICS MARKET FOR URINE SAMPLES, BY COUNTRY, 2023–2030 (USD MILLION)
TABLE 72
ASIA PACIFIC: INFECTIOUS DISEASE DIAGNOSTICS MARKET FOR URINE SAMPLES, BY COUNTRY, 2023–2030 (USD MILLION)
TABLE 73
LATIN AMERICA: INFECTIOUS DISEASE DIAGNOSTICS MARKET FOR URINE SAMPLES, BY COUNTRY, 2023–2030 (USD MILLION)
TABLE 74
MIDDLE EAST & AFRICA: INFECTIOUS DISEASE DIAGNOSTICS MARKET FOR URINE SAMPLES, BY COUNTRY, 2023–2030 (USD MILLION)
TABLE 75
INFECTIOUS DISEASE DIAGNOSTICS MARKET FOR OTHER SAMPLE TYPES, BY REGION, 2023–2030 (USD MILLION)
TABLE 76
NORTH AMERICA: INFECTIOUS DISEASE DIAGNOSTICS MARKET FOR OTHER SAMPLE TYPES, BY COUNTRY, 2023–2030 (USD MILLION)
TABLE 77
EUROPE: INFECTIOUS DISEASE DIAGNOSTICS MARKET FOR OTHER SAMPLE TYPES, BY COUNTRY, 2023–2030 (USD MILLION)
TABLE 78
ASIA PACIFIC: INFECTIOUS DISEASE DIAGNOSTICS MARKET FOR OTHER SAMPLE TYPES, BY COUNTRY, 2023–2030 (USD MILLION)
TABLE 79
LATIN AMERICA: INFECTIOUS DISEASE DIAGNOSTICS MARKET FOR OTHER SAMPLE TYPES, BY COUNTRY, 2023–2030 (USD MILLION)
TABLE 80
MIDDLE EAST & AFRICA: INFECTIOUS DISEASE DIAGNOSTICS MARKET FOR OTHER SAMPLE TYPES, BY COUNTRY, 2023–2030 (USD MILLION)
TABLE 81
INFECTIOUS DISEASE DIAGNOSTICS MARKET, BY DISEASE TYPE, 2023–2030 (USD MILLION)
TABLE 82
KEY HEPATITIS TESTING PRODUCTS CURRENTLY AVAILABLE
TABLE 83
INFECTIOUS DISEASE DIAGNOSTICS MARKET FOR HEPATITIS, BY REGION, 2023–2030 (USD MILLION)
TABLE 84
NORTH AMERICA: INFECTIOUS DISEASE DIAGNOSTICS MARKET FOR HEPATITIS, BY COUNTRY, 2023–2030 (USD MILLION)
TABLE 85
EUROPE: INFECTIOUS DISEASE DIAGNOSTICS MARKET FOR HEPATITIS, BY COUNTRY, 2023–2030 (USD MILLION)
TABLE 86
ASIA PACIFIC: INFECTIOUS DISEASE DIAGNOSTICS MARKET FOR HEPATITIS, BY COUNTRY, 2023–2030 (USD MILLION)
TABLE 87
LATIN AMERICA: INFECTIOUS DISEASE DIAGNOSTICS MARKET FOR HEPATITIS, BY COUNTRY, 2023–2030 (USD MILLION)
TABLE 88
MIDDLE EAST & AFRICA: INFECTIOUS DISEASE DIAGNOSTICS MARKET FOR HEPATITIS, BY COUNTRY, 2023–2030 (USD MILLION)
TABLE 89
INFECTIOUS DISEASE DIAGNOSTICS MARKET FOR HEPATITIS, BY TYPE, 2023–2030 (USD MILLION)
TABLE 90
INFECTIOUS DISEASE DIAGNOSTICS MARKET FOR HEPATITIS B, BY REGION, 2023–2030 (USD MILLION)
TABLE 91
NORTH AMERICA: INFECTIOUS DISEASE DIAGNOSTICS MARKET FOR HEPATITIS B, BY COUNTRY, 2023–2030 (USD MILLION)
TABLE 92
EUROPE: INFECTIOUS DISEASE DIAGNOSTICS MARKET FOR HEPATITIS B, BY COUNTRY, 2023–2030 (USD MILLION)
TABLE 93
ASIA PACIFIC: INFECTIOUS DISEASE DIAGNOSTICS MARKET FOR HEPATITIS B, BY COUNTRY, 2023–2030 (USD MILLION)
TABLE 94
LATIN AMERICA: INFECTIOUS DISEASE DIAGNOSTICS MARKET FOR HEPATITIS B, BY COUNTRY, 2023–2030 (USD MILLION)
TABLE 95
MIDDLE EAST & AFRICA: INFECTIOUS DISEASE DIAGNOSTICS MARKET FOR HEPATITIS B, BY COUNTRY, 2023–2030 (USD MILLION)
TABLE 96
INFECTIOUS DISEASE DIAGNOSTICS MARKET FOR HEPATITIS C, BY REGION, 2023–2030 (USD MILLION)
TABLE 97
NORTH AMERICA: INFECTIOUS DISEASE DIAGNOSTICS MARKET FOR HEPATITIS C, BY COUNTRY, 2023–2030 (USD MILLION)
TABLE 98
EUROPE: INFECTIOUS DISEASE DIAGNOSTICS MARKET FOR HEPATITIS C, BY COUNTRY, 2023–2030 (USD MILLION)
TABLE 99
ASIA PACIFIC: INFECTIOUS DISEASE DIAGNOSTICS MARKET FOR HEPATITIS C, BY COUNTRY, 2023–2030 (USD MILLION)
TABLE 100
LATIN AMERICA: INFECTIOUS DISEASE DIAGNOSTICS MARKET FOR HEPATITIS C, BY COUNTRY, 2023–2030 (USD MILLION)
TABLE 101
MIDDLE EAST & AFRICA: INFECTIOUS DISEASE DIAGNOSTICS MARKET FOR HEPATITIS C, BY COUNTRY, 2023–2030 (USD MILLION)
TABLE 102
INFECTIOUS DISEASE DIAGNOSTICS MARKET FOR OTHER HEPATITIS DISEASES, BY REGION, 2023–2030 (USD MILLION)
TABLE 103
NORTH AMERICA: INFECTIOUS DISEASE DIAGNOSTICS MARKET FOR OTHER HEPATITIS DISEASES, BY COUNTRY, 2023–2030 (USD MILLION)
TABLE 104
EUROPE: INFECTIOUS DISEASE DIAGNOSTICS MARKET FOR OTHER HEPATITIS DISEASES, BY COUNTRY, 2023–2030 (USD MILLION)
TABLE 105
ASIA PACIFIC: INFECTIOUS DISEASE DIAGNOSTICS MARKET FOR OTHER HEPATITIS DISEASES, BY COUNTRY, 2023–2030 (USD MILLION)
TABLE 106
LATIN AMERICA: INFECTIOUS DISEASE DIAGNOSTICS MARKET FOR OTHER HEPATITIS DISEASES, BY COUNTRY, 2023–2030 (USD MILLION)
TABLE 107
MIDDLE EAST & AFRICA: INFECTIOUS DISEASE DIAGNOSTICS MARKET FOR OTHER HEPATITIS DISEASES, BY COUNTRY, 2023–2030 (USD MILLION)
TABLE 108
KEY HIV TESTING PRODUCTS CURRENTLY AVAILABLE
TABLE 109
INFECTIOUS DISEASE DIAGNOSTICS MARKET FOR HIV, BY REGION, 2023–2030 (USD MILLION)
TABLE 110
NORTH AMERICA: INFECTIOUS DISEASE DIAGNOSTICS MARKET FOR HIV, BY COUNTRY, 2023–2030 (USD MILLION)
TABLE 111
EUROPE: INFECTIOUS DISEASE DIAGNOSTICS MARKET FOR HIV, BY COUNTRY, 2023–2030 (USD MILLION)
TABLE 112
ASIA PACIFIC: INFECTIOUS DISEASE DIAGNOSTICS MARKET FOR HIV, BY COUNTRY, 2023–2030 (USD MILLION)
TABLE 113
LATIN AMERICA: INFECTIOUS DISEASE DIAGNOSTICS MARKET FOR HIV, BY COUNTRY, 2023–2030 (USD MILLION)
TABLE 114
MIDDLE EAST & AFRICA: INFECTIOUS DISEASE DIAGNOSTICS MARKET FOR HIV, BY COUNTRY, 2023–2030 (USD MILLION)
TABLE 115
KEY HAI TESTING PRODUCTS CURRENTLY AVAILABLE
TABLE 116
INFECTIOUS DISEASE DIAGNOSTICS MARKET FOR HOSPITAL-ACQUIRED INFECTIONS, BY REGION, 2023–2030 (USD MILLION)
TABLE 117
NORTH AMERICA: INFECTIOUS DISEASE DIAGNOSTICS MARKET FOR HOSPITAL-ACQUIRED INFECTIONS, BY COUNTRY, 2023–2030 (USD MILLION)
TABLE 118
EUROPE: INFECTIOUS DISEASE DIAGNOSTICS MARKET FOR HOSPITAL-ACQUIRED INFECTIONS, BY COUNTRY, 2023–2030 (USD MILLION)
TABLE 119
ASIA PACIFIC: INFECTIOUS DISEASE DIAGNOSTICS MARKET FOR HOSPITAL-ACQUIRED INFECTIONS, BY COUNTRY, 2023–2030 (USD MILLION)
TABLE 120
LATIN AMERICA: INFECTIOUS DISEASE DIAGNOSTICS MARKET FOR HOSPITAL-ACQUIRED INFECTIONS, BY COUNTRY, 2023–2030 (USD MILLION)
TABLE 121
MIDDLE EAST & AFRICA: INFECTIOUS DISEASE DIAGNOSTICS MARKET FOR HOSPITAL-ACQUIRED INFECTIONS, BY COUNTRY, 2023–2030 (USD MILLION)
TABLE 122
KEY DENGUE-TESTING PRODUCTS CURRENTLY AVAILABLE
TABLE 123
INFECTIOUS DISEASE DIAGNOSTICS MARKET FOR MOSQUITO-BORNE DISEASES, BY REGION, 2023–2030 (USD MILLION)
TABLE 124
NORTH AMERICA: INFECTIOUS DISEASE DIAGNOSTICS MARKET FOR MOSQUITO-BORNE DISEASES, BY COUNTRY, 2023–2030 (USD MILLION)
TABLE 125
EUROPE: INFECTIOUS DISEASE DIAGNOSTICS MARKET FOR MOSQUITO-BORNE DISEASES, 2023–2030 (USD MILLION)
TABLE 126
ASIA PACIFIC: INFECTIOUS DISEASE DIAGNOSTICS MARKET FOR MOSQUITO-BORNE DISEASES, BY COUNTRY, 2023–2030 (USD MILLION)
TABLE 127
LATIN AMERICA: INFECTIOUS DISEASE DIAGNOSTICS MARKET FOR MOSQUITO-BORNE DISEASES, BY COUNTRY, 2023–2030 (USD MILLION)
TABLE 128
MIDDLE EAST & AFRICA: INFECTIOUS DISEASE DIAGNOSTICS MARKET FOR MOSQUITO-BORNE DISEASES, BY COUNTRY, 2023–2030 (USD MILLION)
TABLE 129
KEY HPV TESTING PRODUCTS CURRENTLY AVAILABLE
TABLE 130
INFECTIOUS DISEASE DIAGNOSTICS MARKET FOR HPV, BY REGION, 2023–2030 (USD MILLION)
TABLE 131
NORTH AMERICA: INFECTIOUS DISEASE DIAGNOSTICS MARKET FOR HPV, BY COUNTRY, 2023–2030 (USD MILLION)
TABLE 132
EUROPE: INFECTIOUS DISEASE DIAGNOSTICS MARKET FOR HPV, BY COUNTRY, 2023–2030 (USD MILLION)
TABLE 133
ASIA PACIFIC: INFECTIOUS DISEASE DIAGNOSTICS MARKET FOR HPV, BY COUNTRY, 2023–2030 (USD MILLION)
TABLE 134
LATIN AMERICA: INFECTIOUS DISEASE DIAGNOSTICS MARKET FOR HPV, BY COUNTRY, 2023–2030 (USD MILLION)
TABLE 135
MIDDLE EAST & AFRICA: INFECTIOUS DISEASE DIAGNOSTICS MARKET FOR HPV, BY COUNTRY, 2023–2030 (USD MILLION)
TABLE 136
KEY CHLAMYDIA TRACHOMATIS TESTING PRODUCTS CURRENTLY AVAILABLE
TABLE 137
INFECTIOUS DISEASE DIAGNOSTICS MARKET FOR CHLAMYDIA TRACHOMATIS, BY REGION, 2023–2030 (USD MILLION)
TABLE 138
NORTH AMERICA: INFECTIOUS DISEASE DIAGNOSTICS MARKET FOR CHLAMYDIA TRACHOMATIS, BY COUNTRY, 2023–2030 (USD MILLION)
TABLE 139
EUROPE: INFECTIOUS DISEASE DIAGNOSTICS MARKET FOR CHLAMYDIA TRACHOMATIS, BY COUNTRY, 2023–2030 (USD MILLION)
TABLE 140
ASIA PACIFIC: INFECTIOUS DISEASE DIAGNOSTICS MARKET FOR CHLAMYDIA TRACHOMATIS, BY COUNTRY, 2023–2030 (USD MILLION)
TABLE 141
LATIN AMERICA: INFECTIOUS DISEASE DIAGNOSTICS MARKET FOR CHLAMYDIA TRACHOMATIS, BY COUNTRY, 2023–2030 (USD MILLION)
TABLE 142
MIDDLE EAST & AFRICA: INFECTIOUS DISEASE DIAGNOSTICS MARKET FOR CHLAMYDIA TRACHOMATIS, BY COUNTRY, 2023–2030 (USD MILLION)
TABLE 143
INFECTIOUS DISEASE DIAGNOSTICS MARKET FOR NEISSERIA GONORRHOEAE, BY REGION, 2023–2030 (USD MILLION)
TABLE 144
NORTH AMERICA: INFECTIOUS DISEASE DIAGNOSTICS MARKET FOR NEISSERIA GONORRHOEAE, BY COUNTRY, 2023–2030 (USD MILLION)
TABLE 145
EUROPE: INFECTIOUS DISEASE DIAGNOSTICS MARKET FOR NEISSERIA GONORRHOEAE, BY COUNTRY, 2023–2030 (USD MILLION)
TABLE 146
ASIA PACIFIC: INFECTIOUS DISEASE DIAGNOSTICS MARKET FOR NEISSERIA GONORRHOEAE, BY COUNTRY, 2023–2030 (USD MILLION)
TABLE 147
LATIN AMERICA: INFECTIOUS DISEASE DIAGNOSTICS MARKET FOR NEISSERIA GONORRHOEAE, BY COUNTRY, 2023–2030 (USD MILLION)
TABLE 148
MIDDLE EAST & AFRICA: INFECTIOUS DISEASE DIAGNOSTICS MARKET FOR NEISSERIA GONORRHOEAE, BY COUNTRY, 2023–2030 (USD MILLION)
TABLE 149
KEY TUBERCULOSIS TESTING PRODUCTS CURRENTLY AVAILABLE
TABLE 150
GLOBAL NUMBER OF NEWLY DIAGNOSED TUBERCULOSIS (TB) CASES, 2023–2030 (IN MILLIONS)
TABLE 151
INFECTIOUS DISEASE DIAGNOSTICS MARKET FOR TUBERCULOSIS, BY REGION, 2023–2030 (USD MILLION)
TABLE 152
NORTH AMERICA: INFECTIOUS DISEASE DIAGNOSTICS MARKET FOR TUBERCULOSIS, BY COUNTRY, 2023–2030 (USD MILLION)
TABLE 153
EUROPE: INFECTIOUS DISEASE DIAGNOSTICS MARKET FOR TUBERCULOSIS, BY COUNTRY, 2023–2030 (USD MILLION)
TABLE 154
ASIA PACIFIC: INFECTIOUS DISEASE DIAGNOSTICS MARKET FOR TUBERCULOSIS, BY COUNTRY, 2023–2030 (USD MILLION)
TABLE 155
LATIN AMERICA: INFECTIOUS DISEASE DIAGNOSTICS MARKET FOR TUBERCULOSIS, BY COUNTRY, 2023–2030 (USD MILLION)
TABLE 156
MIDDLE EAST & AFRICA: INFECTIOUS DISEASE DIAGNOSTICS MARKET FOR TUBERCULOSIS, BY COUNTRY, 2023–2030 (USD MILLION)
TABLE 157
KEY INFLUENZA TESTING PRODUCTS CURRENTLY AVAILABLE
TABLE 158
INFECTIOUS DISEASE DIAGNOSTICS MARKET FOR INFLUENZA, BY REGION, 2023–2030 (USD MILLION)
TABLE 159
NORTH AMERICA: INFECTIOUS DISEASE DIAGNOSTICS MARKET FOR INFLUENZA, BY COUNTRY, 2023–2030 (USD MILLION)
TABLE 160
EUROPE: INFECTIOUS DISEASE DIAGNOSTICS MARKET FOR INFLUENZA, BY COUNTRY, 2023–2030 (USD MILLION)
TABLE 161
ASIA PACIFIC: INFECTIOUS DISEASE DIAGNOSTICS MARKET FOR INFLUENZA, BY COUNTRY, 2023–2030 (USD MILLION)
TABLE 162
LATIN AMERICA: INFECTIOUS DISEASE DIAGNOSTICS MARKET FOR INFLUENZA, BY COUNTRY, 2023–2030 (USD MILLION)
TABLE 163
MIDDLE EAST & AFRICA: INFECTIOUS DISEASE DIAGNOSTICS MARKET FOR INFLUENZA, BY COUNTRY, 2023–2030 (USD MILLION)
TABLE 164
KEY SYPHILIS TESTING PRODUCTS CURRENTLY AVAILABLE
TABLE 165
INFECTIOUS DISEASE DIAGNOSTICS MARKET FOR SYPHILIS, BY REGION, 2023–2030 (USD MILLION)
TABLE 166
NORTH AMERICA: INFECTIOUS DISEASE DIAGNOSTICS MARKET FOR SYPHILIS, BY COUNTRY, 2023–2030 (USD MILLION)
TABLE 167
EUROPE: INFECTIOUS DISEASE DIAGNOSTICS MARKET FOR SYPHILIS, BY COUNTRY, 2023–2030 (USD MILLION)
TABLE 168
ASIA PACIFIC: INFECTIOUS DISEASE DIAGNOSTICS MARKET FOR SYPHILIS, BY COUNTRY, 2023–2030 (USD MILLION)
TABLE 169
LATIN AMERICA: INFECTIOUS DISEASE DIAGNOSTICS MARKET FOR SYPHILIS, BY COUNTRY, 2023–2030 (USD MILLION)
TABLE 170
MIDDLE EAST & AFRICA: INFECTIOUS DISEASE DIAGNOSTICS MARKET FOR SYPHILIS, BY COUNTRY, 2023–2030 (USD MILLION)
TABLE 171
INFECTIOUS DISEASE DIAGNOSTICS MARKET FOR OTHER INFECTIOUS DISEASES, BY REGION, 2023–2030 (USD MILLION)
TABLE 172
NORTH AMERICA: INFECTIOUS DISEASE DIAGNOSTICS MARKET FOR OTHER INFECTIOUS DISEASES, BY COUNTRY, 2023–2030 (USD MILLION)
TABLE 173
EUROPE: INFECTIOUS DISEASE DIAGNOSTICS MARKET FOR OTHER INFECTIOUS DISEASES, BY COUNTRY, 2023–2030 (USD MILLION)
TABLE 174
ASIA PACIFIC: INFECTIOUS DISEASE DIAGNOSTICS MARKET FOR OTHER INFECTIOUS DISEASES, BY COUNTRY, 2023–2030 (USD MILLION)
TABLE 175
LATIN AMERICA: INFECTIOUS DISEASE DIAGNOSTICS MARKET FOR OTHER INFECTIOUS DISEASES, BY COUNTRY, 2023–2030 (USD MILLION)
TABLE 176
MIDDLE EAST & AFRICA: INFECTIOUS DISEASE DIAGNOSTICS MARKET FOR OTHER INFECTIOUS DISEASES, BY COUNTRY, 2023–2030 (USD MILLION)
TABLE 177
INFECTIOUS DISEASE DIAGNOSTICS MARKET, BY TECHNOLOGY, 2023–2030 (USD MILLION)
TABLE 178
KEY IMMUNODIAGNOSTICS-BASED PRODUCTS CURRENTLY AVAILABLE
TABLE 179
INFECTIOUS DISEASE DIAGNOSTICS MARKET FOR IMMUNODIAGNOSTICS, BY REGION, 2023–2030 (USD MILLION)
TABLE 180
NORTH AMERICA: INFECTIOUS DISEASE DIAGNOSTICS MARKET FOR IMMUNODIAGNOSTICS, BY COUNTRY, 2023–2030 (USD MILLION)
TABLE 181
EUROPE: INFECTIOUS DISEASE DIAGNOSTICS MARKET FOR IMMUNODIAGNOSTICS, BY COUNTRY, 2023–2030 (USD MILLION)
TABLE 182
ASIA PACIFIC: INFECTIOUS DISEASE DIAGNOSTICS MARKET FOR IMMUNODIAGNOSTICS, BY COUNTRY, 2023–2030 (USD MILLION)
TABLE 183
LATIN AMERICA: INFECTIOUS DISEASE DIAGNOSTICS MARKET FOR IMMUNODIAGNOSTICS, BY COUNTRY, 2023–2030 (USD MILLION)
TABLE 184
MIDDLE EAST & AFRICA: INFECTIOUS DISEASE DIAGNOSTICS MARKET FOR IMMUNODIAGNOSTICS, BY COUNTRY, 2023–2030 (USD MILLION)
TABLE 185
KEY CLINICAL MICROBIOLOGY-BASED PRODUCTS CURRENTLY AVAILABLE
TABLE 186
INFECTIOUS DISEASE DIAGNOSTICS MARKET FOR CLINICAL MICROBIOLOGY, BY REGION, 2023–2030 (USD MILLION)
TABLE 187
NORTH AMERICA: INFECTIOUS DISEASE DIAGNOSTICS MARKET FOR CLINICAL MICROBIOLOGY, BY COUNTRY, 2023–2030 (USD MILLION)
TABLE 188
EUROPE: INFECTIOUS DISEASE DIAGNOSTICS MARKET FOR CLINICAL MICROBIOLOGY, BY COUNTRY, 2023–2030 (USD MILLION)
TABLE 189
ASIA PACIFIC: INFECTIOUS DISEASE DIAGNOSTICS MARKET FOR CLINICAL MICROBIOLOGY, BY COUNTRY, 2023–2030 (USD MILLION)
TABLE 190
LATIN AMERICA: INFECTIOUS DISEASE DIAGNOSTICS MARKET FOR CLINICAL MICROBIOLOGY, BY COUNTRY, 2023–2030 (USD MILLION)
TABLE 191
MIDDLE EAST & AFRICA: INFECTIOUS DISEASE DIAGNOSTICS MARKET FOR CLINICAL MICROBIOLOGY, BY COUNTRY, 2023–2030 (USD MILLION)
TABLE 192
KEY POLYMERASE CHAIN REACTION-BASED PRODUCTS CURRENTLY AVAILABLE
TABLE 193
INFECTIOUS DISEASE DIAGNOSTICS MARKET FOR POLYMERASE CHAIN REACTION, BY REGION, 2023–2030 (USD MILLION)
TABLE 194
NORTH AMERICA: INFECTIOUS DISEASE DIAGNOSTICS MARKET FOR POLYMERASE CHAIN REACTION, BY COUNTRY, 2023–2030 (USD MILLION)
TABLE 195
EUROPE: INFECTIOUS DISEASE DIAGNOSTICS MARKET FOR POLYMERASE CHAIN REACTION, BY COUNTRY, 2023–2030 (USD MILLION)
TABLE 196
ASIA PACIFIC: INFECTIOUS DISEASE DIAGNOSTICS MARKET FOR POLYMERASE CHAIN REACTION, BY COUNTRY, 2023–2030 (USD MILLION)
TABLE 197
LATIN AMERICA: INFECTIOUS DISEASE DIAGNOSTICS MARKET FOR POLYMERASE CHAIN REACTION, BY COUNTRY, 2023–2030 (USD MILLION)
TABLE 198
MIDDLE EAST & AFRICA: INFECTIOUS DISEASE DIAGNOSTICS MARKET FOR POLYMERASE CHAIN REACTION, BY COUNTRY, 2023–2030 (USD MILLION)
TABLE 199
KEY ISOTHERMAL NUCLEIC ACID AMPLIFICATION TECHNOLOGY-BASED PRODUCTS CURRENTLY AVAILABLE
TABLE 200
INFECTIOUS DISEASE DIAGNOSTICS MARKET FOR ISOTHERMAL NUCLEIC ACID AMPLIFICATION TECHNOLOGY, BY REGION, 2023–2030 (USD MILLION)
TABLE 201
NORTH AMERICA: INFECTIOUS DISEASE DIAGNOSTICS MARKET FOR ISOTHERMAL NUCLEIC ACID AMPLIFICATION TECHNOLOGY, BY COUNTRY, 2023–2030 (USD MILLION)
TABLE 202
EUROPE: INFECTIOUS DISEASE DIAGNOSTICS MARKET FOR ISOTHERMAL NUCLEIC ACID AMPLIFICATION TECHNOLOGY, BY COUNTRY, 2023–2030 (USD MILLION)
TABLE 203
ASIA PACIFIC: INFECTIOUS DISEASE DIAGNOSTICS MARKET FOR ISOTHERMAL NUCLEIC ACID AMPLIFICATION TECHNOLOGY, BY COUNTRY, 2023–2030 (USD MILLION)
TABLE 204
LATIN AMERICA: INFECTIOUS DISEASE DIAGNOSTICS MARKET FOR ISOTHERMAL NUCLEIC ACID AMPLIFICATION TECHNOLOGY, BY COUNTRY, 2023–2030 (USD MILLION)
TABLE 205
MIDDLE EAST & AFRICA: INFECTIOUS DISEASE DIAGNOSTICS MARKET FOR ISOTHERMAL NUCLEIC ACID AMPLIFICATION TECHNOLOGY, BY COUNTRY, 2023–2030 (USD MILLION)
TABLE 206
KEY DNA SEQUENCING & NEXT-GENERATION SEQUENCING-BASED PRODUCTS CURRENTLY AVAILABLE
TABLE 207
INFECTIOUS DISEASE DIAGNOSTICS MARKET FOR DNA SEQUENCING & NEXT-GENERATION SEQUENCING, BY REGION, 2023–2030 (USD MILLION)
TABLE 208
NORTH AMERICA: INFECTIOUS DISEASE DIAGNOSTICS MARKET FOR DNA SEQUENCING & NEXT-GENERATION SEQUENCING, BY COUNTRY, 2023–2030 (USD MILLION)
TABLE 209
EUROPE: INFECTIOUS DISEASE DIAGNOSTICS MARKET FOR DNA SEQUENCING & NEXT-GENERATION SEQUENCING, 2023–2030 (USD MILLION)
TABLE 210
ASIA PACIFIC: INFECTIOUS DISEASE DIAGNOSTICS MARKET FOR DNA SEQUENCING & NEXT-GENERATION SEQUENCING, BY COUNTRY, 2023–2030 (USD MILLION)
TABLE 211
LATIN AMERICA: INFECTIOUS DISEASE DIAGNOSTICS MARKET FOR DNA SEQUENCING & NEXT-GENERATION SEQUENCING, BY COUNTRY, 2023–2030 (USD MILLION)
TABLE 212
MIDDLE EAST & AFRICA: INFECTIOUS DISEASE DIAGNOSTICS MARKET FOR DNA SEQUENCING & NEXT-GENERATION SEQUENCING, BY COUNTRY, 2023–2030 (USD MILLION)
TABLE 213
KEY DNA MICROARRAY-BASED PRODUCTS CURRENTLY AVAILABLE
TABLE 214
INFECTIOUS DISEASE DIAGNOSTICS MARKET FOR DNA MICROARRAYS, BY REGION, 2023–2030 (USD MILLION)
TABLE 215
NORTH AMERICA: INFECTIOUS DISEASE DIAGNOSTICS MARKET FOR DNA MICROARRAYS, BY COUNTRY, 2023–2030 (USD MILLION)
TABLE 216
EUROPE: INFECTIOUS DISEASE DIAGNOSTICS MARKET FOR DNA MICROARRAYS, BY COUNTRY, 2023–2030 (USD MILLION)
TABLE 217
ASIA PACIFIC: INFECTIOUS DISEASE DIAGNOSTICS MARKET FOR DNA MICROARRAYS, BY COUNTRY, 2023–2030 (USD MILLION)
TABLE 218
LATIN AMERICA: INFECTIOUS DISEASE DIAGNOSTICS MARKET FOR DNA MICROARRAYS, BY COUNTRY, 2023–2030 (USD MILLION)
TABLE 219
MIDDLE EAST & AFRICA: INFECTIOUS DISEASE DIAGNOSTICS MARKET FOR DNA MICROARRAYS, BY COUNTRY, 2023–2030 (USD MILLION)
TABLE 220
INFECTIOUS DISEASE DIAGNOSTICS MARKET FOR OTHER TECHNOLOGIES, BY REGION, 2023–2030 (USD MILLION)
TABLE 221
NORTH AMERICA: INFECTIOUS DISEASE DIAGNOSTICS MARKET FOR OTHER TECHNOLOGIES, BY COUNTRY, 2023–2030 (USD MILLION)
TABLE 222
EUROPE: INFECTIOUS DISEASE DIAGNOSTICS MARKET FOR OTHER TECHNOLOGIES, BY COUNTRY, 2023–2030 (USD MILLION)
TABLE 223
ASIA PACIFIC: INFECTIOUS DISEASE DIAGNOSTICS MARKET FOR OTHER TECHNOLOGIES, BY COUNTRY, 2023–2030 (USD MILLION)
TABLE 224
LATIN AMERICA: INFECTIOUS DISEASE DIAGNOSTICS MARKET FOR OTHER TECHNOLOGIES, BY COUNTRY, 2023–2030 (USD MILLION)
TABLE 225
MIDDLE EAST & AFRICA: INFECTIOUS DISEASE DIAGNOSTICS MARKET FOR OTHER TECHNOLOGIES, BY COUNTRY, 2023–2030 (USD MILLION)
TABLE 226
INFECTIOUS DISEASE DIAGNOSTICS MARKET, BY CLINICAL APPLICATION, 2023–2030 (USD MILLION)
TABLE 227
KEY DIAGNOSTICS PRODUCTS CURRENTLY AVAILABLE
TABLE 228
INFECTIOUS DISEASE DIAGNOSTICS MARKET FOR DIAGNOSTICS, BY REGION, 2023–2030 (USD MILLION)
TABLE 229
NORTH AMERICA: INFECTIOUS DISEASE DIAGNOSTICS MARKET FOR DIAGNOSTICS, BY COUNTRY, 2023–2030 (USD MILLION)
TABLE 230
EUROPE: INFECTIOUS DISEASE DIAGNOSTICS MARKET FOR DIAGNOSTICS, BY COUNTRY, 2023–2030 (USD MILLION)
TABLE 231
ASIA PACIFIC: INFECTIOUS DISEASE DIAGNOSTICS MARKET FOR DIAGNOSTICS, BY COUNTRY, 2023–2030 (USD MILLION)
TABLE 232
LATIN AMERICA: INFECTIOUS DISEASE DIAGNOSTICS MARKET FOR DIAGNOSTICS, BY COUNTRY, 2023–2030 (USD MILLION)
TABLE 233
MIDDLE EAST & AFRICA: INFECTIOUS DISEASE DIAGNOSTICS MARKET FOR DIAGNOSTICS, BY COUNTRY, 2023–2030 (USD MILLION)
TABLE 234
KEY SCREENING PRODUCTS CURRENTLY AVAILABLE
TABLE 235
INFECTIOUS DISEASE DIAGNOSTICS MARKET FOR SCREENING, BY REGION, 2023–2030 (USD MILLION)
TABLE 236
NORTH AMERICA: INFECTIOUS DISEASE DIAGNOSTICS MARKET FOR SCREENING, BY COUNTRY, 2023–2030 (USD MILLION)
TABLE 237
EUROPE: INFECTIOUS DISEASE DIAGNOSTICS MARKET FOR SCREENING, BY COUNTRY, 2023–2030 (USD MILLION)
TABLE 238
ASIA PACIFIC: INFECTIOUS DISEASE DIAGNOSTICS MARKET FOR SCREENING, BY COUNTRY, 2023–2030 (USD MILLION)
TABLE 239
LATIN AMERICA: INFECTIOUS DISEASE DIAGNOSTICS MARKET FOR SCREENING, BY COUNTRY, 2023–2030 (USD MILLION)
TABLE 240
MIDDLE EAST & AFRICA: INFECTIOUS DISEASE DIAGNOSTICS MARKET FOR SCREENING, BY COUNTRY, 2023–2030 (USD MILLION)
TABLE 241
INFECTIOUS DISEASE DIAGNOSTICS MARKET, BY END USER, 2023–2030 (USD MILLION)
TABLE 242
INFECTIOUS DISEASE DIAGNOSTICS MARKET FOR DIAGNOSTIC LABORATORIES, BY REGION, 2023–2030 (USD MILLION)
TABLE 243
NORTH AMERICA: INFECTIOUS DISEASE DIAGNOSTICS MARKET FOR DIAGNOSTIC LABORATORIES, BY COUNTRY, 2023–2030 (USD MILLION)
TABLE 244
EUROPE: INFECTIOUS DISEASE DIAGNOSTICS MARKET FOR DIAGNOSTIC LABORATORIES, BY COUNTRY, 2023–2030 (USD MILLION)
TABLE 245
ASIA PACIFIC: INFECTIOUS DISEASE DIAGNOSTICS MARKET DIAGNOSTIC LABORATORIES, BY COUNTRY, 2023–2030 (USD MILLION)
TABLE 246
LATIN AMERICA: INFECTIOUS DISEASE DIAGNOSTICS MARKET FOR DIAGNOSTIC LABORATORIES, BY COUNTRY, 2023–2030 (USD MILLION)
TABLE 247
MIDDLE EAST & AFRICA: INFECTIOUS DISEASE DIAGNOSTICS MARKET FOR DIAGNOSTIC LABORATORIES, BY COUNTRY, 2023–2030 (USD MILLION)
TABLE 248
INFECTIOUS DISEASE DIAGNOSTICS MARKET FOR HOSPITALS & CLINICS, BY REGION, 2023–2030 (USD MILLION)
TABLE 249
NORTH AMERICA: INFECTIOUS DISEASE DIAGNOSTICS MARKET FOR HOSPITALS & CLINICS, BY COUNTRY, 2023–2030 (USD MILLION)
TABLE 250
EUROPE: INFECTIOUS DISEASE DIAGNOSTICS MARKET FOR HOSPITALS & CLINICS, BY COUNTRY, 2023–2030 (USD MILLION)
TABLE 251
ASIA PACIFIC: INFECTIOUS DISEASE DIAGNOSTICS MARKET FOR HOSPITALS & CLINICS, BY COUNTRY, 2023–2030 (USD MILLION)
TABLE 252
LATIN AMERICA: INFECTIOUS DISEASE DIAGNOSTICS MARKET FOR HOSPITALS & CLINICS, BY COUNTRY, 2023–2030 (USD MILLION)
TABLE 253
MIDDLE EAST & AFRICA: INFECTIOUS DISEASE DIAGNOSTICS MARKET FOR HOSPITALS & CLINICS, BY COUNTRY, 2023–2030 (USD MILLION)
TABLE 254
INFECTIOUS DISEASE DIAGNOSTICS MARKET FOR ACADEMIC RESEARCH INSTITUTES, BY REGION, 2023–2030 (USD MILLION)
TABLE 255
NORTH AMERICA: INFECTIOUS DISEASE DIAGNOSTICS MARKET FOR ACADEMIC RESEARCH INSTITUTES, BY COUNTRY, 2023–2030 (USD MILLION)
TABLE 256
EUROPE: INFECTIOUS DISEASE DIAGNOSTICS MARKET FOR ACADEMIC RESEARCH INSTITUTES, BY COUNTRY, 2023–2030 (USD MILLION)
TABLE 257
ASIA PACIFIC: INFECTIOUS DISEASE DIAGNOSTICS MARKET FOR ACADEMIC RESEARCH INSTITUTES, BY COUNTRY, 2023–2030 (USD MILLION)
TABLE 258
LATIN AMERICA: INFECTIOUS DISEASE DIAGNOSTICS MARKET FOR ACADEMIC RESEARCH INSTITUTES, BY COUNTRY, 2023–2030 (USD MILLION)
TABLE 259
MIDDLE EAST & AFRICA: INFECTIOUS DISEASE DIAGNOSTICS MARKET FOR ACADEMIC RESEARCH INSTITUTES, BY COUNTRY, 2023–2030 (USD MILLION)
TABLE 260
INFECTIOUS DISEASE DIAGNOSTICS MARKET FOR OTHER END USERS, BY REGION, 2023–2030 (USD MILLION)
TABLE 261
NORTH AMERICA: INFECTIOUS DISEASE DIAGNOSTICS MARKET FOR OTHER END USERS, BY COUNTRY, 2023–2030 (USD MILLION)
TABLE 262
EUROPE: INFECTIOUS DISEASE DIAGNOSTICS MARKET FOR OTHER END USERS, BY COUNTRY, 2023–2030 (USD MILLION)
TABLE 263
ASIA PACIFIC: INFECTIOUS DISEASE DIAGNOSTICS MARKET FOR OTHER END USERS, BY COUNTRY, 2023–2030 (USD MILLION)
TABLE 264
LATIN AMERICA: INFECTIOUS DISEASE DIAGNOSTICS MARKET FOR OTHER END USERS, BY COUNTRY, 2023–2030 (USD MILLION)
TABLE 265
MIDDLE EAST & AFRICA: INFECTIOUS DISEASE DIAGNOSTICS MARKET FOR OTHER END USERS, BY COUNTRY, 2023–2030 (USD MILLION)
TABLE 266
INFECTIOUS DISEASE DIAGNOSTICS MARKET, BY REGION, 2023–2030 (USD MILLION)
TABLE 267
NORTH AMERICA: INFECTIOUS DISEASE DIAGNOSTICS MARKET, BY COUNTRY, 2023–2030 (USD MILLION)
TABLE 268
NORTH AMERICA: INFECTIOUS DISEASE DIAGNOSTICS MARKET, BY PRODUCT & SERVICE, 2023–2030 (USD MILLION)
TABLE 269
NORTH AMERICA: INFECTIOUS DISEASE DIAGNOSTICS MARKET, BY TYPE OF TESTING, 2023–2030 (USD MILLION)
TABLE 270
NORTH AMERICA: INFECTIOUS DISEASE DIAGNOSTICS MARKET, BY SAMPLE TYPE, 2023–2030 (USD MILLION)
TABLE 271
NORTH AMERICA: INFECTIOUS DISEASE DIAGNOSTICS MARKET, BY DISEASE TYPE, 2023–2030 (USD MILLION)
TABLE 272
NORTH AMERICA: INFECTIOUS DISEASE DIAGNOSTICS MARKET FOR HEPATITIS, BY TYPE, 2023–2030 (USD MILLION)
TABLE 273
NORTH AMERICA: INFECTIOUS DISEASE DIAGNOSTICS MARKET, BY TECHNOLOGY, 2023–2030 (USD MILLION)
TABLE 274
NORTH AMERICA: INFECTIOUS DISEASE DIAGNOSTICS MARKET, BY CLINICAL APPLICATION, 2023–2030 (USD MILLION)
TABLE 275
NORTH AMERICA: INFECTIOUS DISEASE DIAGNOSTICS MARKET, BY END USER, 2023–2030 (USD MILLION)
TABLE 276
NORTH AMERICA: MACROECONOMIC INDICATORS
TABLE 277
US: INFECTIOUS DISEASE DIAGNOSTICS MARKET, BY PRODUCT & SERVICE, 2023–2030 (USD MILLION)
TABLE 278
US: INFECTIOUS DISEASE DIAGNOSTICS MARKET, BY TYPE OF TESTING, 2023–2030 (USD MILLION)
TABLE 279
US: INFECTIOUS DISEASE DIAGNOSTICS MARKET, BY SAMPLE TYPE, 2023–2030 (USD MILLION)
TABLE 280
US: INFECTIOUS DISEASE DIAGNOSTICS MARKET, BY DISEASE TYPE, 2023–2030 (USD MILLION)
TABLE 281
US: INFECTIOUS DISEASE DIAGNOSTICS MARKET FOR HEPATITIS, BY TYPE, 2023–2030 (USD MILLION)
TABLE 282
US: INFECTIOUS DISEASE DIAGNOSTICS MARKET, BY TECHNOLOGY, 2023–2030 (USD MILLION)
TABLE 283
US: INFECTIOUS DISEASE DIAGNOSTICS MARKET, BY CLINICAL APPLICATION, 2023–2030 (USD MILLION)
TABLE 284
US: INFECTIOUS DISEASE DIAGNOSTICS MARKET, BY END USER, 2023–2030 (USD MILLION)
TABLE 285
CANADA: INFECTIOUS DISEASE DIAGNOSTICS MARKET, BY PRODUCT & SERVICE, 2023–2030 (USD MILLION)
TABLE 286
CANADA: INFECTIOUS DISEASE DIAGNOSTICS MARKET, BY TYPE OF TESTING, 2023–2030 (USD MILLION)
TABLE 287
CANADA: INFECTIOUS DISEASE DIAGNOSTICS MARKET, BY SAMPLE TYPE, 2023–2030 (USD MILLION)
TABLE 288
CANADA: INFECTIOUS DISEASE DIAGNOSTICS MARKET, BY DISEASE TYPE, 2023–2030 (USD MILLION)
TABLE 289
CANADA: INFECTIOUS DISEASE DIAGNOSTICS MARKET FOR HEPATITIS, BY TYPE, 2023–2030 (USD MILLION)
TABLE 290
CANADA: INFECTIOUS DISEASE DIAGNOSTICS MARKET, BY TECHNOLOGY, 2023–2030 (USD MILLION)
TABLE 291
CANADA: INFECTIOUS DISEASE DIAGNOSTICS MARKET, BY CLINICAL APPLICATION, 2023–2030 (USD MILLION)
TABLE 292
CANADA: INFECTIOUS DISEASE DIAGNOSTICS MARKET, BY END USER, 2023–2030 (USD MILLION)
TABLE 293
EUROPE: MACROECONOMIC INDICATORS
TABLE 294
EUROPE: INFECTIOUS DISEASE DIAGNOSTICS MARKET, BY COUNTRY, 2023–2030 (USD MILLION)
TABLE 295
EUROPE: INFECTIOUS DISEASE DIAGNOSTICS MARKET, BY PRODUCT & SERVICE, 2023–2030 (USD MILLION)
TABLE 296
EUROPE: INFECTIOUS DISEASE DIAGNOSTICS MARKET, BY TYPE OF TESTING, 2023–2030 (USD MILLION)
TABLE 297
EUROPE: INFECTIOUS DISEASE DIAGNOSTICS MARKET, BY SAMPLE TYPE, 2023–2030 (USD MILLION)
TABLE 298
EUROPE: INFECTIOUS DISEASE DIAGNOSTICS MARKET, BY DISEASE TYPE, 2023–2030 (USD MILLION)
TABLE 299
EUROPE: INFECTIOUS DISEASE DIAGNOSTICS MARKET FOR HEPATITIS, BY TYPE, 2023–2030 (USD MILLION)
TABLE 300
EUROPE: INFECTIOUS DISEASE DIAGNOSTICS MARKET, BY TECHNOLOGY, 2023–2030 (USD MILLION)
TABLE 301
EUROPE: INFECTIOUS DISEASE DIAGNOSTICS MARKET, BY CLINICAL APPLICATION, 2023–2030 (USD MILLION)
TABLE 302
EUROPE: INFECTIOUS DISEASE DIAGNOSTICS MARKET, BY END USER, 2023–2030 (USD MILLION)
TABLE 303
GERMANY: INFECTIOUS DISEASE DIAGNOSTICS MARKET, BY PRODUCT & SERVICE, 2023–2030 (USD MILLION)
TABLE 304
GERMANY: INFECTIOUS DISEASE DIAGNOSTICS MARKET, BY TYPE OF TESTING, 2023–2030 (USD MILLION)
TABLE 305
GERMANY: INFECTIOUS DISEASE DIAGNOSTICS MARKET, BY SAMPLE TYPE, 2023–2030 (USD MILLION)
TABLE 306
GERMANY: INFECTIOUS DISEASE DIAGNOSTICS MARKET, BY DISEASE TYPE, 2023–2030 (USD MILLION)
TABLE 307
GERMANY: INFECTIOUS DISEASE DIAGNOSTICS MARKET FOR HEPATITIS, BY TYPE, 2023–2030 (USD MILLION)
TABLE 308
GERMANY: INFECTIOUS DISEASE DIAGNOSTICS MARKET, BY TECHNOLOGY, 2023–2030 (USD MILLION)
TABLE 309
GERMANY: INFECTIOUS DISEASE DIAGNOSTICS MARKET, BY CLINICAL APPLICATION, 2023–2030 (USD MILLION)
TABLE 310
GERMANY: INFECTIOUS DISEASE DIAGNOSTICS MARKET, BY END USER, 2023–2030 (USD MILLION)
TABLE 311
UK: INFECTIOUS DISEASE DIAGNOSTICS MARKET, BY PRODUCT & SERVICE, 2023–2030 (USD MILLION)
TABLE 312
UK: INFECTIOUS DISEASE DIAGNOSTICS MARKET, BY TYPE OF TESTING, 2023–2030 (USD MILLION)
TABLE 313
UK: INFECTIOUS DISEASE DIAGNOSTICS MARKET, BY SAMPLE TYPE, 2023–2030 (USD MILLION)
TABLE 314
UK: INFECTIOUS DISEASE DIAGNOSTICS MARKET, BY DISEASE TYPE, 2023–2030 (USD MILLION)
TABLE 315
UK: INFECTIOUS DISEASE DIAGNOSTICS MARKET FOR HEPATITIS, BY TYPE, 2023–2030 (USD MILLION)
TABLE 316
UK: INFECTIOUS DISEASE DIAGNOSTICS MARKET, BY TECHNOLOGY, 2023–2030 (USD MILLION)
TABLE 317
UK: INFECTIOUS DISEASE DIAGNOSTICS MARKET, BY CLINICAL APPLICATION, 2023–2030 (USD MILLION)
TABLE 318
UK: INFECTIOUS DISEASE DIAGNOSTICS MARKET, BY END USER, 2023–2030 (USD MILLION)
TABLE 319
FRANCE: INFECTIOUS DISEASE DIAGNOSTICS MARKET, BY PRODUCT & SERVICE, 2023–2030 (USD MILLION)
TABLE 320
FRANCE: INFECTIOUS DISEASE DIAGNOSTICS MARKET, BY TYPE OF TESTING, 2023–2030 (USD MILLION)
TABLE 321
FRANCE: INFECTIOUS DISEASE DIAGNOSTICS MARKET, BY SAMPLE TYPE, 2023–2030 (USD MILLION)
TABLE 322
FRANCE: INFECTIOUS DISEASE DIAGNOSTICS MARKET, BY DISEASE TYPE, 2023–2030 (USD MILLION)
TABLE 323
FRANCE: INFECTIOUS DISEASE DIAGNOSTICS MARKET FOR HEPATITIS, BY TYPE, 2023–2030 (USD MILLION)
TABLE 324
FRANCE: INFECTIOUS DISEASE DIAGNOSTICS MARKET, BY TECHNOLOGY, 2023–2030 (USD MILLION)
TABLE 325
FRANCE: INFECTIOUS DISEASE DIAGNOSTICS MARKET, BY CLINICAL APPLICATION, 2023–2030 (USD MILLION)
TABLE 326
FRANCE: INFECTIOUS DISEASE DIAGNOSTICS MARKET, BY END USER, 2023–2030 (USD MILLION)
TABLE 327
ITALY: INFECTIOUS DISEASE DIAGNOSTICS MARKET, BY PRODUCT & SERVICE, 2023–2030 (USD MILLION)
TABLE 328
ITALY: INFECTIOUS DISEASE DIAGNOSTICS MARKET, BY TYPE OF TESTING, 2023–2030 (USD MILLION)
TABLE 329
ITALY: INFECTIOUS DISEASE DIAGNOSTICS MARKET, BY SAMPLE TYPE, 2023–2030 (USD MILLION)
TABLE 330
ITALY: INFECTIOUS DISEASE DIAGNOSTICS MARKET, BY DISEASE TYPE, 2023–2030 (USD MILLION)
TABLE 331
ITALY: INFECTIOUS DISEASE DIAGNOSTICS MARKET FOR HEPATITIS, BY TYPE, 2023–2030 (USD MILLION)
TABLE 332
ITALY: INFECTIOUS DISEASE DIAGNOSTICS MARKET, BY TECHNOLOGY, 2023–2030 (USD MILLION)
TABLE 333
ITALY: INFECTIOUS DISEASE DIAGNOSTICS MARKET, BY CLINICAL APPLICATION, 2023–2030 (USD MILLION)
TABLE 334
ITALY: INFECTIOUS DISEASE DIAGNOSTICS MARKET, BY END USER, 2023–2030 (USD MILLION)
TABLE 335
SPAIN: INFECTIOUS DISEASE DIAGNOSTICS MARKET, BY PRODUCT & SERVICE, 2023–2030 (USD MILLION)
TABLE 336
SPAIN: INFECTIOUS DISEASE DIAGNOSTICS MARKET, BY TYPE OF TESTING, 2023–2030 (USD MILLION)
TABLE 337
SPAIN: INFECTIOUS DISEASE DIAGNOSTICS MARKET, BY SAMPLE TYPE, 2023–2030 (USD MILLION)
TABLE 338
SPAIN: INFECTIOUS DISEASE DIAGNOSTICS MARKET, BY DISEASE TYPE, 2023–2030 (USD MILLION)
TABLE 339
SPAIN: INFECTIOUS DISEASE DIAGNOSTICS MARKET FOR HEPATITIS, BY TYPE, 2023–2030 (USD MILLION)
TABLE 340
SPAIN: INFECTIOUS DISEASE DIAGNOSTICS MARKET, BY TECHNOLOGY, 2023–2030 (USD MILLION)
TABLE 341
SPAIN: INFECTIOUS DISEASE DIAGNOSTICS MARKET, BY CLINICAL APPLICATION, 2023–2030 (USD MILLION)
TABLE 342
SPAIN: INFECTIOUS DISEASE DIAGNOSTICS MARKET, BY END USER, 2023–2030 (USD MILLION)
TABLE 343
GDP EXPENDITURE ON HEALTHCARE, BY COUNTRY (%)
TABLE 344
REST OF EUROPE: INFECTIOUS DISEASE DIAGNOSTICS MARKET, BY PRODUCT & SERVICE, 2023–2030 (USD MILLION)
TABLE 345
REST OF EUROPE: INFECTIOUS DISEASE DIAGNOSTICS MARKET, BY TYPE OF TESTING, 2023–2030 (USD MILLION)
TABLE 346
REST OF EUROPE: INFECTIOUS DISEASE DIAGNOSTICS MARKET, BY SAMPLE TYPE, 2023–2030 (USD MILLION)
TABLE 347
REST OF EUROPE: INFECTIOUS DISEASE DIAGNOSTICS MARKET, BY DISEASE TYPE, 2023–2030 (USD MILLION)
TABLE 348
REST OF EUROPE: INFECTIOUS DISEASE DIAGNOSTICS MARKET FOR HEPATITIS, BY TYPE, 2023–2030 (USD MILLION)
TABLE 349
REST OF EUROPE: INFECTIOUS DISEASE DIAGNOSTICS MARKET, BY TECHNOLOGY, 2023–2030 (USD MILLION)
TABLE 350
REST OF EUROPE: INFECTIOUS DISEASE DIAGNOSTICS MARKET, BY CLINICAL APPLICATION, 2023–2030 (USD MILLION)
TABLE 351
REST OF EUROPE: INFECTIOUS DISEASE DIAGNOSTICS MARKET, BY END USER, 2023–2030 (USD MILLION)
TABLE 352
ASIA PACIFIC: MACROECONOMIC INDICATORS
TABLE 353
ASIA PACIFIC: INFECTIOUS DISEASE DIAGNOSTICS MARKET, BY COUNTRY, 2023–2030 (USD MILLION)
TABLE 354
ASIA PACIFIC: INFECTIOUS DISEASE DIAGNOSTICS MARKET, BY PRODUCT & SERVICE, 2023–2030 (USD MILLION)
TABLE 355
ASIA PACIFIC: INFECTIOUS DISEASE DIAGNOSTICS MARKET, BY TYPE OF TESTING, 2023–2030 (USD MILLION)
TABLE 356
ASIA PACIFIC: INFECTIOUS DISEASE DIAGNOSTICS MARKET, BY SAMPLE TYPE, 2023–2030 (USD MILLION)
TABLE 357
ASIA PACIFIC: INFECTIOUS DISEASE DIAGNOSTICS MARKET, BY DISEASE TYPE, 2023–2030 (USD MILLION)
TABLE 358
ASIA PACIFIC: INFECTIOUS DISEASE DIAGNOSTICS MARKET FOR HEPATITIS, BY TYPE, 2023–2030 (USD MILLION)
TABLE 359
ASIA PACIFIC: INFECTIOUS DISEASE DIAGNOSTICS MARKET, BY TECHNOLOGY, 2023–2030 (USD MILLION)
TABLE 360
ASIA PACIFIC: INFECTIOUS DISEASE DIAGNOSTICS MARKET, BY CLINICAL APPLICATION, 2023–2030 (USD MILLION)
TABLE 361
ASIA PACIFIC: INFECTIOUS DISEASE DIAGNOSTICS MARKET, BY END USER, 2023–2030 (USD MILLION)
TABLE 362
CHINA: INFECTIOUS DISEASE DIAGNOSTICS MARKET, BY PRODUCT & SERVICE, 2023–2030 (USD MILLION)
TABLE 363
CHINA: INFECTIOUS DISEASE DIAGNOSTICS MARKET, BY TYPE OF TESTING, 2023–2030 (USD MILLION)
TABLE 364
CHINA: INFECTIOUS DISEASE DIAGNOSTICS MARKET, BY SAMPLE TYPE, 2023–2030 (USD MILLION)
TABLE 365
CHINA: INFECTIOUS DISEASE DIAGNOSTICS MARKET, BY DISEASE TYPE, 2023–2030 (USD MILLION)
TABLE 366
CHINA: INFECTIOUS DISEASE DIAGNOSTICS MARKET FOR HEPATITIS, BY TYPE, 2023–2030 (USD MILLION)
TABLE 367
CHINA: INFECTIOUS DISEASE DIAGNOSTICS MARKET, BY TECHNOLOGY, 2023–2030 (USD MILLION)
TABLE 368
CHINA: INFECTIOUS DISEASE DIAGNOSTICS MARKET, BY CLINICAL APPLICATION, 2023–2030 (USD MILLION)
TABLE 369
CHINA: INFECTIOUS DISEASE DIAGNOSTICS MARKET, BY END USER, 2023–2030 (USD MILLION)
TABLE 370
JAPAN: INFECTIOUS DISEASE DIAGNOSTICS MARKET, BY PRODUCT & SERVICE, 2023–2030 (USD MILLION)
TABLE 371
JAPAN: INFECTIOUS DISEASE DIAGNOSTICS MARKET, BY TYPE OF TESTING, 2023–2030 (USD MILLION)
TABLE 372
JAPAN: INFECTIOUS DISEASE DIAGNOSTICS MARKET, BY SAMPLE TYPE, 2023–2030 (USD MILLION)
TABLE 373
JAPAN: INFECTIOUS DISEASE DIAGNOSTICS MARKET, BY DISEASE TYPE, 2023–2030 (USD MILLION)
TABLE 374
JAPAN: INFECTIOUS DISEASE DIAGNOSTICS MARKET FOR HEPATITIS, BY TYPE, 2023–2030 (USD MILLION)
TABLE 375
JAPAN: INFECTIOUS DISEASE DIAGNOSTICS MARKET, BY TECHNOLOGY, 2023–2030 (USD MILLION)
TABLE 376
JAPAN: INFECTIOUS DISEASE DIAGNOSTICS MARKET, BY CLINICAL APPLICATION, 2023–2030 (USD MILLION)
TABLE 377
JAPAN: INFECTIOUS DISEASE DIAGNOSTICS MARKET, BY END USER, 2023–2030 (USD MILLION)
TABLE 378
INDIA: INFECTIOUS DISEASE DIAGNOSTICS MARKET, BY PRODUCT & SERVICE, 2023–2030 (USD MILLION)
TABLE 379
INDIA: INFECTIOUS DISEASE DIAGNOSTICS MARKET, BY TYPE OF TESTING, 2023–2030 (USD MILLION)
TABLE 380
INDIA: INFECTIOUS DISEASE DIAGNOSTICS MARKET, BY SAMPLE TYPE, 2023–2030 (USD MILLION)
TABLE 381
INDIA: INFECTIOUS DISEASE DIAGNOSTICS MARKET, BY DISEASE TYPE, 2023–2030 (USD MILLION)
TABLE 382
INDIA: INFECTIOUS DISEASE DIAGNOSTICS MARKET FOR HEPATITIS, BY TYPE, 2023–2030 (USD MILLION)
TABLE 383
INDIA: INFECTIOUS DISEASE DIAGNOSTICS MARKET, BY TECHNOLOGY, 2023–2030 (USD MILLION)
TABLE 384
INDIA: INFECTIOUS DISEASE DIAGNOSTICS MARKET, BY CLINICAL APPLICATION, 2023–2030 (USD MILLION)
TABLE 385
INDIA: INFECTIOUS DISEASE DIAGNOSTICS MARKET, BY END USER, 2023–2030 (USD MILLION)
TABLE 386
REST OF ASIA PACIFIC: INFECTIOUS DISEASE DIAGNOSTICS MARKET, BY PRODUCT & SERVICE, 2023–2030 (USD MILLION)
TABLE 387
REST OF ASIA PACIFIC: INFECTIOUS DISEASE DIAGNOSTICS MARKET, BY TYPE OF TESTING, 2023–2030 (USD MILLION)
TABLE 388
REST OF ASIA PACIFIC: INFECTIOUS DISEASE DIAGNOSTICS MARKET, BY SAMPLE TYPE, 2023–2030 (USD MILLION)
TABLE 389
REST OF ASIA PACIFIC: INFECTIOUS DISEASE DIAGNOSTICS MARKET, BY DISEASE TYPE, 2023–2030 (USD MILLION)
TABLE 390
REST OF ASIA PACIFIC: INFECTIOUS DISEASE DIAGNOSTICS MARKET FOR HEPATITIS, BY TYPE, 2023–2030 (USD MILLION)
TABLE 391
REST OF ASIA PACIFIC: INFECTIOUS DISEASE DIAGNOSTICS MARKET, BY TECHNOLOGY, 2023–2030 (USD MILLION)
TABLE 392
REST OF ASIA PACIFIC: INFECTIOUS DISEASE DIAGNOSTICS MARKET, BY CLINICAL APPLICATION, 2023–2030 (USD MILLION)
TABLE 393
REST OF ASIA PACIFIC: INFECTIOUS DISEASE DIAGNOSTICS MARKET, BY END USER, 2023–2030 (USD MILLION)
TABLE 394
LATIN AMERICA: MACROECONOMIC INDICATORS
TABLE 395
LATIN AMERICA: INFECTIOUS DISEASE DIAGNOSTICS MARKET, BY COUNTRY, 2023–2030 (USD MILLION)
TABLE 396
LATIN AMERICA: INFECTIOUS DISEASE DIAGNOSTICS MARKET, BY PRODUCT & SERVICE, 2023–2030 (USD MILLION)
TABLE 397
LATIN AMERICA: INFECTIOUS DISEASE DIAGNOSTICS MARKET, BY TYPE OF TESTING, 2023–2030 (USD MILLION)
TABLE 398
LATIN AMERICA: INFECTIOUS DISEASE DIAGNOSTICS MARKET, BY SAMPLE TYPE, 2023–2030 (USD MILLION)
TABLE 399
LATIN AMERICA: INFECTIOUS DISEASE DIAGNOSTICS MARKET, BY DISEASE TYPE, 2023–2030 (USD MILLION)
TABLE 400
LATIN AMERICA: INFECTIOUS DISEASE DIAGNOSTICS MARKET FOR HEPATITIS, BY TYPE, 2023–2030 (USD MILLION)
TABLE 401
LATIN AMERICA: INFECTIOUS DISEASE DIAGNOSTICS MARKET, BY TECHNOLOGY, 2023–2030 (USD MILLION)
TABLE 402
LATIN AMERICA: INFECTIOUS DISEASE DIAGNOSTICS MARKET, BY CLINICAL APPLICATION, 2023–2030 (USD MILLION)
TABLE 403
LATIN AMERICA: INFECTIOUS DISEASE DIAGNOSTICS MARKET, BY END USER, 2023–2030 (USD MILLION)
TABLE 404
BRAZIL: INFECTIOUS DISEASE DIAGNOSTICS MARKET, BY PRODUCT & SERVICE, 2023–2030 (USD MILLION)
TABLE 405
BRAZIL: INFECTIOUS DISEASE DIAGNOSTICS MARKET, BY TYPE OF TESTING, 2023–2030 (USD MILLION)
TABLE 406
BRAZIL: INFECTIOUS DISEASE DIAGNOSTICS MARKET, BY SAMPLE TYPE, 2023–2030 (USD MILLION)
TABLE 407
BRAZIL: INFECTIOUS DISEASE DIAGNOSTICS MARKET, BY DISEASE TYPE, 2023–2030 (USD MILLION)
TABLE 408
BRAZIL: INFECTIOUS DISEASE DIAGNOSTICS MARKET FOR HEPATITIS, BY TYPE, 2023–2030 (USD MILLION)
TABLE 409
BRAZIL: INFECTIOUS DISEASE DIAGNOSTICS MARKET, BY TECHNOLOGY, 2023–2030 (USD MILLION)
TABLE 410
BRAZIL: INFECTIOUS DISEASE DIAGNOSTICS MARKET, BY CLINICAL APPLICATION, 2023–2030 (USD MILLION)
TABLE 411
BRAZIL: INFECTIOUS DISEASE DIAGNOSTICS MARKET, BY END USER, 2023–2030 (USD MILLION)
TABLE 412
MEXICO: INFECTIOUS DISEASE DIAGNOSTICS MARKET, BY PRODUCT & SERVICE, 2023–2030 (USD MILLION)
TABLE 413
MEXICO: INFECTIOUS DISEASE DIAGNOSTICS MARKET, BY TYPE OF TESTING, 2023–2030 (USD MILLION)
TABLE 414
MEXICO: INFECTIOUS DISEASE DIAGNOSTICS MARKET, BY SAMPLE TYPE, 2023–2030 (USD MILLION)
TABLE 415
MEXICO: INFECTIOUS DISEASE DIAGNOSTICS MARKET, BY DISEASE TYPE, 2023–2030 (USD MILLION)
TABLE 416
MEXICO: INFECTIOUS DISEASE DIAGNOSTICS MARKET FOR HEPATITIS, BY TYPE, 2023–2030 (USD MILLION)
TABLE 417
MEXICO: INFECTIOUS DISEASE DIAGNOSTICS MARKET, BY TECHNOLOGY, 2023–2030 (USD MILLION)
TABLE 418
MEXICO: INFECTIOUS DISEASE DIAGNOSTICS MARKET, BY CLINICAL APPLICATION, 2023–2030 (USD MILLION)
TABLE 419
MEXICO: INFECTIOUS DISEASE DIAGNOSTICS MARKET, BY END USER, 2023–2030 (USD MILLION)
TABLE 420
REST OF LATIN AMERICA: INFECTIOUS DISEASE DIAGNOSTICS MARKET, BY PRODUCT & SERVICE, 2023–2030 (USD MILLION)
TABLE 421
REST OF LATIN AMERICA: INFECTIOUS DISEASE DIAGNOSTICS MARKET, BY TYPE OF TESTING, 2023–2030 (USD MILLION)
TABLE 422
REST OF LATIN AMERICA: INFECTIOUS DISEASE DIAGNOSTICS MARKET, BY SAMPLE TYPE, 2023–2030 (USD MILLION)
TABLE 423
REST OF LATIN AMERICA: INFECTIOUS DISEASE DIAGNOSTICS MARKET, BY DISEASE TYPE, 2023–2030 (USD MILLION)
TABLE 424
REST OF LATIN AMERICA: INFECTIOUS DISEASE DIAGNOSTICS MARKET FOR HEPATITIS, BY TYPE, 2023–2030 (USD MILLION)
TABLE 425
REST OF LATIN AMERICA: INFECTIOUS DISEASE DIAGNOSTICS MARKET, BY TECHNOLOGY, 2023–2030 (USD MILLION)
TABLE 426
REST OF LATIN AMERICA: INFECTIOUS DISEASE DIAGNOSTICS MARKET, BY CLINICAL APPLICATION, 2023–2030 (USD MILLION)
TABLE 427
REST OF LATIN AMERICA: INFECTIOUS DISEASE DIAGNOSTICS MARKET, BY END USER, 2023–2030 (USD MILLION)
TABLE 428
MIDDLE EAST & AFRICA: MACROECONOMIC INDICATORS
TABLE 429
MIDDLE EAST & AFRICA: INFECTIOUS DISEASE DIAGNOSTICS MARKET, BY COUNTRY, 2023–2030 (USD MILLION)
TABLE 430
MIDDLE EAST & AFRICA: INFECTIOUS DISEASE DIAGNOSTICS MARKET, BY PRODUCT & SERVICE, 2023–2030 (USD MILLION)
TABLE 431
MIDDLE EAST & AFRICA: INFECTIOUS DISEASE DIAGNOSTICS MARKET, BY TYPE OF TESTING, 2023–2030 (USD MILLION)
TABLE 432
MIDDLE EAST & AFRICA: INFECTIOUS DISEASE DIAGNOSTICS MARKET, BY SAMPLE TYPE, 2023–2030 (USD MILLION)
TABLE 433
MIDDLE EAST & AFRICA: INFECTIOUS DISEASE DIAGNOSTICS MARKET, BY DISEASE TYPE, 2023–2030 (USD MILLION)
TABLE 434
MIDDLE EAST & AFRICA: INFECTIOUS DISEASE DIAGNOSTICS MARKET FOR HEPATITIS, BY TYPE, 2023–2030 (USD MILLION)
TABLE 435
MIDDLE EAST & AFRICA: INFECTIOUS DISEASE DIAGNOSTICS MARKET, BY TECHNOLOGY, 2023–2030 (USD MILLION)
TABLE 436
MIDDLE EAST & AFRICA: INFECTIOUS DISEASE DIAGNOSTICS MARKET, BY CLINICAL APPLICATION, 2023–2030 (USD MILLION)
TABLE 437
MIDDLE EAST & AFRICA: INFECTIOUS DISEASE DIAGNOSTICS MARKET, BY END USER, 2023–2030 (USD MILLION)
TABLE 438
KINGDOM OF SAUDI ARABIA: INFECTIOUS DISEASE DIAGNOSTICS MARKET, BY PRODUCT & SERVICE, 2023–2030 (USD MILLION)
TABLE 439
KINGDOM OF SAUDI ARABIA: INFECTIOUS DISEASE DIAGNOSTICS MARKET, BY TYPE OF TESTING, 2023–2030 (USD MILLION)
TABLE 440
KINGDOM OF SAUDI ARABIA: INFECTIOUS DISEASE DIAGNOSTICS MARKET, BY SAMPLE TYPE, 2023–2030 (USD MILLION)
TABLE 441
KINGDOM OF SAUDI ARABIA: INFECTIOUS DISEASE DIAGNOSTICS MARKET, BY DISEASE TYPE, 2023–2030 (USD MILLION)
TABLE 442
KINGDOM OF SAUDI ARABIA: INFECTIOUS DISEASE DIAGNOSTICS MARKET FOR HEPATITIS, BY TYPE, 2023–2030 (USD MILLION)
TABLE 443
KINGDOM OF SAUDI ARABIA: INFECTIOUS DISEASE DIAGNOSTICS MARKET, BY TECHNOLOGY, 2023–2030 (USD MILLION)
TABLE 444
KINGDOM OF SAUDI ARABIA: INFECTIOUS DISEASE DIAGNOSTICS MARKET, BY CLINICAL APPLICATION, 2023–2030 (USD MILLION)
TABLE 445
KINGDOM OF SAUDI ARABIA: INFECTIOUS DISEASE DIAGNOSTICS MARKET, BY END USER, 2023–2030 (USD MILLION)
TABLE 446
UNITED ARAB EMIRATES: INFECTIOUS DISEASE DIAGNOSTICS MARKET, BY PRODUCT & SERVICE, 2023–2030 (USD MILLION)
TABLE 447
UNITED ARAB EMIRATES: INFECTIOUS DISEASE DIAGNOSTICS MARKET, BY TYPE OF TESTING, 2023–2030 (USD MILLION)
TABLE 448
UNITED ARAB EMIRATES: INFECTIOUS DISEASE DIAGNOSTICS MARKET, BY SAMPLE TYPE, 2023–2030 (USD MILLION)
TABLE 449
UNITED ARAB EMIRATES: INFECTIOUS DISEASE DIAGNOSTICS MARKET, BY DISEASE TYPE, 2023–2030 (USD MILLION)
TABLE 450
UNITED ARAB EMIRATES: INFECTIOUS DISEASE DIAGNOSTICS MARKET FOR HEPATITIS, BY TYPE, 2023–2030 (USD MILLION)
TABLE 451
UNITED ARAB EMIRATES: INFECTIOUS DISEASE DIAGNOSTICS MARKET, BY TECHNOLOGY, 2023–2030 (USD MILLION)
TABLE 452
UNITED ARAB EMIRATES: INFECTIOUS DISEASE DIAGNOSTICS MARKET, BY CLINICAL APPLICATION, 2023–2030 (USD MILLION)
TABLE 453
UNITED ARAB EMIRATES: INFECTIOUS DISEASE DIAGNOSTICS MARKET, BY END USER, 2023–2030 (USD MILLION)
TABLE 454
REST OF MIDDLE EAST & AFRICA: INFECTIOUS DISEASE DIAGNOSTICS MARKET, BY PRODUCT & SERVICE, 2023–2030 (USD MILLION)
TABLE 455
REST OF MIDDLE EAST & AFRICA: INFECTIOUS DISEASE DIAGNOSTICS MARKET, BY TYPE OF TESTING, 2023–2030 (USD MILLION)
TABLE 456
REST OF MIDDLE EAST & AFRICA: INFECTIOUS DISEASE DIAGNOSTICS MARKET, BY SAMPLE TYPE, 2023–2030 (USD MILLION)
TABLE 457
REST OF MIDDLE EAST & AFRICA: INFECTIOUS DISEASE DIAGNOSTICS MARKET, BY DISEASE TYPE, 2023–2030 (USD MILLION)
TABLE 458
REST OF MIDDLE EAST & AFRICA: INFECTIOUS DISEASE DIAGNOSTICS MARKET FOR HEPATITIS, BY TYPE, 2023–2030 (USD MILLION)
TABLE 459
REST OF MIDDLE EAST & AFRICA: INFECTIOUS DISEASE DIAGNOSTICS MARKET, BY TECHNOLOGY, 2023–2030 (USD MILLION)
TABLE 460
REST OF MIDDLE EAST & AFRICA: INFECTIOUS DISEASE DIAGNOSTICS MARKET, BY CLINICAL APPLICATION, 2023–2030 (USD MILLION)
TABLE 461
REST OF MIDDLE EAST & AFRICA: INFECTIOUS DISEASE DIAGNOSTICS MARKET, BY END USER, 2023–2030 (USD MILLION)
TABLE 462
OVERVIEW OF STRATEGIES DEPLOYED BY KEY COMPANIES IN THE INFECTIOUS DISEASE DIAGNOSTICS MARKET, JANUARY 2021−JUNE 2025
TABLE 463
INFECTIOUS DISEASE DIAGNOSTICS MARKET: DEGREE OF COMPETITION
TABLE 464
INFECTIOUS DISEASE DIAGNOSTICS MARKET: REGION FOOTPRINT
TABLE 465
INFECTIOUS DISEASE DIAGNOSTICS MARKET: PRODUCT & SERVICE FOOTPRINT
TABLE 466
INFECTIOUS DISEASE DIAGNOSTICS MARKET: TYPE OF TESTING FOOTPRINT
TABLE 467
INFECTIOUS DISEASE DIAGNOSTICS MARKET: SAMPLE TYPE FOOTPRINT
TABLE 468
INFECTIOUS DISEASE DIAGNOSTICS MARKET: DETAILED LIST OF KEY STARTUPS/SMES
TABLE 469
INFECTIOUS DISEASE DIAGNOSTICS MARKET: COMPETITIVE BENCHMARKING OF STARTUPS/SMES (1/2)
TABLE 470
INFECTIOUS DISEASE DIAGNOSTICS MARKET: COMPETITIVE BENCHMARKING OF STARTUPS/SMES (2/2)
TABLE 471
INFECTIOUS DISEASE DIAGNOSTICS MARKET: PRODUCT LAUNCHES & APPROVALS, JANUARY 2021–JUNE 2025
TABLE 472
INFECTIOUS DISEASE DIAGNOSTICS MARKET: DEALS, JANUARY 2021–JUNE 2025
TABLE 473
INFECTIOUS DISEASE DIAGNOSTICS MARKET: EXPANSIONS, JANUARY 2021– JUNE 2025
TABLE 474
F. HOFFMANN-LA ROCHE LTD.: COMPANY OVERVIEW
TABLE 475
F. HOFFMANN-LA ROCHE LTD.: PRODUCTS/SERVICES OFFERED
TABLE 476
F. HOFFMANN-LA ROCHE LTD.: PRODUCT/SERVICE LAUNCHES & APPROVALS, JANUARY 2021–JUNE 2025
TABLE 477
F. HOFFMANN-LA ROCHE LTD.: DEALS, JANUARY 2021−JUNE 2025
TABLE 478
F. HOFFMANN-LA ROCHE LTD.: EXPANSIONS, JANUARY 2021–JUNE 2025
TABLE 479
ABBOTT: COMPANY OVERVIEW
TABLE 480
ABBOTT: PRODUCTS/SERVICES OFFERED
TABLE 481
ABBOTT: PRODUCT/SERVICE LAUNCHES & APPROVALS, JANUARY 2021–JUNE 2025
TABLE 482
ABBOTT: DEALS, JANUARY 2021−JUNE 2025
TABLE 483
DANAHER CORPORATION: COMPANY OVERVIEW
TABLE 484
DANAHER CORPORATION: PRODUCTS/SERVICES OFFERED
TABLE 485
DANAHER CORPORATION: PRODUCT/SERVICE LAUNCHES & APPROVALS, JANUARY 2021–JUNE 2025
TABLE 486
DANAHER CORPORATION: DEALS, JANUARY 2021–JUNE 2025
TABLE 487
DANAHER CORPORATION: EXPANSIONS, JANUARY 2021−JUNE 2025
TABLE 488
BIOMÉRIEUX: COMPANY OVERVIEW
TABLE 489
BIOMÉRIEUX: PRODUCTS/SERVICES OFFERED
TABLE 490
BIOMÉRIEUX: PRODUCT/SERVICE LAUNCHES & APPROVALS, JANUARY 2021–JUNE 2025
TABLE 491
BIOMÉRIEUX: DEALS, JANUARY 2021– JUNE 2025
TABLE 492
THERMO FISHER SCIENTIFIC INC.: COMPANY OVERVIEW
TABLE 493
THERMO FISHER SCIENTIFIC INC.: PRODUCTS/SERVICES OFFERED
TABLE 494
THERMO FISHER SCIENTIFIC INC.: PRODUCT/SERVICE LAUNCHES & APPROVALS, JANUARY 2021–JUNE 2025
TABLE 495
THERMO FISHER SCIENTIFIC INC.: DEALS, JANUARY 2021–JUNE 2025
TABLE 496
SIEMENS HEALTHINEERS AG: COMPANY OVERVIEW
TABLE 497
SIEMENS HEALTHINEERS AG: PRODUCTS/SERVICES OFFERED
TABLE 498
SIEMENS HEALTHINEERS AG: PRODUCT LAUNCHES, JANUARY 2021–JUNE 2025
TABLE 499
SIEMENS HEALTHINEERS AG: DEALS, JANUARY 2021−JUNE 2025
TABLE 500
SIEMENS HEALTHINEERS AG: EXPANSIONS, JANUARY 2021−JUNE 2025
TABLE 501
HOLOGIC, INC.: COMPANY OVERVIEW
TABLE 502
HOLOGIC, INC.: PRODUCTS/SERVICES OFFERED
TABLE 503
HOLOGIC, INC.: PRODUCT/SERVICE LAUNCHES & APPROVALS, JANUARY 2021–JUNE 2025
TABLE 504
HOLOGIC, INC.: DEALS, JANUARY 2021– JUNE 2025
TABLE 505
BECTON, DICKINSON AND COMPANY: COMPANY OVERVIEW
TABLE 506
BECTON, DICKINSON AND COMPANY: PRODUCTS/SERVICES OFFERED
TABLE 507
BECTON, DICKINSON AND COMPANY: PRODUCT/SERVICE LAUNCHES & APPROVALS, JANUARY 2021–JUNE 2025
TABLE 508
BD: DEALS, JANUARY 2021–JUNE 2025
TABLE 509
BD: EXPANSIONS, JANUARY 2021– JUNE 2025
TABLE 510
REVVITY, INC.: COMPANY OVERVIEW
TABLE 511
REVVITY, INC.: PRODUCTS/SERVICES OFFERED
TABLE 512
REVVITY INC.: PRODUCT/SERVICE LAUNCHES & APPROVALS, JANUARY 2021–JUNE 2025
TABLE 513
QIAGEN N.V.: COMPANY OVERVIEW
TABLE 514
QIAGEN N.V.: PRODUCTS/SERVICES OFFERED
TABLE 515
QIAGEN N.V.: PRODUCT/SERVICE LAUNCHES & APPROVALS, JANUARY 2021–JUNE 2025
TABLE 516
QIAGEN N.V.: DEALS, JANUARY 2021–JUNE 2025
TABLE 517
QIAGEN N.V.: EXPANSIONS, JANUARY 2021–JUNE 2025
TABLE 518
SEEGENE INC.: COMPANY OVERVIEW
TABLE 519
SEEGENE INC.: PRODUCTS/SERVICES OFFERED
TABLE 520
SEEGENE INC.: PRODUCT/SERVICE LAUNCHES & APPROVALS, JANUARY 2021–JUNE 2025
TABLE 521
SEEGENE INC.: DEALS, JANUARY 2021– JUNE 2025
TABLE 522
SEEGENE INC.: EXPANSIONS, JANUARY 2021– JUNE 2025
TABLE 523
QUIDELORTHO CORPORATION: COMPANY OVERVIEW
TABLE 524
GRIFOLS, S.A.: COMPANY OVERVIEW
TABLE 525
DIASORIN S.P.A.: COMPANY OVERVIEW
TABLE 526
BIO-RAD LABORATORIES, INC.: COMPANY OVERVIEW
TABLE 527
SYSMEX CORPORATION: COMPANY OVERVIEW
TABLE 528
ORASURE TECHNOLOGIES, INC.: COMPANY OVERVIEW
TABLE 529
CO-DIAGNOSTICS, INC.: COMPANY OVERVIEW
TABLE 530
SD BIOSENSOR, INC.: COMPANY OVERVIEW
TABLE 531
BIOSYNEX SA: COMPANY OVERVIEW
TABLE 532
TRINITY BIOTECH: COMPANY OVERVIEW
TABLE 533
BRUKER (ELITECHGROUP): COMPANY OVERVIEW
TABLE 534
GENETIC SIGNATURES: COMPANY OVERVIEW
TABLE 535
EPITOPE DIAGNOSTICS, INC.: COMPANY OVERVIEW
TABLE 536
TRIVITRON HEALTHCARE: COMPANY OVERVIEW
TABLE 537
MERIL LIFE SCIENCES PVT. LTD.: COMPANY OVERVIEW
TABLE 538
INBIOS INTERNATIONAL, INC.: COMPANY OVERVIEW
TABLE 539
UNIOGEN OY: COMPANY OVERVIEW
TABLE 540
VELA DIAGNOSTICS: COMPANY OVERVIEW
TABLE 541
MOLBIO DIAGNOSTICS LIMITED: COMPANY OVERVIEW
FIGURE 1
INFECTIOUS DISEASE DIAGNOSTICS MARKET SEGMENTATION & REGIONAL SCOPE
FIGURE 2
INFECTIOUS DISEASE DIAGNOSTICS MARKET: RESEARCH DESIGN METHODOLOGY
FIGURE 4
BREAKDOWN OF PRIMARY INTERVIEWS: SUPPLY-SIDE AND DEMAND-SIDE PARTICIPANTS
FIGURE 5
BREAKDOWN OF PRIMARY INTERVIEWS: BY COMPANY TYPE, DESIGNATION, AND REGION
FIGURE 6
BOTTOM-UP APPROACH: COMPANY REVENUE ESTIMATION APPROACH
FIGURE 7
CAGR PROJECTIONS: SUPPLY SIDE ANALYSIS T
FIGURE 8
INFECTIOUS DISEASE DIAGNOSTICS MARKET: TOP-DOWN APPROACH
FIGURE 9
DATA TRIANGULATION METHODOLOGY
FIGURE 10
INFECTIOUS DISEASE DIAGNOSTICS MARKET: RESEARCH ASSUMPTIONS
FIGURE 11
INFECTIOUS DISEASE DIAGNOSTICS MARKET, BY PRODUCT & SERVICE, 2025 VS. 2030 (USD MILLION)
FIGURE 12
INFECTIOUS DISEASE DIAGNOSTICS MARKET, BY TYPE OF TESTING, 2025 VS. 2030 (USD MILLION)
FIGURE 13
INFECTIOUS DISEASE DIAGNOSTICS MARKET, BY SAMPLE TYPE, 2025 VS. 2030 (USD MILLION)
FIGURE 14
INFECTIOUS DISEASE DIAGNOSTICS MARKET, BY TECHNOLOGY, 2025 VS. 2030 (USD MILLION)
FIGURE 15
INFECTIOUS DISEASE DIAGNOSTICS MARKET, BY DISEASE TYPE, 2025 VS. 2030 (USD MILLION)
FIGURE 16
INFECTIOUS DISEASE DIAGNOSTICS MARKET, BY CLINICAL APPLICATION, 2025 VS. 2030 (USD MILLION)
FIGURE 17
INFECTIOUS DISEASE DIAGNOSTICS MARKET, BY END USER, 2025 VS. 2030 (USD MILLION)
FIGURE 18
INFECTIOUS DISEASE DIAGNOSTICS MARKET, BY REGION, 2025 VS. 2030 (USD MILLION)
FIGURE 19
RISING FOCUS ON R&D FOR INFECTIOUS DISEASE DIAGNOSTICS TO PROPEL MARKET
FIGURE 20
REAGENTS, KITS, AND CONSUMABLES SEGMENT TO DOMINATE MARKET DURING FORECAST PERIOD
FIGURE 21
LABORATORY TESTING SEGMENT TO DOMINATE MARKET DURING FORECAST PERIOD
FIGURE 22
BLOOD, SERUM, AND PLASMA SEGMENT TO DOMINATE MARKET DURING FORECAST PERIOD
FIGURE 23
HEPATITIS SEGMENT TO DOMINATE MARKET DURING FORECAST PERIOD
FIGURE 24
IMMUNODIAGNOSTICS SEGMENT TO DOMINATE MARKET DURING FORECAST PERIOD
FIGURE 25
DIAGNOSTICS SEGMENT TO DOMINATE MARKET DURING FORECAST PERIOD
FIGURE 26
DIAGNOSTIC LABORATORIES SEGMENT TO DOMINATE MARKET DURING FORECAST PERIOD
FIGURE 27
ASIA PACIFIC REGION TO REGISTER HIGHEST GROWTH RATE DURING FORECAST PERIOD
FIGURE 28
INFECTIOUS DISEASE DIAGNOSTICS MARKET: DRIVERS, RESTRAINTS, OPPORTUNITIES, AND CHALLENGES
FIGURE 29
PATENT ANALYSIS FOR ISOTHERMAL NUCLEIC ACID AMPLIFICATION TECHNOLOGIES (JANUARY 2015–DECEMBER 2024)
FIGURE 30
VALUE CHAIN ANALYSIS: MAJOR VALUE ADDED DURING MANUFACTURING & ASSEMBLY PHASES
FIGURE 31
INFECTIOUS DISEASE DIAGNOSTICS MARKET: SUPPLY CHAIN ANALYSIS
FIGURE 32
INFECTIOUS DISEASE DIAGNOSTICS MARKET: ECOSYSTEM ANALYSIS
FIGURE 33
INFECTIOUS DISEASE DIAGNOSTICS MARKET: PORTER’S FIVE FORCES ANALYSIS
FIGURE 34
INFECTIOUS DISEASE DIAGNOSTICS MARKET: TRENDS & DISRUPTIONS IMPACTING CUSTOMERS’ BUSINESSES
FIGURE 35
INFLUENCE OF STAKEHOLDERS ON BUYING PROCESS FOR INFECTIOUS DISEASE DIAGNOSTIC PRODUCTS
FIGURE 36
KEY BUYING CRITERIA FOR INFECTIOUS DISEASE DIAGNOSTIC PRODUCTS
FIGURE 37
NUMBER OF DEALS & FUNDING ACTIVITIES IN INFECTIOUS DISEASE DIAGNOSTICS MARKET
FIGURE 38
MARKET POTENTIAL OF AI IN INFECTIOUS DISEASE DIAGNOSTICS MARKET
FIGURE 39
NORTH AMERICA: INFECTIOUS DISEASE DIAGNOSTICS MARKET SNAPSHOT
FIGURE 40
ASIA PACIFIC: INFECTIOUS DISEASE DIAGNOSTICS MARKET SNAPSHOT
FIGURE 41
REVENUE ANALYSIS OF KEY PLAYERS IN INFECTIOUS DISEASE DIAGNOSTICS MARKET (2022–2024)
FIGURE 42
MARKET SHARE ANALYSIS OF KEY PLAYERS IN INFECTIOUS DISEASE DIAGNOSTICS MARKET (2024)
FIGURE 43
INFECTIOUS DISEASE DIAGNOSTICS MARKET: COMPANY EVALUATION MATRIX (KEY PLAYERS), 2024
FIGURE 44
INFECTIOUS DISEASE DIAGNOSTICS MARKET: COMPANY FOOTPRINT
FIGURE 45
INFECTIOUS DISEASE DIAGNOSTICS MARKET: COMPANY EVALUATION MATRIX (STARTUPS/SMES), 2024
FIGURE 46
EV/EBITDA OF KEY VENDORS
FIGURE 47
YEAR-TO-DATE (YTD) PRICE TOTAL RETURN AND 5-YEAR STOCK BETA OF KEY VENDORS
FIGURE 48
INFECTIOUS DISEASE DIAGNOSTICS MARKET: BRAND COMPARISON FOR INSTRUMENTS
FIGURE 49
F. HOFFMANN-LA ROCHE LTD.: COMPANY SNAPSHOT (2024)
FIGURE 50
ABBOTT: COMPANY SNAPSHOT (2024)
FIGURE 51
DANAHER CORPORATION: COMPANY SNAPSHOT (2024)
FIGURE 52
BIOMÉRIEUX: COMPANY SNAPSHOT (2024)
FIGURE 53
THERMO FISHER SCIENTIFIC INC.: COMPANY SNAPSHOT (2024)
FIGURE 54
SIEMENS HEALTHINEERS AG: COMPANY SNAPSHOT (2024)
FIGURE 55
HOLOGIC, INC.: COMPANY SNAPSHOT (2024)
FIGURE 56
BECTON, DICKINSON AND COMPANY: COMPANY SNAPSHOT (2024)
FIGURE 57
REVVITY, INC.: COMPANY SNAPSHOT (2024)
FIGURE 58
QIAGEN N.V.: COMPANY SNAPSHOT (2024)
FIGURE 59
SEEGENE INC.: COMPANY SNAPSHOT (2024)


 Exclusive indicates content/data unique to MarketsandMarkets and not available with any competitors.


Mason
Jun, 2022
What are the challenges faced by the key players of the Infectious Disease Diagnostics Market?.
Reuben
Jun, 2022
Which of the segments of Infectious Disease Diagnostics Market is expected to hold the major share?.
Albie
Jun, 2022
How the technological innovations are boosting the global growth of Infectious Disease Diagnostics Market?.
Jason
Jun, 2026
After reviewing the Infectious Disease Diagnostics Market report, I found the segmentation around molecular diagnostics and rapid testing particularly useful for assessing future demand patterns across hospital and reference lab settings..
Jeffrey
Jun, 2026
I explored the study to better understand how infectious disease outbreaks are influencing diagnostic adoption, and the regional insights gave a practical view of where commercial expansion opportunities are accelerating..
Ryan
Jun, 2026
We were evaluating long-term investment potential in infectious disease diagnostics, and the report helped clarify how automation, point-of-care technologies, and reimbursement trends are shaping competitive positioning..