Infusion Pump Software Market by Type (DERS, Interoperability, Clinical Workflow), Indication (General Infusion, Pain & Anesthesia Management, Insulin Infusion), End User (Hospitals, Ambulatory Care Settings) - Global Forecasts to 2024


Infusion Pump Software Market
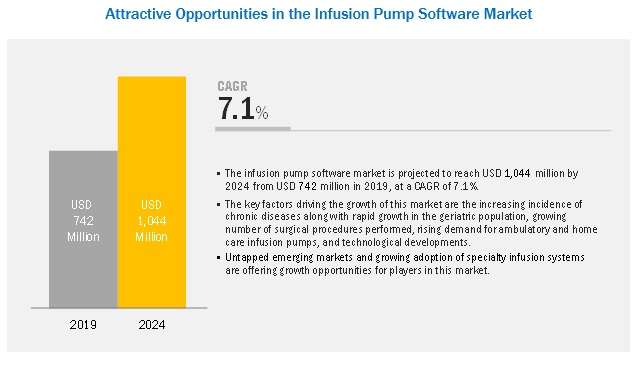
Global Infusion Pump Software Market is expected to grow at a CAGR of 7.1%.
Infusion Pump Software Market and Top Companies
Key market players profiled in the Infusion Pump Software market report includes:
- BD (US)
- B. Braun (Germany)
- Baxter (US)
- ICU Medical (US)
- Fresenius Kabi (Germany)
- BD (US) - Becton, Dickinson and Company (BD) is a medical technology company that develops, manufactures, and sells medical devices, instruments, and reagents used by healthcare institutions, life science researchers, clinical laboratories, and pharmaceutical industry. The company offers an extensive product portfolio of its software platforms for infusion pumps, including asset management, billing, EMR interoperability, clinical workflow, and dose management.
- B. Braun (Germany) - B. Braun develops and manufactures healthcare products and systems for cardiology, anesthesia, intensive care, surgery, and extracorporeal blood treatment. The company�s major end users include hospitals, private practitioners, and home care treatment providers. B. Braun sells its products and services through direct sales with the assistance of customer-service professionals, e-commerce, and third-party distributors.
- Baxter (US) - Baxter develops, manufactures, and markets essential healthcare products including acute and chronic dialysis therapies, sterile intravenous (IV) solutions, infusion systems and devices, parenteral nutrition therapies, inhaled anesthetics, generic injectable pharmaceuticals, surgical hemostat, and sealant products. They offer a versatile portfolio of infusion pump software solutions. The company also has a strong global presence with sales networks that covers over 100 countries.
- ICU Medical (US)- ICU Medical develops, manufactures, and sells innovative medical devices used in infusion therapy, critical care, and oncology applications. The company�s product line includes intravenous smart pumps, sets, connectors, closed transfer devices for hazardous drugs, cardiac monitoring systems, along with pain management and safety software technology.
- Fresenius Kabi (Germany) - Established in 1999, by combining the Fresenius Group's Pharma division with the business acquired from Pharmacia & Upjohn (Kabi), Fresenius Kabi. It is a global healthcare company specializing in medicines and technologies for infusion, transfusion, and clinical nutrition. The firm�s products and services assist critically and chronically ill patients. Fresenius Kabi is a wholly owned subsidiary of Fresenius SE & Co. KGaA.
Infusion Pump Software Market and Top Indications:
Top Indications in Infusion Pump Software Market are:
- General Infusion
- Pain and Anesthesia Management
- Insulin Infusion
- Chemotherapy
- Enteral Infusion
- General Infusion- General infusion includes infusion-based therapies for conditions in dermatology, endocrinology, neurology, rheumatology, hematology and other fields. Alerts and stops provided by infusion pump software allow clinicians to recognize programming errors and miscalculated doses that could otherwise harm the patient. Therefore, infusion systems are highly recommended for the suitable delivery of medication in patients for the various general health conditions.
- Pain and Anesthesia Management - Pain is associated with many diseases and almost all surgeries. It is one of the primary reasons for patient hospitalization. This leads to an increasing demand for infusion pump software for pain management. The introduction of novel medicines and biologics for pain management requires sophisticated, injectable delivery systems, thereby encouraging the use of infusion pump software in pain management therapies.
- Insulin Infusion - Insulin delivery plays a significant role in diabetes management. The treatment of type I diabetes requires the external administration of insulin. In certain conditions, type II diabetes therapy may also require insulin injections. With the rising demand for diabetes management therapy, the demand for insulin infusion pumps is also increasing.
- Chemotherapy - A number of novel products launched for cancer therapeutics demand controlled and targeted delivery of medication, thereby creating new demand for infusion pump software in cancer therapeutics. The increasing applications of ambulatory chemotherapy pumps are also expected to drive the growth of the infusion pump software market in this segment.
- Enteral Infusion - CEnteral infusion therapy deals with various treatments associated with the digestive system. This covers the administration of both nutrition and drugs when required. Nutritional deficiencies in the body are treated with external administration of the required nutritional products into the body. Using infusion systems for nutrition administration facilitates the continuous and controlled parenteral flow.
Infusion Pump Software Market and Top Software Types:
Top Software Types in Infusion Pump Software Market are:
- Dose Error Reduction Software (DERS)
- Clinical Workflow Software
- Interoperability software
- Dose Error Reduction Software (DERS) - Dose error reduction software (DERS) is a safety program that helps prevent infusion pump medication errors. DERS enables infusion pumps to warn users of incorrect medication orders, calculation errors, or misprogramming that could result in significant under or over delivery of a drug, electrolyte, or other fluid. The increasing incidence of medication errors is driving the demand for DERS in infusion pumps.
- Clinical Workflow Software- Clinical workflow software enables the implementation of an optimal care management workflow which includes initial and comprehensive assessment, interdisciplinary care planning, medication management, certifications, personal care, and discharge/bereavement management. Pertaining to infusion systems, a clinical workflow software provides an end-to-end medication workflow programming.
- Interoperability software- Interoperability software provides bidirectional communication of data between the electronic health records (EHR)/electronic medical record (EMR) and the pump. The interoperability between a smart pump and the EMR of the hospital/health facility enables a wireless, bidirectional connection which allows the infusion information by the EMR to program infusion devices in advance, reducing opportunities for manual programming errors.
[146 Pages Report] The market for infusion pump software is expected to grow from USD 742 million in 2019 to USD 1,044 million by 2024, at a CAGR of 7.1% during the forecast period. Growth in the infusion pump software market is primarily driven by factors such as rising levels of environmental pollution worldwide, increasing government regulations and initiatives for environmental protection, privatization of Environmental Testing services, and increasing focus on wastewater treatment.
By Type, the DERS segment is expected to grow at the highest rate during the forecast period
On the basis of type, the infusion pump software market is segmented into Dose error reduction software (DERS), clinical workflow software, interoperability software and other software. The DERS segment is expected to dominate the market during the forecast period. DERS functions with the aid of the drug library which is inbuilt with the infusion pump. This software offers advanced safety features for infusion pumps and hence are estimated to grow owing to the increasing number of medication errors using infusion pumps.
General Infusion segment held the largest share of the infusion pump software market in 2018
Infusion pump software is widely used to test the quality of drinking water, screen pesticides, and assess soil samples for contamination. The infusion pump software indications market is segmented into general infusion, pain & anesthesia management, insulin infusion, chemotherapy, enteral infusion, and others. The general infusion segment held the largest share of the market in 2018, a trend that is expected to continue during the forecast period. The large share of this segment can be attributed to the safety and efficacy provided by infusion systems for the suitable delivery of medication in patients for the various general health conditions.
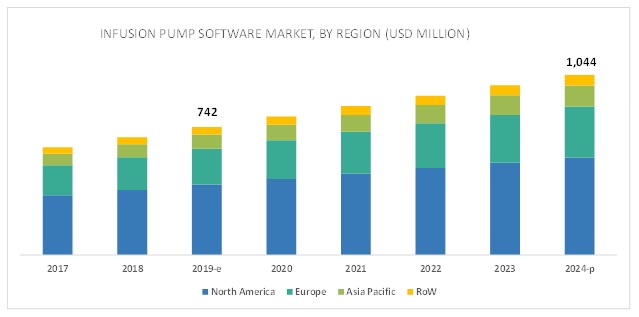
North America is expected to hold a significant share in the infusion pump software market during the forecast period
Factors such as the high adoption of specialty infusion pumps and software for treatment of chronic disease, increasing prevalence of chronic diseases along with rising ageing population, and presence of many large hospitals are driving the growth of the infusion pump software market in North America.
The major vendors in the global infusion pump software market are BD (US), B. Braun (Germany), Baxter (US), ICU Medical (US), Terumo Medical (Japan), Fresenius Kabi (Germany), Moog (US), F. Hoffmann-La Roche (Switzerland), Ypsomed (Switzerland), Medtronic (Ireland), Smiths Medical (US), and Micrel Medical Devices (Greece).
Scope of the report
|
Report Metric |
Details |
|
Market size available for years |
2017-2024 |
|
Base year considered |
2018 |
|
Forecast period |
2019-2024 |
|
Forecast units |
Value (USD) |
|
Segments covered |
Type, End User, Indication, and Region |
|
Geographies covered |
North America (US & Canada), Europe (UK, Germany, France, RoE), APAC (China, Japan, India, RoAPAC), RoW |
|
Companies covered |
Thermo Fisher Scientific Inc. (US), Agilent Technologies (US), Shimadzu (Japan). Major 10 players covered. |
This research report categorizes the infusion pump software market based on type, indication, end user, and region.
On the basis of Type, the Infusion Pump Software market has been segmented as follows:
- Dose Error Reduction Software (DERS)
- Interoperability Software
- Clinical Workflow Software
On the basis of Indication, the Infusion Pump Software market has been segmented as follows:
- General Infusion
- Pain and Anesthesia Management
- Insulin Infusion
- Chemotherapy
- Enteral Infusion
On the basis of End User, the Infusion Pump Software market has been segmented as follows:
- Hospitals
- Ambulatory Centers Settings
- Home Healthcare Settings
- Academic & Research Institutes
On the basis of Region, the Infusion Pump Software market has been segmented as follows:
- North America
- US
- Canada
- Europe
- Germany
- France
- UK
- RoE
- Asia Pacific
- China
- Japan
- India
- RoAPAC
- Rest of the World
Recent Developments
- In March 2018, Baxter partnered with First Databank (FDB), US, with the aim of integrating FDB�s Infusion Knowledge, an evidence-based library of IV medications, into Baxter�s Dose IQ Safety Software to help make delivery of infusions safer.
- In August 2017, BS expanded in the US with the launch of BD Institute for Medication Management Excellence in New Jersey, which aims to improve patient safety and outcomes. In collaboration with national experts and IV safety organizations, this new institute would initially focus on enhancing end-to-end IV infusion Safety at the patient's bedside.
Key questions addressed by the report:
- Which of the software segment will dominate the infusion pump software market in the next five years?
- Emerging countries have immense opportunities for the growth and adoption of infusion pump software, will this scenario continue in the next five years?
- Increasing availability and awareness of advanced technology in the emerging market is impacting the growth for developed markets. How will the pricing difference impact the overall market?
- What are the upcoming technologies in the infusion pump software market?
To speak to our analyst for a discussion on the above findings, click Speak to Analyst
 Exclusive indicates content/data unique to MarketsandMarkets and not available with any competitors.
Table of Contents
1 Introduction (Page No. - 14)
1.1 Objectives of the Study
1.2 Market Definition
1.3 Market Scope
1.3.1 Markets Covered
1.3.2 Years Considered for the Study
1.4 Currency
1.5 Limitations
1.6 Stakeholders
2 Research Methodology (Page No. - 18)
2.1 Research Data
2.1.1 Secondary Data
2.1.1.1 Secondary Sources
2.1.2 Primary Data
2.1.3 Primary Sources
2.1.3.1 Key Insights From Primary Sources
2.1.3.2 Market Size Estimation Methodology
2.1.4 Market Data Estimation and Triangulation
2.2 Assumptions
3 Executive Summary (Page No. - 28)
4 Premium Insights (Page No. - 32)
4.1 Infusion Pump Software Market Overview
4.2 Geographic Analysis: European Infusion Pump Software Market Share, By Type, 2019
4.3 Infusion Pump Software Market Share, By Indication, 2019 vs. 2024
4.4 Infusion Pump Software Market Share, By Type, 2019 vs. 2024
4.5 Infusion Pump Software Market Share, By End User, 2019 vs. 2024
4.6 Infusion Pump Software Market: Geographical Snapshot
5 Market Overview (Page No. - 36)
5.1 Introduction
5.2 Market Dynamics
5.2.1 Market Drivers
5.2.1.1 Increasing Incidence of Chronic Diseases and Rapid Growth in Geriatric Population
5.2.1.2 Growing Number of Surgical Procedures Performed
5.2.1.3 Rising Demand for Ambulatory and Home Care Infusion Pumps
5.2.1.4 Technological Developments
5.2.2 Market Restraints
5.2.2.1 Frequent Product Recalls of Infusion Pumps
5.2.3 Market Opportunities
5.2.3.1 Untapped Emerging Markets
5.2.3.2 Growing Adoption of Specialty Infusion Systems
5.2.4 Challenges
5.2.4.1 Increasing Incidence of Medication Errors and Lack of Wireless Connectivity in Most Hospitals
6 Infusion Pump Software Market, By Type (Page No. - 43)
6.1 Introduction
6.2 Dose Error Reduction Software (DERS)
6.2.1 Increasing Incidence of Medication Errors is Driving the Demand for DERS in Infusion Pumps
6.3 Clinical Workflow Software
6.3.1 Clinical Workflow Software Enables Automation of the Entire Process of A Patient�s Assessment and Treatment
6.4 Interoperability Software
6.4.1 Interoperability Software Helps in Reducing Manual Programming Errors
6.5 Others
7 Infusion Pump Software Market, By Indication (Page No. - 50)
7.1 Introduction
7.2 General Infusion
7.2.1 Availability of Safer and Efficient Infusion Pumps to Propel the Market for General Infusion
7.3 Pain & Anesthesia Management
7.3.1 High Incidence of Chronic Pain Will Drive the Market for Pain Management
7.4 Insulin Infusion
7.4.1 Significant Increase in the Global Prevalence of Diabetes Will Drive Market Growth
7.5 Chemotherapy
7.5.1 Demand for Controlled and Targeted Delivery of Medication to Drive the Chemotherapy Market
7.6 Enteral Infusion
7.6.1 Infusion Pumps Facilitate Continuous and Controlled Parenteral Flow
7.7 Other Indications
8 Infusion Pump Software Market, By End User (Page No. - 59)
8.1 Introduction
8.2 Hospitals
8.2.1 Hospitals Dominate the Infusion Pump Software Market, By End User
8.3 Ambulatory Care Settings
8.3.1 Need to Reduce Healthcare Expenditure has Boosted the Preference for Ambulatory Care
8.4 Home Care Settings
8.4.1 Rising Acceptance and Cost-Efficiency of Home Care Products Have Driven their Use
8.5 Academic & Research Institutes
8.5.1 Rising Drug Discovery Activity and Incidence of Medication Errors is Driving Market Growth
9 Infusion Pump Software Market, By Region (Page No. - 66)
9.1 Introduction
9.2 North America
9.2.1 US
9.2.1.1 US is the Largest Market for Infusion Pump Software
9.2.2 Canada
9.2.2.1 Favorable Reimbursement Scenario for Infusion Pumps to Propel the Market in Canada
9.3 Europe
9.3.1 Germany
9.3.1.1 Germany is the Fastest-Growing Market for Infusion Pump Software in Europe
9.3.2 France
9.3.2.1 The Healthcare System in France is Among the Best in the World
9.3.3 UK
9.3.3.1 High Number of Medication Errors in the UK to Drive Market Growth
9.3.4 RoE
9.4 APAC
9.4.1 China
9.4.1.1 Growing Investments in Healthcare Infrastructure to Support Market Growth
9.4.2 Japan
9.4.2.1 Rapid Growth in the Geriatric Population and the Rising Prevalence of Age-Related Illnesses to Drive Market Growth
9.4.3 India
9.4.3.1 High Prevalence of Lifestyle Diseases to Drive the Market for Infusion Pump Software
9.4.4 RoAPAC
9.5 Rest of the World
10 Competitive Landscape (Page No. - 104)
10.1 Overview
10.1.1 Market Ranking of Players, 2018
10.2 Competitive Leadership Mapping
10.2.1 Visionary Leaders
10.2.2 Innovators
10.2.3 Dynamic Differentiators
10.2.4 Emerging Companies
10.3 Competitive Scenario
10.3.1 Product Launches
10.3.2 Expansions
10.3.3 Partnerships, Agreements, and Collaborations
10.3.4 Acquisitions
11 Company Profiles (Page No. - 112)
11.1 Becton, Dickinson and Company (BD)
11.2 B. Braun Melsungen AG (B. Braun)
11.3 Baxter International Inc. (Baxter)
11.4 Fresenius Kabi
11.5 ICU Medical, Inc. (ICU Medical)
11.6 Medtronic Plc (Medtronic)
11.7 Moog Inc. (Moog)
11.8 Smiths Medical (A Division of Smiths Group Plc)
11.9 Terumo Corporation
11.10 Roche Diagnostics (A Division of F. Hoffmann- La Roche Ltd.)
11.11 Ypsomed AG (Ypsomed)
11.12 Micrel Medical Devices
12 Appendix (Page No. - 140)
12.1 Discussion Guide
12.2 Knowledge Store: Marketsandmarkets� Subscription Portal
12.3 Available Customizations
12.4 Related Reports
12.5 Author Details
List of Tables (69 Tables)
Table 1 Indicative List of Product Recalls for Infusion Pump Software (2015�2017)
Table 2 Infusion Pump Software Market, By Type, 2017�2024 (USD Million)
Table 3 Market, By Region, 2017�2024 (USD Million)
Table 4 Market for Ders, By Region, 2017�2024 (USD Million)
Table 5 Infusion Pump Clinical Workflow Software Market, By Region, 2017�2024 (USD Million)
Table 6 Infusion Pump Interoperability Software Market, By Region, 2017�2024 (USD Million)
Table 7 Other Infusion Pump Software Market, By Region, 2017�2024 (USD Million)
Table 8 Market, By Indication, 2017�2024 (USD Million)
Table 9 Market for General Infusion, By Region, 2017�2024 (USD Million)
Table 10 Market for Pain & Anesthesia Management, By Region, 2017�2024 (USD Million)
Table 11 Market for Insulin Infusion, By Region, 2017�2024 (USD Million)
Table 12 Market for Chemotherapy, By Region, 2017�2024 (USD Million)
Table 13 Market for Enteral Infusion, By Region,2017�2024 (USD Million)
Table 14 Market for Other Indications, By Region, 2017�2024 (USD Million)
Table 15 Market, By End User, 2017�2024 (USD Million)
Table 16 Market for Hospitals, By Region, 2017�2024 (USD Million)
Table 17 Market for Ambulatory Care Settings, By Region, 2017�2024 (USD Million)
Table 18 Market for Home Care Settings, By Region, 2017�2024 (USD Million)
Table 19 Market for Academic & Research Institutes, By Region, 2017�2024 (USD Million)
Table 20 Market, By Region, 2017�2024 (USD Million)
Table 21 North America: Market, By Country, 2017�2024 (USD Million)
Table 22 North America: Market, By Type, 2017�2024 (USD Million)
Table 23 North America: Market, By Indication, 2017�2024 (USD Million)
Table 24 North America: Market, By End User, 2017�2024 (USD Million)
Table 25 US: Market, By Type, 2017�2024 (USD Million)
Table 26 US: Market, By Indication, 2017�2024 (USD Million)
Table 27 US: Market, By End User, 2017�2024 (USD Million)
Table 28 Canada: Market, By Type, 2017�2024 (USD Million)
Table 29 Canada: Market, By Indication, 2017�2024 (USD Million)
Table 30 Canada: Market, By End User, 2017�2024 (USD Million)
Table 31 Europe: Market, By Country, 2017�2024 (USD Million)
Table 32 Europe: Market, By Type, 2017�2024 (USD Million)
Table 33 Europe: Market, By Indication, 2017�2024 (USD Million)
Table 34 Europe: Market, By End User, 2017�2024 (USD Million)
Table 35 Germany: Market, By Type, 2017�2024 (USD Million)
Table 36 Germany: Market, By Indication, 2017�2024 (USD Million)
Table 37 Germany: Market, By End User, 2017�2024 (USD Million)
Table 38 France: Market, By Type, 2017�2024 (USD Million)
Table 39 France: Market, By Indication, 2017�2024 (USD Million)
Table 40 France: Market, By End User, 2017�2024 (USD Million)
Table 41 UK: Market, By Type, 2017�2024 (USD Million)
Table 42 UK: Market, By Indication, 2017�2024 (USD Million)
Table 43 UK: Market, By End User, 2017�2024 (USD Million)
Table 44 RoE: Market, By Type, 2017�2024 (USD Million)
Table 45 RoE: Market, By Indication, 2017�2024 (USD Million)
Table 46 RoE: Market, By End User, 2017�2024 (USD Million)
Table 47 Asia Pacific Market, By Country, 2017�2024 (USD Million)
Table 48 Asia Pacific: Market, By Type, 2017�2024 (USD Million)
Table 49 Asia Pacific: Market, By Indication, 2017�2024 (USD Million)
Table 50 Asia Pacific: Market, By End User, 2017�2024 (USD Million)
Table 51 China: Market, By Type, 2017�2024 (USD Million)
Table 52 China: Market, By Indication, 2017�2024 (USD Million)
Table 53 China: Market, By End User, 2017�2024 (USD Million)
Table 54 Japan: Market, By Type, 2017�2024 (USD Million)
Table 55 Japan: Market, By Indication, 2017�2024 (USD Million)
Table 56 Japan: Market, By End User, 2017�2024 (USD Million)
Table 57 India: Market, By Type, 2017�2024 (USD Million)
Table 58 India: Market, By Indication, 2017�2024 (USD Million)
Table 59 India: Market, By End User, 2017�2024 (USD Million)
Table 60 RoAPAC : Market, By Type, 2017�2024 (USD Million)
Table 61 RoAPAC : Market, By Indication, 2017�2024 (USD Million)
Table 62 RoAPAC : Market, By End User, 2017�2024 (USD Million)
Table 63 RoW: Market, By Type, 2017�2024 (USD Million)
Table 64 RoW: Market, By Indication, 2017�2024 (USD Million)
Table 65 RoW: Market, By End User, 2017�2024 (USD Million)
Table 66 Product Launches and Approvals
Table 67 Expansions
Table 68 Partnerships, Agreements, and Collaborations
Table 69 Acquisitions
List of Figures (41 Figures)
Figure 1 Research Methodology Steps
Figure 2 Research Design
Figure 3 Breakdown of Primary Interviews: By Company Type, Designation, and Region
Figure 4 Market : Bottom-Up Approach
Figure 5 Market: Top-Down Approach
Figure 6 Data Triangulation Methodology
Figure 7 Market, By Type, 2019 vs. 2024 (USD Million)
Figure 8 Market Share, By Indication, 2019 vs. 2024 (USD Million)
Figure 9 Market Share, By End User, 2018
Figure 10 Geographical Snapshot of the Infusion Pump Software Market
Figure 11 Increasing Incidence of Chronic Diseases to Drive the Growth of the Market During the Forecast Period
Figure 12 Germany to Account for the Largest Share in the European Infusion Pump Software Market in 2019
Figure 13 General Infusion Segment to Dominate the Infusion Pump Software Market During the Forecast Period
Figure 14 DERS Segment to Account for the Dominant Share of the Market in 2019
Figure 15 Hospitals to Dominate the Infusion Pump Software Market in 2024
Figure 16 APAC to Register the Highest CAGR During the Forecast Period
Figure 17 Infusion Pump Software Market: Drivers, Restraints, Opportunities, and Challenges
Figure 18 Global Cancer Incidence, 2008�2030
Figure 19 Estimated Diabetic Population, By Region, 2015 vs. 2040
Figure 20 DERS Segment to Witness the Highest Growth in the Infusion Pump Software Market During the Forecast Period
Figure 21 Insulin Infusion Segment to Grow at the Highest CAGR During the Forecast Period
Figure 22 Hospitals to Account for the Largest Share in the Infusion Pump Software Market in 2018
Figure 23 North America Accounted for the Largest Share of the Infusion Pump Software Market in 2018
Figure 24 North America: Market Snapshot
Figure 25 Europe: Market Snapshot
Figure 26 APAC: Market Snapshot
Figure 27 RoW: Market Snapshot
Figure 28 Key Developments in the Infusion Pump Software Market Between 2016 and 2018
Figure 29 Market Ranking, By Key Player
Figure 30 Market, Competitive Leadership Mapping, 2018
Figure 31 Becton, Dickinson and Company: Company Snapshot (2018)
Figure 32 B. Braun: Company Snapshot (2017)
Figure 33 Baxter: Company Snapshot (2017)
Figure 34 Fresenius Kabi: Company Snapshot (2017)
Figure 35 ICU Medical: Company Snapshot (2017)
Figure 36 Medtronic: Company Snapshot (2017)
Figure 37 Moog: Company Snapshot (2018)
Figure 38 Smiths Medical: Company Snapshot (2018)
Figure 39 Terumo Corporation: General Hospital Company Segment Snapshot (2017)
Figure 40 Roche: Company Snapshot (2018)
Figure 41 Ypsomed: Company Snapshot (2017)
The study involved four major activities to estimate the current market size for infusion pump software. Exhaustive secondary research was done to collect information on the market and its different subsegments. The next step was to validate these findings, assumptions, and sizing with industry experts across value chain through primary research. Both top-down and bottom-up approaches were employed to estimate the complete market size. Thereafter market breakdown and data triangulation was used to estimate the market size of segments and subsegments
Secondary Research
In the secondary research process, various secondary sources such as Hoovers, D&B, Bloomberg Business, and Factiva have been referred to, so as to identify and collect information for this study. These secondary sources included annual reports, press releases & investor presentations of companies, white papers, certified publications, articles by recognized authors, gold standard & silver standard websites, regulatory bodies, and databases.
Primary Research
The infusion pump software market comprises several stakeholders such as infusion pump software manufacturing & developing companies, suppliers & distributors of infusion pump software, third party vendors, research institutes and academic centers, hospitals, clinics, ambulatory centers, home healthcare companies, market research companies. Various primary sources from both, the supply and demand sides of the market were interviewed to obtain qualitative and quantitative information. Following the breakdown of primary respondents
To know about the assumptions considered for the study, download the pdf brochure
Market Size Estimation
Both top-down and bottom-up approaches were used to estimate and validate the total size of the infusion pump software market. These methods were also used extensively to estimate the size of various subsegments in the market. The research methodology used to estimate the market size includes the following:
- The key players in the industry and markets have been identified through extensive secondary research
- The industry�s supply chain and market size, in terms of value, have been determined through primary and secondary research processes
- All percentage shares, splits, and breakdowns have been determined using secondary sources and verified through primary sources
Data Triangulation
After arriving at the overall market size-using the market size estimation processes as explained above-the market was split into several segments and subsegments. In order to complete the overall market engineering process and arrive at the exact statistics of each market segment and subsegment, the data triangulation and market breakdown procedures were employed, wherever applicable. The data was triangulated by studying various factors and trends from both, the demand and supply sides, in the infusion pump software industry.
Report Objectives
- To define, describe, and measure the global infusion pump software market by type, indication, end user, and region
- To provide detailed information about major factors influencing market growth (such as drivers, restraints, growth opportunities, and challenges)
- To strategically analyze micromarkets with respect to individual growth trends, prospects, and contributions to the global infusion pumps software market
- To analyze market opportunities for stakeholders and provide details of the competitive landscape for key players
- To forecast the size of the market in North America, Europe, Asia Pacific (APAC), and the Rest of the world (RoW)
- To strategically analyze the market structure and profile key players and their core competencies in the global infusion pump software market
- To track and analyze competitive developments such as product launches & approvals, expansions, partnerships, agreements & collaborations, and other developments; in the infusion pump software market.
Available Customizations
With the given market data, MarketsandMarkets offers customizations as per the company�s specific needs. The following customization options are available for the present global infusion pump software market report:
Product Analysis
- Product matrix which gives a detailed comparison of the software portfolios of the top five companies
Company Information
- Detailed analysis and profiling of additional market players (up to 5)

 Generating Response ...


Growth opportunities and latent adjacency in Infusion Pump Software Market