5.2 MARKET DYNAMICS
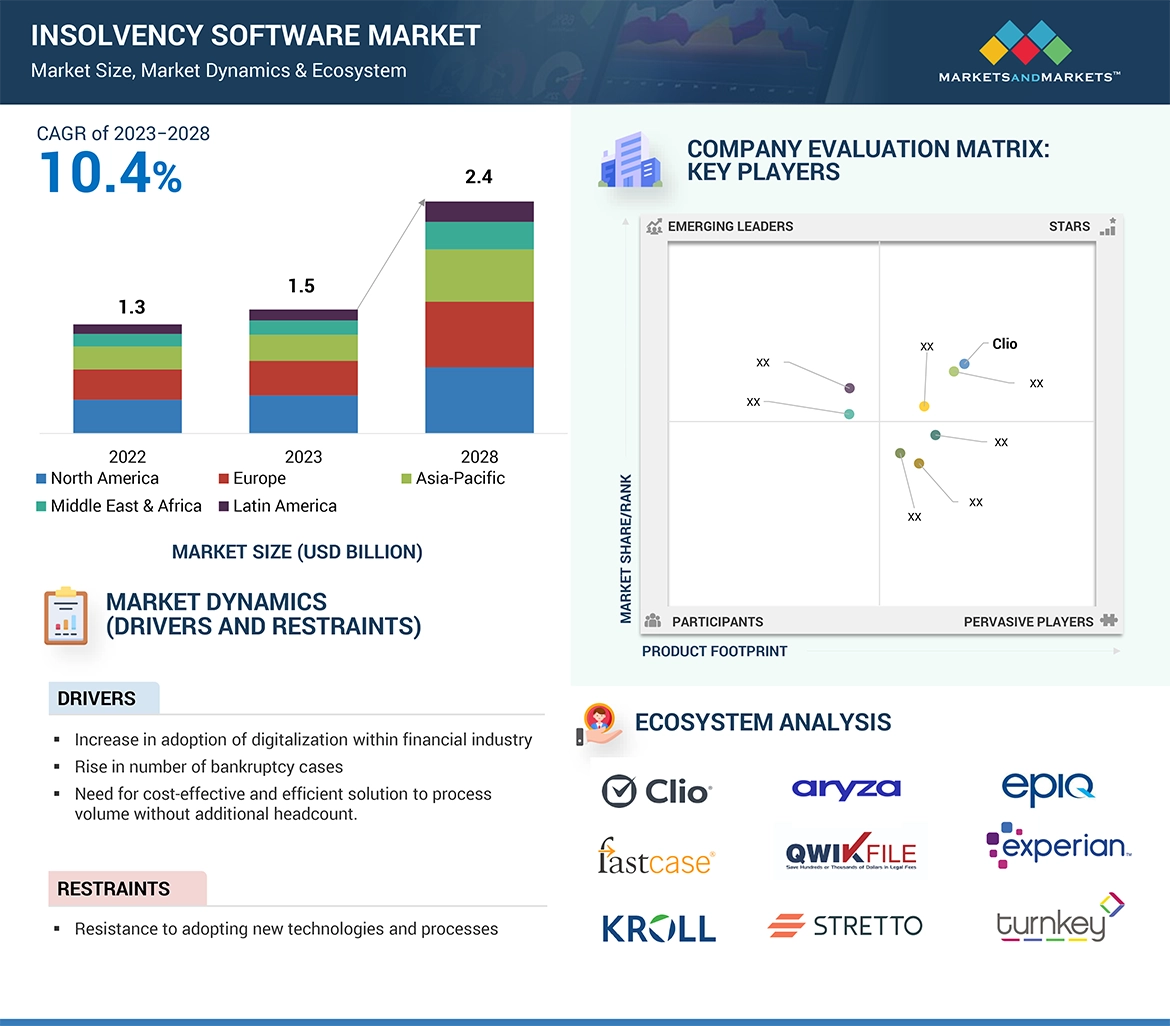
DRIVERS
- Increase in adoption of digitalization within financial industry
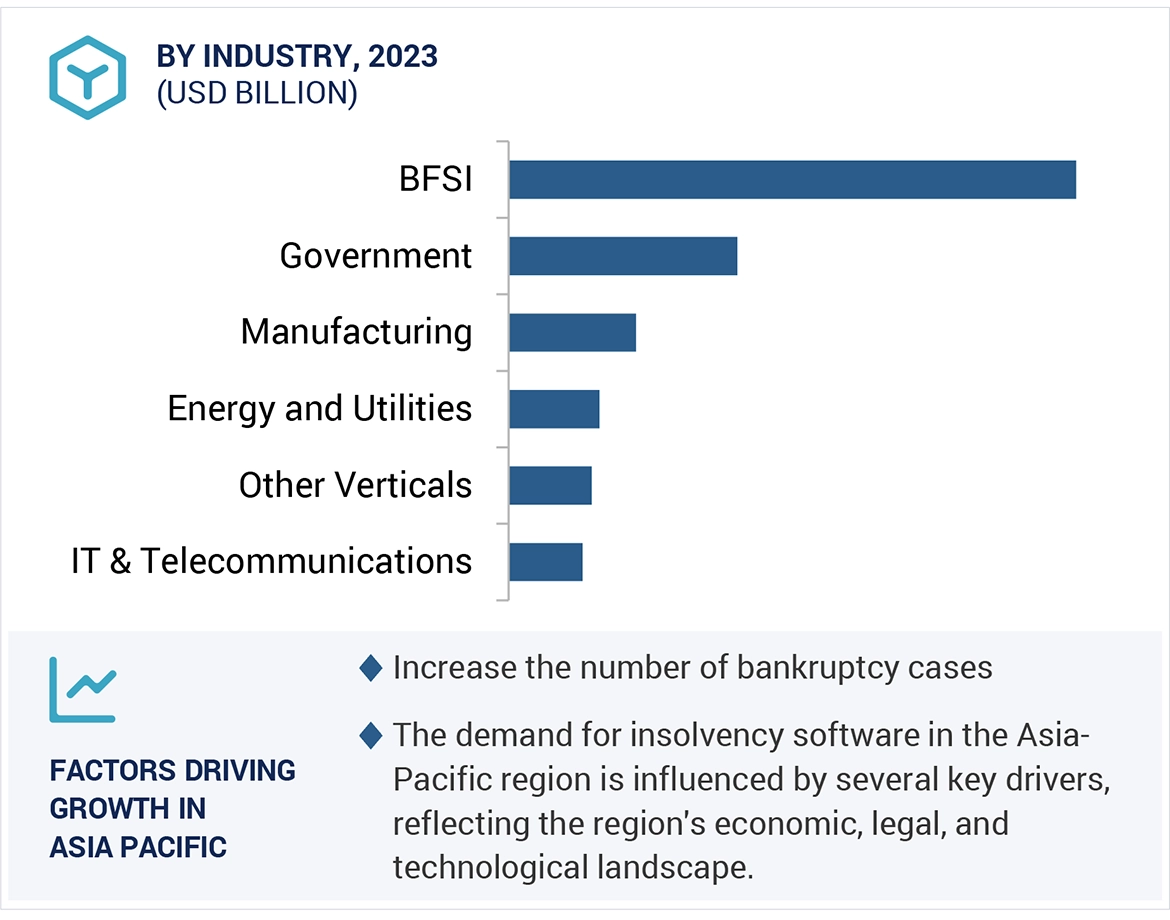
- Rise in number of bankruptcy cases
- Need for cost-effective and efficient solution to process volume without additional headcount
- Growth in demand for automated tools to make well-informed decisions
RESTRAINTS
- Resistance to shift away from legacy systems
OPPORTUNITIES
- Ongoing trend for digitalization in IT industry
- Increase in automation to boost adoption of emerging technology
- Rise in demand for software automation and innovative applications
CHALLENGES
- Lack of data privacy and safety
- Maintaining compliance in changing regulatory landscape
- Need for third-party providers to enable and manage technology and hosting aspects
5.3 INDUSTRY TRENDS
BRIEF HISTORY OF INSOLVENCY SOFTWARE MARKET
- Early software solutions and transition to Windows-based software
- Integration of legal research
- Automation and workflow management
- Cloud-based advanced analytics solutions
- Data privacy and safety concerns
- Enhancement in software with new emerging technologies
BEST PRACTICES IN INSOLVENCY SOFTWARE MARKET
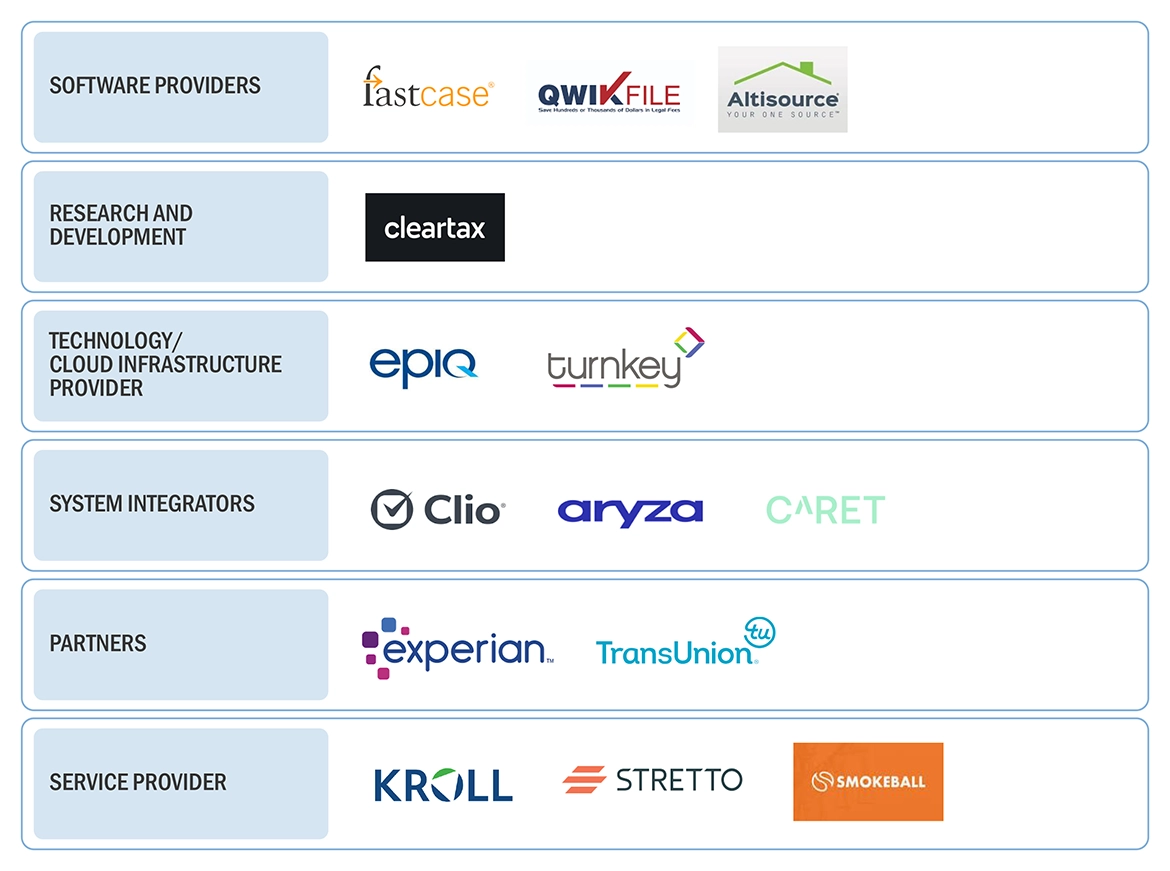
VALUE CHAIN ANALYSIS
ECOSYSTEM MAPPING
PATENT ANALYSIS
- Methodology
- Document type
- Innovation and patent applications
USE CASES
- Aryza Dunning improved Louwman Dealer Group’s debt management system
- Stretto helped Crosby & Fox better its communication systems
- Stretto offered Richard West Law Office its Best Case solution for efficient case-filing
- Stretto’s solutions streamlined Nelson Law Office’s functionalities
PRICING ANALYSIS
- Average selling price trend of key players, by offering
- Indicative pricing analysis of key players, By Solution
TYPE OF CHAPTERS IN INSOLVENCY SOFTWARE
- Chapter 7
- Chapter 11
- Chapter 12
- Chapter 13
- Chapter 15
INSOLVENCY SOFTWARE MARKET: COUNTRY-LEVEL OUTLOOK
- India
- US
- Canada
- European Countries
TECHNOLOGY ANALYSIS
- Adjacent technologies
PORTER’S FIVE FORCES ANALYSIS
- Threat of new entrants
- Threat of substitutes
- Bargaining power of buyers
- Bargaining power of suppliers
- Intensity of competitive rivalry
DISRUPTIONS IMPACTING BUYERS/CUSTOMERS IN INSOLVENCY SOFTWARE MARKET
REGULATORY LANDSCAPE
- International Organization for Standardization 27001
- Basel Committee on Banking Supervision
- DODD-FRANK Act
- Health Insurance Portability and Accountability Act
- General Data Protection Regulation
- Markets in Financial Instruments Directive
- Financial Industry Information Systems
KEY CONFERENCES & EVENTS
KEY STAKEHOLDERS & BUYING CRITERIA
- Key stakeholders in buying process
- Buying criteria
FUTURE DIRECTION OF INSOLVENCY SOFTWARE MARKET
- Insolvency software roadmap till 2030
- Short-term roadmap (2023–2025)
- Mid-term roadmap (2026–2028)
- Long-term roadmap (2029–2030)


Growth opportunities and latent adjacency in Insolvency Software Market