Intensity Modulated Radiotherapy Market by Radiation Type (Photon, Electron Beam, Proton and Carbon-Ion Radiation) Application (Prostate, Lung, Breast), End Users ( Hospitals and Independent Radiotherapy centers), and Region - Global Forecast to 2028
Market Growth Outlook SummaryUpdated on : Aug 22, 2024
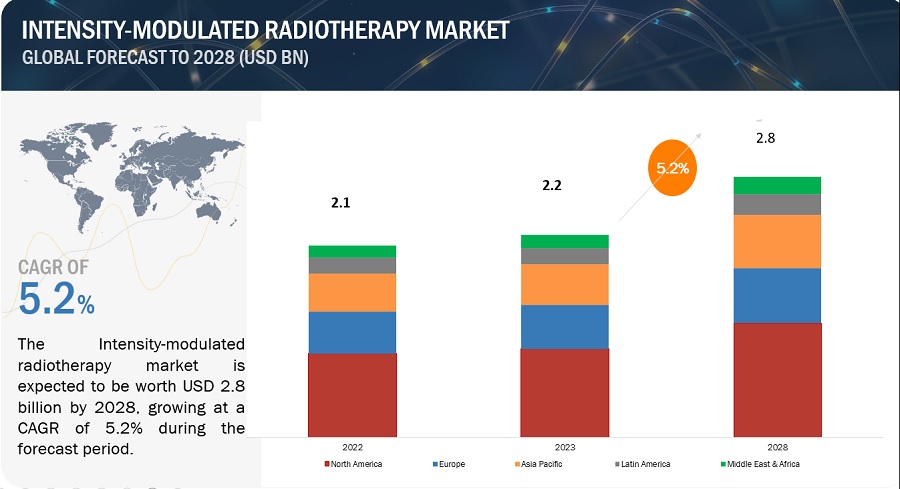
The global intensity modulated radiotherapy market, valued at US$2.1 billion in 2022, is forecasted to grow at a robust CAGR of 5.2%, reaching US$2.2 billion in 2023 and an impressive US$2.8 billion by 2028. The research study consists of an industry trend analysis, pricing analysis, patent analysis, conference and webinar materials, key stakeholders, and buying behaviour in the market.
Rising demand for intensity-modulated interventions and growth in non-invasive treatments of cancer management are a few drivers that collectively contribute to the growth of intensity-modulated radiotherapy, and as healthcare technologies continue to evolve, the demand for intensity-modulated radiotherapy is expected to rise further in the upcoming years. However, higher high cost and availability limits the market growth.
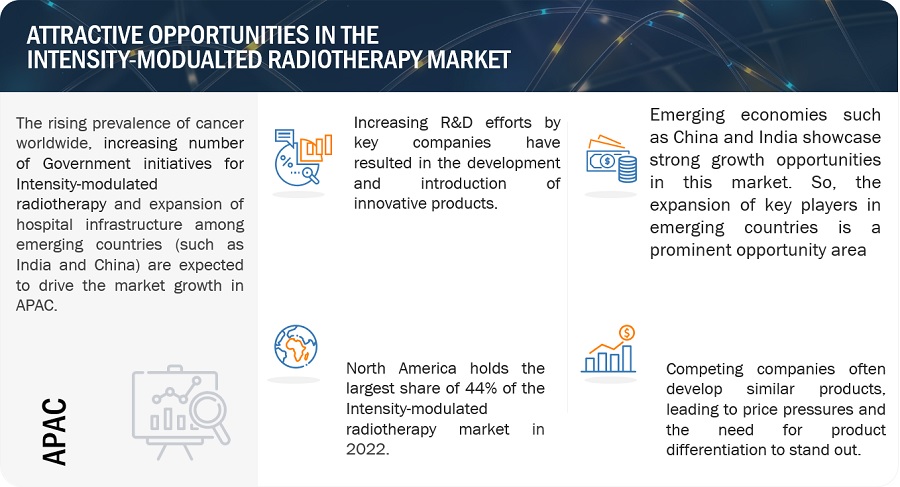
Attractive Opportunities in the Intensity Modulated Radiotherapy Market
To know about the assumptions considered for the study, Request for Free Sample Report
Intensity Modulated Radiotherapy Market Dynamics
Driver: Increase in non-invasive cancer treatments through radiation therapy
Advances in radiation therapy technology have led to more precise and targeted treatments. Techniques such as intensity-modulated radiation therapy (IMRT), stereotactic body radiation therapy (SBRT), and proton therapy allow for highly focused radiation delivery, sparing healthy tissues and minimizing side effects. Unlike surgery, non-invasive radiation therapy does not involve surgical incisions or the removal of tissue. This leads to minimal scarring and shorter recovery times, allowing patients to resume their normal activities more quickly.
Increasing government initiatives for cancer management:
The augmentation of government initiatives for cancer management is driven by a confluence of factors, encompassing imperatives in public health, deliberations of economic significance, advocacy on behalf of patients, commitments on the global stage, and a unified endeavor to bolster healthcare systems and foster health equity. This amalgamation distinctly contributes to the advancement and market elevation of the intensity-modulated radiotherapy market, solidifying its position as a pivotal solution within the broader spectrum of cancer treatment modalities.
In the US, The Centers for Disease Control and Prevention (CDC) administers the NCCCP, which helps states and territories develop and implement cancer control plans. These plans address cancer prevention, early detection, treatment, and survivorship. European countries allocate significant funding for cancer research through national research agencies, such as Cancer Research UK in the United Kingdom and the German Cancer Aid (Deutsche Krebshilfe) in Germany.
Rising cancer patient population:
The upward trajectory of the cancer patient population stems from a multifaceted interplay of interconnected elements that collectively influence individual susceptibility and contribute to the overarching burden of cancer across societies. This intricate amalgamation distinctly contributes to the advancement and market elevation of Intensity-modulated radiotherapy, positioning it as an instrumental solution within the expansive domain of cancer care and treatment.
Restraint: The dearth of skilled radiologist/oncologist:
The scarcity of proficient radiologists and oncologists constitutes a multifaceted challenge underscored by factors including escalating demand, shifting demographics, hurdles in training, work environment considerations, and the imperative for continuous professional advancement. This intricate interplay distinctly contributes to the advancement and market elevation of Intensity-modulated radiotherapy (IMRT), positioning it as an indispensable solution within the realm of oncological care and management.
Affordability and accessibility of treatment:
The accessibility and affordability of cancer treatment are intricately shaped by a multifaceted interplay of variables, including treatment expenditure, insurance provisions, regional discrepancies, supportive service availability, and the financial ramifications of treatment. Collectively, these elements contribute to the delineation of the cancer care landscape, ultimately impacting patients' capacity to obtain and finance essential treatments. This intricate amalgamation distinctly contributes to the advancement and market elevation of Intensity-modulated radiotherapy (IMRT), positioning it as an instrumental solution in addressing the affordability and accessibility aspects within the domain of cancer care.
Complexity of imaging technology for treatments:
The intricacy of imaging technology in the context of cancer treatments is a result of the dynamic interplay between advancing technologies, the imperative for specialized expertise, complexities in data analysis, challenges in seamless treatment integration, and the essentiality of cross-disciplinary collaboration. This synergy of factors collectively molds the framework of imaging-guided cancer treatments, underscoring the heightened capabilities and intricacies within this domain. This distinct interrelation significantly contributes to the advancement and market augmentation of Intensity-modulated radiotherapy (IMRT), positioning it as a pivotal solution that aligns with the complex demands of contemporary cancer care, thus fostering its prominence and adoption.
Opportunity: Rising healthcare expenditure across developing countries:
The rise in healthcare spending in developing countries is driven by a complex interplay of factors like changing demographics, disease trends, improved infrastructure, technological advancements, and healthcare workforce growth. This dynamic interaction shapes the healthcare landscape and guides financial resource allocation for services and treatments. Amid this context, Intensity-modulated radiotherapy (IMRT) emerges as a strategic solution, equipped with advanced capabilities that align with evolving healthcare needs.
Expansion of key players in emerging countries:
Prominent industry leaders are expanding in emerging countries due to untapped markets, strategic collaborations, and adapting expertise to evolving healthcare needs. In this context, Intensity-modulated radiotherapy (IMRT) plays a pivotal role in meeting the healthcare demands of these growing markets.
Challenge: Availability of alternative technology:
Navigating the landscape of alternative technologies poses a challenge for the IGRT market, driven by ongoing technological advancements, the pursuit of superior treatment outcomes, and the competitive dynamics inherent within cancer treatment modalities. Amidst this complexity, the strategic rise and market expansion of Intensity-modulated radiotherapy (IMRT) becomes imperative, as it must effectively align its unique attributes to meet evolving cancer care needs while contending with alternative technological options.
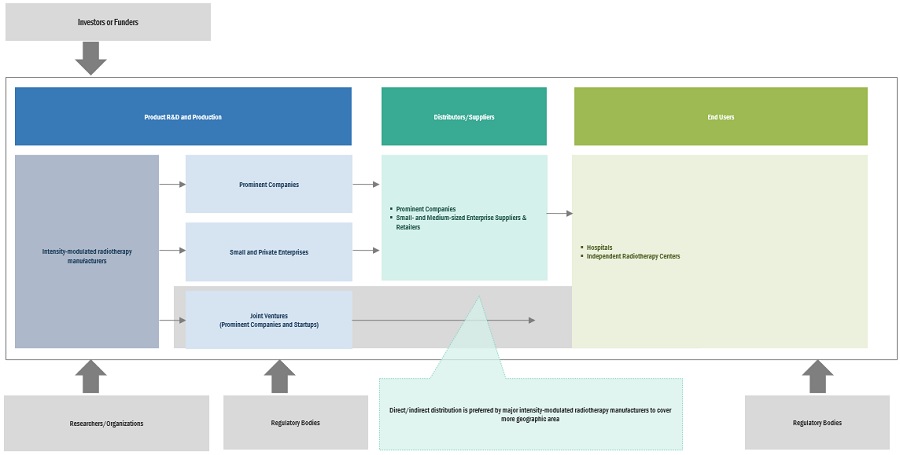
Intensity-Modulated Radiotherapy Market Ecosystem
Major companies in this market include well-established and financially stable suppliers of Intensity-modulated radiotherapy, radiotherapy and imaging technology. Prominent companies in this market include Varian Medical Systems,Inc.(US) Elekta (Sweden), Accuray Incorporated (US), Hitachi (Japan), among several others.
The Brain cancer application segment accounted for the highest CAGR of the intensity modulated radiotherapy industry in 2022-2028
Based on the application, the intensity modulated radiotherapy market is segmented into prostate cancer, breast cancer, lung cancer, brain cancer, gastrointestinal cancer, and other applications. IMRT enable radiologists to perform complex procedures using non-invasive techniques. The integration of Intensity-modulated radiotherapy (IMRT) within brain cancer treatment is substantiated by its adeptness in navigating the intricacies of brain anatomy, mitigating treatment-associated uncertainties, tailoring treatment regimens, and synergizing with evolving therapeutic frameworks. This amalgamation of attributes significantly amplifies the advancement and prominence of IMRT within the context of the brain cancer application segment, thereby augmenting its strategic position in the broader market of radiation therapy.
Hospitals to register for the highest growth rate of the intensity modulated radiotherapy industry in 2022-2028
The end users in the intensity modulated radiotherapy market are hospitals and independent radiotherapy centers. Hospitals are expected to dominate the market during the forecast period. Hospitals mainly have larger budgets, more advanced technology, and a broader range of medical specialties, which can facilitate the adoption and utilization of IMRT. Hospitals often have established referral networks with primary care physicians, specialists, and other healthcare providers. These networks can lead to more patients being referred to hospital-based radiation oncology departments, increasing the use of IMRT
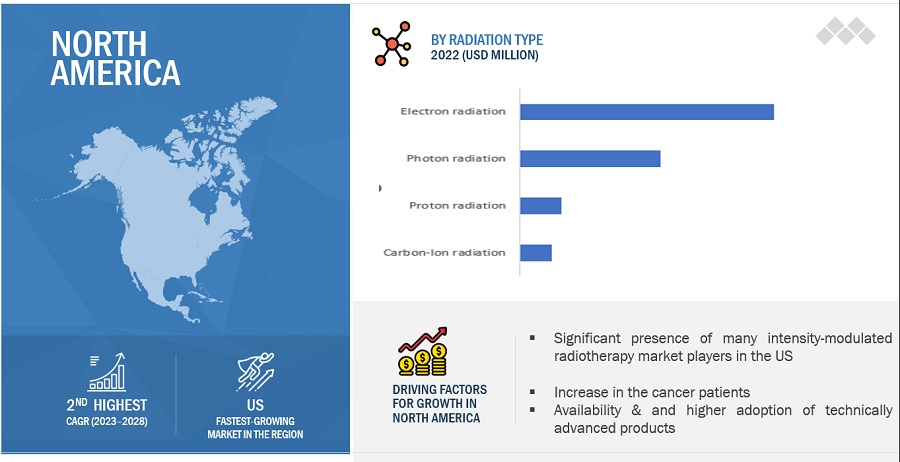
North America is expected to be the largest market for the intensity modulated radiotherapy industry during the forecast period.
North America, comprising the US and Canada, held the largest share of the intensity modulated radiotherapy market in 2022. With its resilient healthcare infrastructure and access to cut-throat medical technologies, North America provides an ideal setting for the adoption of sophisticated treatment methodologies like Intensity-modulated radiotherapy (IMRT).
To know about the assumptions considered for the study, download the pdf brochure
As of 2022, prominent players in the market are Elekta (Sweden), Accuray Incorporated (US), Varian Medical Systems (US), and Hitachi (Japan), among others.
Scope of the Intensity Modulated Radiotherapy Industry:
|
Report Metric |
Details |
|
Market Revenue in 2023 |
$2.2 billion |
|
Estimated Value by 2028 |
$2.8 billion |
|
Revenue Rate |
Poised to grow at a CAGR of 5.2% |
|
Market Driver |
Increase in non-invasive cancer treatments through radiation therapy |
|
Market Opportunity |
Rising healthcare expenditure across developing countries |
This report has segmented the global intensity modulated radiotherapy market to forecast revenue and analyze trends in each of the following submarkets:
By Radiation Type
- Proton radiation
- Electron radiation
- Photon radiation
- Carbon-Ion radiation
By Application
- Prostate cancer
- Lung cancer
- Breast cancer
- Brain cancer
- Gynecological cancers
- Gastrointestinal cancers
- Other cancers
By End User
- Hospitals
- Independent Radiotherapy Centers
By region
-
North America
- US
- Canada
-
Europe
- Germany
- France
- UK
- Italy
- Spain
- Rest of Europe
-
Asia Pacific
- Japan
- China
- India
- Australia
- South Korea
- Rest of Asia Pacific
-
Latin America
- Brazil
- Mexico
- MEA
Frequently Asked Questions (FAQ):
What is the projected market revenue value of the global intensity modulated radiotherapy market?
The global intensity modulated radiotherapy market boasts a total revenue value of $2.8 billion by 2028.
What is the estimated growth rate (CAGR) of the global intensity modulated radiotherapy market?
The global intensity modulated radiotherapy market has an estimated compound annual growth rate (CAGR) of 5.2% and a revenue size in the region of $2.2 billion in 2023.
To speak to our analyst for a discussion on the above findings, click Speak to Analyst


- 5.1 INTRODUCTION
-
5.2 MARKET DYNAMICSDRIVERS- Rising prevalence of chronic diseases among all age groups- Advancements in radiation therapy technologies to improve treatment and reduce side effects- Improved patient outcomes and potential cost savings in long run- Reduced infection risk and shorter recovery periods with minimal scarringRESTRAINTS- Dearth of skilled radiologists/oncologists for operating automated radiotherapy equipment- High cost of intensity-modulated radiation therapy systemsOPPORTUNITIES- Rapid economic development and rising healthcare expenditure across emerging economies- Growing government and private investments in cancer treatment- Increased adoption of radiation therapy as primary treatment option for cancerCHALLENGES- Increased risk of radiation exposure for both patients and healthcare staff- Increased competition from alternative treatment modalities
-
5.3 KEY STAKEHOLDERS AND BUYING CRITERIAKEY STAKEHOLDERS IN BUYING PROCESS
-
5.4 PORTER’S FIVE FORCES ANALYSISTHREAT OF NEW ENTRANTSTHREAT OF SUBSTITUTESBARGAINING POWER OF SUPPLIERSBARGAINING POWER OF BUYERSINTENSITY OF COMPETITIVE RIVALRY
-
5.5 REGULATORY ANALYSISUSEUROPEAN COUNTRIESJAPAN
- 5.6 REIMBURSEMENT SCENARIO ANALYSIS
-
5.7 ECOSYSTEM MARKET MAP
-
5.8 VALUE CHAIN ANALYSISTECHNOLOGY INNOVATIONPROCUREMENT AND PRODUCT DESIGNMARKETING, SALES, AND DISTRIBUTION AND POST-SALES SERVICES
-
5.9 SUPPLY CHAIN ANALYSISPROMINENT COMPANIESSMALL & MEDIUM-SIZED COMPANIESEND USERS
- 5.10 PRICING ANALYSIS
-
5.11 PATENT ANALYSIS
- 5.12 TECHNOLOGY ANALYSIS
- 5.13 KEY CONFERENCES AND EVENTS IN 2023–2024
- 6.1 INTRODUCTION
-
6.2 PROSTATE CANCERADVANCEMENTS IN NONINVASIVE RADIATION THERAPY TECHNOLOGY TO DRIVE MARKET
-
6.3 BREAST CANCERLIFESTYLE CHANGES AND FOCUS ON EARLY DETECTION THROUGH SCREENING PROGRAMS TO DRIVE MARKET
-
6.4 LUNG CANCERINCREASING RESEARCH AND CLINICAL TRIAL ACTIVITY TO DRIVE MARKET
-
6.5 GASTROINTESTINAL CANCERRISING CONSUMPTION OF SALT-PRESERVED FOOD AND ALCOHOL TO DRIVE MARKET
-
6.6 BRAIN CANCERNEGLIGENCE IN PRE-SCREENING PROCEDURES TO LIMIT MARKET
- 6.7 OTHER CANCERS
- 7.1 INTRODUCTION
-
7.2 PHOTON RADIATIONRISING CANCER CASES GLOBALLY TO DRIVE MARKET
-
7.3 ELECTRON RADIATIONTECHNIQUE LIMITATIONS AND REDUCED TREATMENT EFFECTIVENESS TO LIMIT ADOPTION
-
7.4 PROTON RADIATIONEASY, PRECISE DOSAGE DELIVERY TO CANCEROUS TISSUES TO DRIVE USAGE
-
7.5 CARBON-ION RADIATIONNEED FOR SPECIALIZED FACILITIES AND TREATMENT ROOMS FOR HEAVY ION-BASED THERAPIES TO LIMIT MARKET
- 8.1 INTRODUCTION
-
8.2 HOSPITALSRAPID ADOPTION OF INVASIVE TECHNOLOGIES AND INCREASED NUMBER OF CANCER PATIENTS TO DRIVE MARKET
-
8.3 INDEPENDENT RADIOTHERAPY CENTERSLOWER OVERHEAD COSTS AND SHORTER WAITING PERIOD TO DRIVE MARKET
- 9.1 INTRODUCTION
-
9.2 NORTH AMERICANORTH AMERICA: RECESSION IMPACTUS- US dominated North American intensity-modulated radiation therapy market in 2022CANADA- Increasing prevalence of cancer and high demand for timely diagnosis to drive market
-
9.3 EUROPEEUROPE: RECESSION IMPACTGERMANY- Increasing geriatric population and rising life expectancy to drive marketFRANCE- Increasing government initiatives for better healthcare practices to drive marketUK- High burden of cancer and rising preference for noninvasive cancer management to drive marketITALY- Increasing geriatric population and rising use of noninvasive cancer treatment methods to drive marketSPAIN- Increasing technological developments in healthcare to drive marketREST OF EUROPE
-
9.4 ASIA PACIFICASIA PACIFIC: RECESSION IMPACTJAPAN- Increased geriatric population and presence of well-established healthcare sector to drive marketCHINA- Growing prevalence of cancer and developing healthcare infrastructure to drive marketINDIA- Increasing target patient population and rising availability of advanced surgical treatments to drive marketAUSTRALIA- Developing healthcare sector with increasing availability of advanced surgical and imaging procedures to drive marketSOUTH KOREA- Growing target cancer patient population and increasing awareness of early cancer diagnosis to drive marketREST OF ASIA PACIFIC
-
9.5 LATIN AMERICALATIN AMERICA: RECESSION IMPACTBRAZIL- Developing healthcare sector and increasing availability of advanced surgical treatments to drive marketMEXICO- Favorable government initiatives and low-cost manufacturing advantages to drive marketREST OF LATIN AMERICA
-
9.6 MIDDLE EAST & AFRICAFAVORABLE GOVERNMENT INITIATIVES AND ECONOMIC GROWTH TO DRIVE MARKETMIDDLE EAST & AFRICA: RECESSION IMPACT

- 10.1 OVERVIEW
- 10.2 KEY STRATEGIES ADOPTED BY MAJOR PLAYERS IN INTENSITY-MODULATED RADIATION THERAPY MARKET
- 10.3 REVENUE SHARE ANALYSIS OF KEY PLAYERS
- 10.4 MARKET SHARE ANALYSIS: INTENSITY-MODULATED RADIATION THERAPY MARKET, BY KEY PLAYER (2022)
-
10.5 COMPANY EVALUATION MATRIX FOR PLAYERS (2022)STARSPERVASIVE PLAYERSEMERGING LEADERSPARTICIPANTS
-
10.6 COMPETITIVE BENCHMARKINGOVERALL COMPANY FOOTPRINTPRODUCT FOOTPRINTREGIONAL FOOTPRINT
-
10.7 COMPETITIVE SCENARIOS AND TRENDS (2020–2023)KEY PRODUCT LAUNCHES AND APPROVALSKEY DEALSOTHER KEY DEVELOPMENTS
-
11.1 SIEMENS HEALTHINEERS AG (VARIAN MEDICAL SYSTEMS, INC.)BUSINESS OVERVIEWPRODUCTS OFFEREDRECENT DEVELOPMENTS- Product launches- Deals- Other developmentsMNM VIEW- Key strengths- Strategic choices- Weaknesses and competitive threats
-
11.2 ELEKTABUSINESS OVERVIEWPRODUCTS OFFEREDRECENT DEVELOPMENTS- Product launches- Deals- Other developmentsMNM VIEW- Key strengths- Strategic choices- Weaknesses and competitive threats
-
11.3 ACCURAY INCORPORATEDBUSINESS OVERVIEWPRODUCTS OFFEREDRECENT DEVELOPMENTS- Product launches- DealsMNM VIEW- Key strengths- Strategic choices- Weaknesses and competitive threats
-
11.4 IBA WORLDWIDEBUSINESS OVERVIEWPRODUCTS OFFEREDRECENT DEVELOPMENTS- Deals
-
11.5 HITACHI, LTD.BUSINESS OVERVIEWPRODUCTS OFFEREDRECENT DEVELOPMENTS- Deals
-
11.6 MEVION MEDICAL SYSTEMSBUSINESS OVERVIEWPRODUCTS OFFEREDRECENT DEVELOPMENTS- Product approvals- Deals
-
11.7 KONINKLIJKE PHILIPS N.V.BUSINESS OVERVIEWPRODUCTS OFFEREDRECENT DEVELOPMENTS- Deals
-
11.8 RAYSEARCH LABORATORIESBUSINESS OVERVIEWPRODUCTS OFFEREDRECENT DEVELOPMENTS- Product launches- Deals- Other developments
-
11.9 BRAINLAB AGBUSINESS OVERVIEW
- 12.1 DISCUSSION GUIDE
- 12.2 KNOWLEDGESTORE: MARKETSANDMARKETS’ SUBSCRIPTION PORTAL
- 12.3 CUSTOMIZATION OPTIONS
- 12.4 RELATED REPORTS
- 12.5 AUTHOR DETAILS
- TABLE 1 INFLUENCE OF STAKEHOLDERS ON BUYING PROCESS FOR INTENSITY-MODULATED RADIATION THERAPY PRODUCTS
- TABLE 2 PORTER’S FIVE FORCES ANALYSIS: INTENSITY-MODULATED RADIATION THERAPY MARKET
- TABLE 3 US: MEDICAL DEVICE REGULATORY APPROVAL PROCESS
- TABLE 4 JAPAN: MEDICAL DEVICE CLASSIFICATION UNDER PMDA
- TABLE 5 CPT CODES FOR MAJOR INTENSITY-MODULATED RADIATION THERAPY PROCEDURES
- TABLE 6 FREESTANDING PER COURSE NATIONAL AVERAGE MEDICARE REIMBURSEMENT, 2021 VS. 2022
- TABLE 7 IMPORTANT PRODUCT LAUNCHES IN INTENSITY-MODULATED RADIATION THERAPY MARKET (JANUARY 2015–JUNE 2022)
- TABLE 8 DETAILED LIST OF KEY CONFERENCES AND EVENTS IN INTENSITY-MODULATED RADIATION THERAPY MARKET (2023–2024)
- TABLE 9 INTENSITY-MODULATED RADIATION THERAPY MARKET, BY APPLICATION, 2021–2028 (USD MILLION)
- TABLE 10 INTENSITY-MODULATED RADIATION THERAPY MARKET FOR PROSTATE CANCER, BY REGION, 2021–2028 (USD MILLION)
- TABLE 11 INTENSITY-MODULATED RADIATION THERAPY MARKET FOR BREAST CANCER, BY REGION, 2021–2028 (USD MILLION)
- TABLE 12 INTENSITY-MODULATED RADIATION THERAPY MARKET FOR LUNG CANCER, BY REGION, 2021–2028 (USD MILLION)
- TABLE 13 INTENSITY-MODULATED RADIATION THERAPY MARKET FOR GASTROINTESTINAL CANCER, BY REGION, 2021–2028 (USD MILLION)
- TABLE 14 INTENSITY-MODULATED RADIATION THERAPY MARKET FOR BRAIN CANCER, BY REGION, 2021–2028 (USD MILLION)
- TABLE 15 INTENSITY-MODULATED RADIATION THERAPY MARKET FOR OTHER CANCERS, BY REGION, 2021–2028 (USD MILLION)
- TABLE 16 INTENSITY-MODULATED RADIATION THERAPY MARKET, BY RADIATION TYPE, 2021–2028 (USD MILLION)
- TABLE 17 INTENSITY-MODULATED RADIATION THERAPY MARKET FOR PHOTON RADIATION, BY REGION, 2021–2028 (USD MILLION)
- TABLE 18 INTENSITY-MODULATED RADIATION THERAPY MARKET FOR ELECTRON RADIATION, BY REGION, 2021–2028 (USD MILLION)
- TABLE 19 INTENSITY-MODULATED RADIATION THERAPY MARKET FOR PROTON RADIATION, BY REGION, 2021–2028 (USD MILLION)
- TABLE 20 INTENSITY-MODULATED RADIATION THERAPY MARKET FOR CARBON-ION RADIATION, BY REGION, 2021–2028 (USD MILLION)
- TABLE 21 INTENSITY-MODULATED RADIATION THERAPY MARKET, BY END USER, 2021–2028 (USD MILLION)
- TABLE 22 INTENSITY-MODULATED RADIATION THERAPY MARKET FOR HOSPITALS, BY REGION, 2021–2028 (USD MILLION)
- TABLE 23 INTENSITY-MODULATED RADIATION THERAPY MARKET FOR INDEPENDENT RADIOTHERAPY CENTERS, BY REGION, 2021–2028 (USD MILLION)
- TABLE 24 INTENSITY-MODULATED RADIATION THERAPY MARKET, BY REGION, 2021–2028 (USD MILLION)
- TABLE 25 NORTH AMERICA: INTENSITY-MODULATED RADIATION THERAPY MARKET, BY COUNTRY, 2021–2028 (USD MILLION)
- TABLE 26 NORTH AMERICA: INTENSITY-MODULATED RADIATION THERAPY MARKET, BY RADIATION TYPE, 2021–2028 (USD MILLION)
- TABLE 27 NORTH AMERICA: INTENSITY-MODULATED RADIATION THERAPY MARKET, BY APPLICATION, 2021–2028 (USD MILLION)
- TABLE 28 NORTH AMERICA: INTENSITY-MODULATED RADIATION THERAPY MARKET, BY END USER, 2021–2028 (USD MILLION)
- TABLE 29 US: INTENSITY-MODULATED RADIATION THERAPY MARKET, BY RADIATION TYPE, 2021–2028 (USD MILLION)
- TABLE 30 CANADA: INTENSITY-MODULATED RADIATION THERAPY MARKET, BY RADIATION TYPE, 2021–2028 (USD MILLION)
- TABLE 31 EUROPE: INTENSITY-MODULATED RADIATION THERAPY MARKET, BY COUNTRY, 2021–2028 (USD MILLION)
- TABLE 32 EUROPE: INTENSITY-MODULATED RADIATION THERAPY MARKET, BY RADIATION TYPE, 2021–2028 (USD MILLION)
- TABLE 33 EUROPE: INTENSITY-MODULATED RADIATION THERAPY MARKET, BY APPLICATION, 2021–2028 (USD MILLION)
- TABLE 34 EUROPE: INTENSITY-MODULATED RADIATION THERAPY MARKET, BY END USER, 2021–2028 (USD MILLION)
- TABLE 35 GERMANY: INTENSITY-MODULATED RADIATION THERAPY MARKET, BY RADIATION TYPE, 2021–2028 (USD MILLION)
- TABLE 36 FRANCE: INTENSITY-MODULATED RADIATION THERAPY MARKET, BY RADIATION TYPE, 2021–2028 (USD MILLION)
- TABLE 37 UK: INTENSITY-MODULATED RADIATION THERAPY MARKET, BY RADIATION TYPE, 2021–2028 (USD MILLION)
- TABLE 38 ITALY: INTENSITY-MODULATED RADIATION THERAPY MARKET, BY RADIATION TYPE, 2021–2028 (USD MILLION)
- TABLE 39 SPAIN: INTENSITY-MODULATED RADIATION THERAPY MARKET, BY RADIATION TYPE, 2021–2028 (USD MILLION)
- TABLE 40 REST OF EUROPE: INTENSITY-MODULATED RADIATION THERAPY MARKET, BY RADIATION TYPE, 2021–2028 (USD MILLION)
- TABLE 41 ASIA PACIFIC: INTENSITY-MODULATED RADIATION THERAPY MARKET, BY COUNTRY, 2021–2028 (USD MILLION)
- TABLE 42 ASIA PACIFIC: INTENSITY-MODULATED RADIATION THERAPY MARKET, BY RADIATION TYPE, 2021–2028 (USD MILLION)
- TABLE 43 ASIA PACIFIC: INTENSITY-MODULATED RADIATION THERAPY MARKET, BY APPLICATION, 2021–2028 (USD MILLION)
- TABLE 44 ASIA PACIFIC: INTENSITY-MODULATED RADIATION THERAPY MARKET, BY END USER, 2021–2028 (USD MILLION)
- TABLE 45 JAPAN: INTENSITY-MODULATED RADIATION THERAPY MARKET, BY RADIATION TYPE, 2021–2028 (USD MILLION)
- TABLE 46 CHINA: INTENSITY-MODULATED RADIATION THERAPY MARKET, BY RADIATION TYPE, 2021–2028 (USD MILLION)
- TABLE 47 INDIA: INTENSITY-MODULATED RADIATION THERAPY MARKET, BY RADIATION TYPE, 2021–2028 (USD MILLION)
- TABLE 48 AUSTRALIA: INTENSITY-MODULATED RADIATION THERAPY MARKET, BY RADIATION TYPE, 2021–2028 (USD MILLION)
- TABLE 49 SOUTH KOREA: INTENSITY-MODULATED RADIATION THERAPY MARKET, BY RADIATION TYPE, 2021–2028 (USD MILLION)
- TABLE 50 REST OF ASIA PACIFIC: INTENSITY-MODULATED RADIATION THERAPY MARKET, BY RADIATION TYPE, 2021–2028 (USD MILLION)
- TABLE 51 LATIN AMERICA: INTENSITY-MODULATED RADIATION THERAPY MARKET, BY COUNTRY, 2021–2028 (USD MILLION)
- TABLE 52 LATIN AMERICA: INTENSITY-MODULATED RADIATION THERAPY MARKET, BY RADIATION TYPE, 2021–2028 (USD MILLION)
- TABLE 53 LATIN AMERICA: INTENSITY-MODULATED RADIATION THERAPY MARKET, BY APPLICATION, 2021–2028 (USD MILLION)
- TABLE 54 LATIN AMERICA: INTENSITY-MODULATED RADIATION THERAPY MARKET, BY END USER, 2021–2028 (USD MILLION)
- TABLE 55 BRAZIL: INTENSITY-MODULATED RADIATION THERAPY MARKET, BY RADIATION TYPE, 2021–2028 (USD MILLION)
- TABLE 56 MEXICO: INTENSITY-MODULATED RADIATION THERAPY MARKET, BY RADIATION TYPE, 2021–2028 (USD MILLION)
- TABLE 57 REST OF LATIN AMERICA: INTENSITY-MODULATED RADIATION THERAPY MARKET, BY RADIATION TYPE, 2021–2028 (USD MILLION)
- TABLE 58 MIDDLE EAST & AFRICA: INTENSITY-MODULATED RADIATION THERAPY MARKET, BY RADIATION TYPE, 2021–2028 (USD MILLION)
- TABLE 59 MIDDLE EAST & AFRICA: INTENSITY-MODULATED RADIATION THERAPY MARKET, BY APPLICATION, 2021–2028 (USD MILLION)
- TABLE 60 MIDDLE EAST & AFRICA: INTENSITY-MODULATED RADIATION THERAPY MARKET, BY END USER, 2021–2028 (USD MILLION)
- TABLE 61 OVERALL FOOTPRINT ANALYSIS: INTENSITY-MODULATED RADIATION THERAPY MARKET
- TABLE 62 PRODUCT FOOTPRINT ANALYSIS: INTENSITY-MODULATED RADIATION THERAPY MARKET
- TABLE 63 REGIONAL FOOTPRINT ANALYSIS: INTENSITY-MODULATED RADIATION THERAPY MARKET
- TABLE 64 KEY PRODUCT LAUNCHES AND APPROVALS
- TABLE 65 KEY DEALS
- TABLE 66 OTHER KEY DEVELOPMENTS
- TABLE 67 SIEMENS HEALTHINEERS AG: COMPANY OVERVIEW
- TABLE 68 ELEKTA: COMPANY OVERVIEW
- TABLE 69 ACCURAY INCORPORATED: COMPANY OVERVIEW
- TABLE 70 IBA WORLDWIDE: COMPANY OVERVIEW
- TABLE 71 HITACHI, LTD.: COMPANY OVERVIEW
- TABLE 72 MEVION MEDICAL SYSTEMS: COMPANY OVERVIEW
- TABLE 73 KONINKLIJKE PHILIPS N.V.: COMPANY OVERVIEW
- TABLE 74 RAYSEARCH LABORATORIES: COMPANY OVERVIEW
- TABLE 75 BRAINLAB AG: COMPANY OVERVIEW
- FIGURE 1 RESEARCH DESIGN
- FIGURE 2 KEY DATA FROM SECONDARY SOURCES
- FIGURE 3 BREAKDOWN OF PRIMARY INTERVIEWS: SUPPLY-SIDE AND DEMAND-SIDE PARTICIPANTS
- FIGURE 4 BREAKDOWN OF PRIMARY INTERVIEWS: BY COMPANY TYPE, DESIGNATION, AND REGION
- FIGURE 5 RESEARCH METHODOLOGY: HYPOTHESIS BUILDING
- FIGURE 6 COMPANY REVENUE ESTIMATION: INTENSITY-MODULATED RADIATION THERAPY MARKET
- FIGURE 7 BOTTOM-UP APPROACH: INTENSITY-MODULATED RADIATION THERAPY MARKET
- FIGURE 8 TOP-DOWN APPROACH: INTENSITY-MODULATED RADIATION THERAPY MARKET
- FIGURE 9 DATA TRIANGULATION METHODOLOGY
- FIGURE 10 INTENSITY-MODULATED RADIATION THERAPY MARKET, BY RADIATION TYPE, 2023 VS. 2028 (USD MILLION)
- FIGURE 11 INTENSITY-MODULATED RADIATION THERAPY MARKET, BY APPLICATION, 2023 VS. 2028 (USD MILLION)
- FIGURE 12 INTENSITY-MODULATED RADIATION THERAPY MARKET, BY END USER, 2023 VS. 2028 (USD MILLION)
- FIGURE 13 INTENSITY-MODULATED RADIATION THERAPY MARKET SHARE, BY REGION, 2022
- FIGURE 14 INCREASING PREVALENCE OF CANCER AND GROWING GERIATRIC POPULATION TO DRIVE MARKET
- FIGURE 15 PHOTON RADIATION AND US COMMANDED LARGEST MARKET SHARE IN 2022
- FIGURE 16 MIDDLE EAST & AFRICA TO REGISTER HIGHEST GROWTH RATE DURING FORECAST PERIOD
- FIGURE 17 DRIVERS, RESTRAINTS, OPPORTUNITIES, AND CHALLENGES: INTENSITY-MODULATED RADIATION THERAPY MARKET
- FIGURE 18 NEW CANCER CASES GLOBALLY, 2020
- FIGURE 19 ECOSYSTEM MARKET MAP: INTENSITY-MODULATED RADIATION THERAPY MARKET
- FIGURE 20 VALUE CHAIN ANALYSIS: INTENSITY-MODULATED RADIATION THERAPY MARKET
- FIGURE 21 SUPPLY CHAIN ANALYSIS: INTENSITY-MODULATED RADIATION THERAPY MARKET
- FIGURE 22 TOP 10 PATENT APPLICANTS IN INTENSITY-MODULATED RADIATION THERAPY MARKET
- FIGURE 23 TOP 10 PATENT OWNERS IN INTENSITY-MODULATED RADIATION THERAPY MARKET
- FIGURE 24 NORTH AMERICA: INTENSITY-MODULATED RADIATION THERAPY MARKET SNAPSHOT
- FIGURE 25 ASIA PACIFIC: INTENSITY-MODULATED RADIATION THERAPY MARKET SNAPSHOT
- FIGURE 26 KEY STRATEGIES ADOPTED BY MAJOR PLAYERS IN INTENSITY-MODULATED RADIATION THERAPY MARKET (2019–2023)
- FIGURE 27 REVENUE SHARE ANALYSIS OF TOP FIVE PLAYERS (2019–2022)
- FIGURE 28 INTENSITY-MODULATED RADIATION THERAPY MARKET SHARE, BY KEY PLAYER, 2022
- FIGURE 29 COMPANY EVALUATION MATRIX FOR PLAYERS IN INTENSITY-MODULATED RADIATION THERAPY MARKET, 2022
- FIGURE 30 SIEMENS HEALTHINEERS AG: COMPANY SNAPSHOT (2022)
- FIGURE 31 ELEKTA: COMPANY SNAPSHOT (2022)
- FIGURE 32 ACCURAY INCORPORATED: COMPANY SNAPSHOT (2022)
- FIGURE 33 IBA WORLDWIDE: COMPANY SNAPSHOT (2022)
- FIGURE 34 HITACHI, LTD.: COMPANY SNAPSHOT (2021)
- FIGURE 35 KONINKLIJKE PHILIPS N.V.: COMPANY SNAPSHOT (2022)
- FIGURE 36 RAYSEARCH LABORATORIES: COMPANY SNAPSHOT (2022)
This study involved the extensive use of both primary and secondary sources. The research process involved the study of various factors affecting the industry to identify the segmentation types, industry trends, key players, competitive landscape, key market dynamics, and key player strategies.
Secondary Research
The secondary research process involves the widespread use of secondary sources, directories, databases (such as Bloomberg Businessweek, Factiva, and D&B Hoovers), white papers, annual reports, company house documents, investor presentations, and SEC filings of companies. Secondary research was used to identify and collect information useful for the extensive, technical, market-oriented, and commercial study of the image-guided radiation therapy market. It was also used to obtain important information about the key players and market classification & segmentation according to industry trends to the bottom-most level and key developments related to market and technology perspectives. A database of the key industry leaders was also prepared using secondary research.
Primary Research
In the primary research process, various sources from both the supply and demand sides were interviewed to obtain qualitative and quantitative information for this report. The primary sources from the supply side include industry experts such as CEOs, vice presidents, marketing and sales directors, technology & innovation directors, and related key executives from various key companies and organizations in the image-guided radiation therapy market. The primary sources from the demand side include medical OEMs, Analytical instrument OEMs, CDMOs, and service providers, among others. Primary research was conducted to validate the market segmentation, identify key players in the market, and gather insights on key industry trends & key market dynamics.
A breakdown of the primary respondents is provided below:
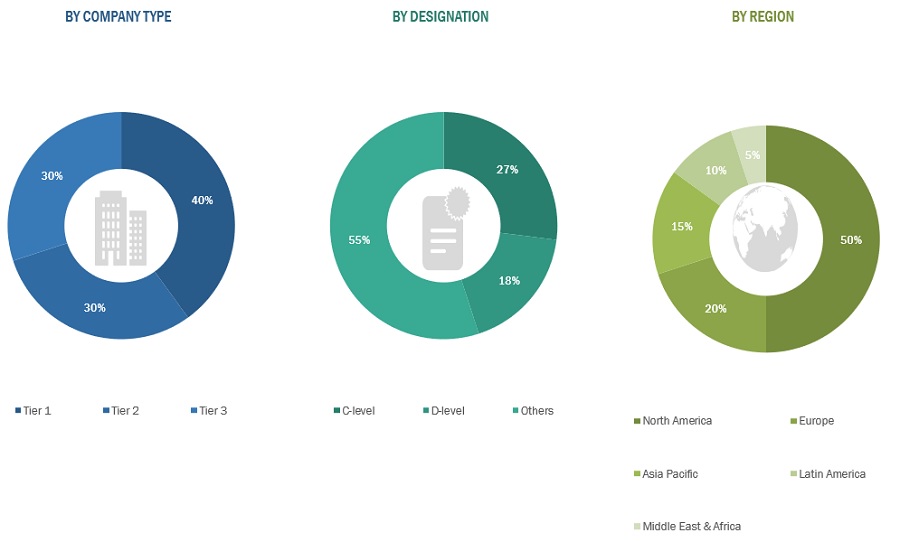
*Others include sales managers, marketing managers, business development managers, product managers, distributors, and suppliers.
Note: Companies are classified into tiers based on their total revenue. As of 2021, Tier 1 = >USD 2 billion, Tier 2 = USD 50 million to USD 2 billion, and Tier 3 = <USD 50 million.
To know about the assumptions considered for the study, download the pdf brochure
Market Estimation Methodology
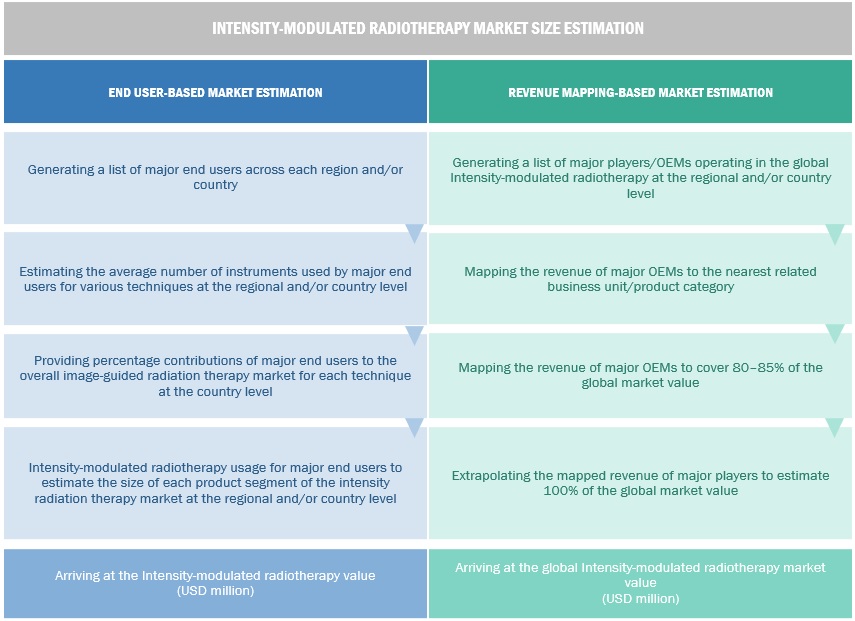
In this report, the global intensity-modulated radiotherapy market size was arrived at by using the revenue share analysis of leading players. For this purpose, key players in the market were identified, and their revenues from the image-guided radiation therapy business were determined through various insights gathered during the primary and secondary research phases. Secondary research included the study of the annual and financial reports of the top market players. In contrast, primary research included extensive interviews with key opinion leaders, such as CEOs, directors, and key marketing executives.
To calculate the global market value, segmental revenues were calculated based on the revenue mapping of major solution/service providers. This process involved the following steps:
- Generating a list of major global players operating in the intensity-modulated radiotherapy market
- Mapping annual revenues generated by major global players from the intensity-modulated radiotherapy market segment (or nearest reported business unit/product category)
- Revenue mapping of key players to cover a major share of the global market, as of 2021
- Extrapolating the global value of the image-guided radiation therapy industry
Data Triangulation
After arriving at the overall market size from the market size estimation process explained above, the global intensity-modulated radiotherapy market was split into segments and subsegments. Data triangulation and market breakdown procedures were employed to complete the overall market engineering process and arrive at the exact statistics for all segments and subsegments. The data was triangulated by studying various factors and trends from both the demand and supply sides. Additionally, the intensity-modulated radiotherapy market was validated using both top-down and bottom-up approaches.
Market Definition
Intensity-Modulated Radiation Therapy (IMRT) is a highly advanced and precise technique in the field of radiation therapy used for the treatment of cancer. IMRT is designed to deliver radiation therapy with greater accuracy and conformality, allowing for more effective tumor targeting while minimizing damage to surrounding healthy tissues.. It combines advanced imaging technology with radiation therapy to enhance the accuracy of treatment and minimize the impact on surrounding healthy tissues.
Key Stakeholders
- Radiotherapy product manufacturers
- Distributors, suppliers, and commercial service providers
- Healthcare service providers
- Clinical research organizations (CROs)
- Radiotherapy service providers
- Radiotherapy product distributors
- Medical research laboratories
- Cancer care centers
- Cancer research organizations
- Academic medical centers and universities
- Market research and consulting firms
Objectives of the Study
- To define, describe, and forecast the Intensity-modulated radiotherapy market based on radiation type, application, end user, and region.
- To provide detailed information regarding the major factors influencing the market growth (such as drivers, restraints, opportunities, and challenges)
- To strategically analyze the micro markets with respect to individual growth trends, prospects, and contributions to the total market.
- To analyze the opportunities in the market for stakeholders and provide details of the competitive landscape for market leaders.
- To profile the key market players and comprehensively analyze their market shares and core competencies.
- To forecast the revenue of the market segments with respect to five main regions, namely, North America (US and Canada), Europe (Germany, France, the UK, Italy, Spain, and Rest of Europe), the Asia Pacific (China, Japan, India, South Korea, Australia, and Rest of Asia Pacific), Latin America (Brazil, Mexico, and Rest of Latin America), and the Middle East & Africa.
- To track and analyze competitive developments such as new product launches and approvals; agreements, partnerships, expansions, acquisitions; and collaborations in the Image-guided radiation therapy market.
Available Customizations
With the given market data, MarketsandMarkets offers customizations as per the company’s specific needs. The following customization options are available for the present global intensity-modulated radiotherapy marketreport:
Product Analysis
- Product matrix, which gives a detailed comparison of the product portfolios of the top thirteen companies.
Company Information
- Detailed analysis and profiling of additional market players (up to 13)
Geographic Analysis
- Further breakdown of the Rest of Europe intensity-modulated radiotherapy marketinto Russia, Belgium, the Netherlands, Switzerland, Austria, Finland, Sweden, Poland, and Portugal among other
- Further breakdown of the Rest of Asia Pacific intensity-modulated radiotherapy marketinto Singapore, Taiwan, New Zealand, Philippines, Malaysia, and other APAC countries
- Further breakdown of the Rest of the world intensity-modulated radiotherapy marketinto Latin America, MEA, and Africa


Growth opportunities and latent adjacency in Intensity Modulated Radiotherapy Market