Lithium Compounds Market by Derivative (Lithium Carbonate, Lithium Hydroxide, Lithium Concentrate, Lithium Metal, Butyl Lithium, Lithium Chloride), End Use (Li-Ion Batteries. Glass & Ceramics, Medical, Lubricants), and Region - Global Forecast to 2025


Updated on : June 18, 2024
Lithium Compounds Market
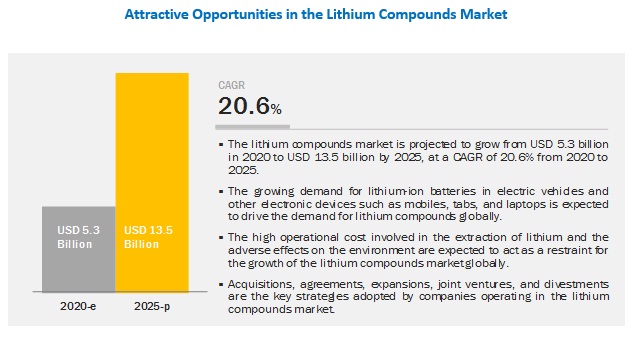
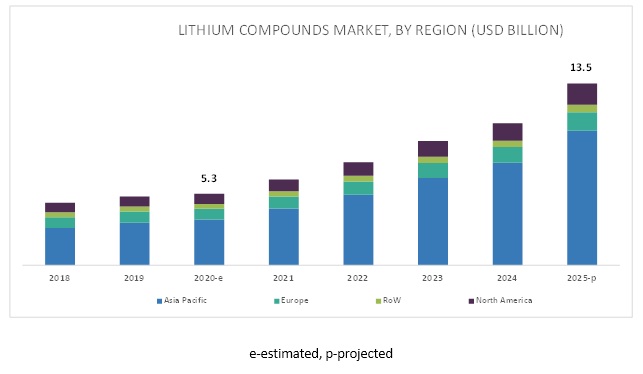
The global lithium compounds market was valued at USD 5.3 billion in 2020 and is projected to reach USD 13.5 billion by 2025, growing at 20.6% cagr from 2020 to 2025. The market growth is driven by the increasing demand for lithium compounds from end uses such as Li-ion batteries, glass & ceramics, polymers, and lubricants, among others, is expected to drive the lithium compounds market.
Lithium Compounds Market Dynamics
Based on derivative, lithium carbonate segment accounted for the largest share in 2019
Based on derivative, the lithium carbonate segment accounted for the largest share of the lithium compounds market in 2019. Lithium carbonate is a lithium salt of carbonate used widely in the processing of metal oxides. It is the first lithium compound that is extracted from the brines and the first compound in the production chain; it is a building block for other lithium derivatives. Lithium carbonate is used in various applications such as glass & ceramics, aluminum production, pharmaceuticals, and Li-ion batteries. It is also used to reduce the melting point of silica that is used in ovenware glass. In ceramics, it is used to render color & shine. The rising demand for lithium carbonate from the Li-ion battery industry is expected to drive its market during the forecast period.
Based on end use, the Li-ion batteries segment accounted for the largest market share in 2019
Based on end use, the Li-ion batteries segment accounted for the largest share in 2019. Lithium-ion batteries have become the gold standard for electric vehicles because they store more power per unit of weight compared to alternatives such as nickel-cadmium. Nickel-cadmium and nickel metal hydride batteries were formerly used in computers and cell phones. However, these sources of energy had low power capabilities, shorter charge periods, and were heavier than lithium batteries. Li-ion batteries have a high energy density, longer run time, and an extended life cycle compared to traditional lead-acid batteries, which helps meet the current requirements of the worldwide energy market.
In accordance with the Paris Climate Agreement, many governments across the world are encouraging the use of electric vehicles to reduce their carbon footprint. These electric vehicles use Li-ion batteries as their sole energy source and hence, result in zero emission through their exhausts. Governments of countries like Norway, Iceland, China, and the UK have provided heavy subsidies and tax omissions to buyers of electric vehicles, which has propelled the growth of this segment.
Asia Pacific accounted for the largest share of the lithium compounds market in 2019
By region, Asia Pacific accounted for the largest share in the global lithium compounds market in 2019. The rising demand for new energy storage applications in vehicles, grid connected energy storage, and the high demand for consumer gadgets are expected to change the market dynamics. Massive economic expansion and the flourishing electronics and electric vehicle industries in Asia Pacific countries such as China, Japan, South Korea, Thailand, and Taiwan, are responsible for the market’s high growth rate in the region. Currently, China is the largest market for lithium compounds in the Asia Pacific region. The market here is also projected to register the highest CAGR during the forecast period (2020-2025) in terms of value and volume.
Lithium Compounds Market Players
Key players in this market are Sociedad Quimica y Minera de Chile S.A. (SQM) (Chile), Livent Corporation (US), Albemarle Corporation (US), Tianqi Lithium Industries Inc. (China), Ganfeng Lithium Company Limited (China). Other noteworthy public and private players are China Lithium Products Technology Company Limited (China), Sichuan Ni&Co Guorun New Materials Company Limited (China), Shanghai China Lithium Industrial Company Limited (China), Nemaska Lithium Inc. (Canada), Bacanora Lithium (United Kingdom), Lithium Americas (Canada), Galaxy Resources Limited (Australia), Orocobre Limited (Australia), Shandong Ruifu Lithium Industry Company Limited (China), Neo Lithium Corporation (Canada), and Millennial Lithium Corporation (Canada).
Lithium Compounds Market Report Scope
|
Report Metric |
Details |
|
Market Size Available for Years |
2018–2025 |
|
Base Year Considered |
2019 |
|
Forecast Period |
2020–2025 |
|
Forecast Units |
Value (USD Billion) |
|
Segments Covered |
End Use and Derivative |
|
Geographies Covered |
North America, Asia Pacific, Europe, and Rest of the World |
|
Companies Covered |
Sociedad Quimica y Minera de Chile S.A. (SQM) (Chile), Livent Corporation (US), Albemarle Corporation (US), Tianqi Lithium Industries Inc. (China), Ganfeng Lithium Company Limited (China), China Lithium Products Technology Company Limited (China), Sichuan Ni&Co Guorun New Materials Company Limited (China), Shanghai China Lithium Industrial Company Limited (China), Nemaska Lithium Inc. (Canada), Bacanora Lithium (United Kingdom), Lithium Americas (Canada), Galaxy Resources Limited (Australia), Orocobre Limited (Australia), Shandong Ruifu Lithium Industry Company Limited (China), Neo Lithium Corporation (Canada), Millennial Lithium Corporation (Canada), among others |
This research report categorizes the lithium compounds market based on end use, derivative, and region, and forecasts revenues as well as analyzes trends in each of these submarkets.
Based on end use,the lithium compounds market has been segmented into:
- Li-ion Batteries
- Glass & Ceramics
- Medical
- Lubricants
- Metallurgy
- Polymers
- Others (grid storage, cement & concrete, dyestuff, industrial bleaching, pool chemicals, and specialty inorganics)
Based on derivatives the lithium compounds market has been segmented into:
- Lithium Carbonate
- Lithium Hydroxide
- Lithium Concentrate
- Lithium Metal
- Butyl Lithium
- Lithium Chloride & Others (lithium bromide, lithium iodide, lithium oxide, and lithium chromate)
Based on the region, the lithium compounds market has been segmented into:
- Asia Pacific
- North America
- Europe
- Rest of the World
Recent Developments
- In January 2019, Albemarle Corporation received approval from the Australian government to set up its Kemerton Plant, which would have a production capacity of 60,000 metric tons of lithium hydroxide. This capacity can also be enhanced to 100,000 metric tons if required. The commissioning of the plant is expected to commence in 2021.
- In August 2019, Ganfeng Lithium Co. Ltd. increased its stake to 50% in Minera Exar, the holding company of the Cauchari-Olaroz project. This project is expected to produce 25,000 metric tons of battery-grade lithium per annum in the first phase, beginning in 2021. Post further expansion, its capacity will be increased to 40,000 metric tons per annum for a period of 40 years. This acquisition will boost Ganfeng’s lithium raw material supply to meet the future demand for lithium compounds.
- In May 2018, SQM planned a three-phase lithium carbonate plant expansion in Chile, to ramp up production to 180,000 metric tons by 2021, to increase its sales volume and meet quality standards demanded by customers.
Key Questions Addressed by the Report:
- How are the developments undertaken by various companies expected to affect the lithium compounds market in the mid- to long-term?
- What are the upcoming industry end uses of lithium compounds?
- What is the impact of changes in government policies on the lithium compounds market?
- What is the estimated size of the lithium compounds market in 2020?
- What are the different derivatives of lithium compounds?
Frequently Asked Questions (FAQ):
What are the different types of lithium compounds?
Lithium compounds used widely across various end-use industries are Lithium Concentrate, Lithium Carbonate, Lithium Hydroxide, Lithium Metal, Lithium Chloride and Butyllithium.
What are the most promising high-growth opportunities for the global lithium compounds market by end-use industry?
Primarily lithium compounds are used in manufacturing of Li-ion batteries, lithium-based lubricants and glass & ceramics, along with use as catalysts in polymers & metallurgy and medical denture casting.
What are the key driving factors for the global lithium compounds market?
The global lithium compounds market is expected to be boosted by the growth of the portable electronic devices market, adoption of electric vehicles and development of energy storage systems.
What are the key regions in the global lithium compounds market?
The global lithium compounds market is expected to see increased consumption in Asia Pacific, Europe and North America due to adoption of electric vehicles and use of energy storage systems as alternatives to traditional sources of power.
To speak to our analyst for a discussion on the above findings, click Speak to Analyst
 Exclusive indicates content/data unique to MarketsandMarkets and not available with any competitors.
Table of Contents
1 Introduction (Page No. - 35)
1.1 Objectives of the Study
1.2 Market Definition
1.3 Scope of the Market
1.3.1 Markets Covered
1.3.2 Years Considered In the Report
1.4 Currency
1.5 Package Size
1.6 Limitations
1.7 Stakeholders
2 Research Methodology (Page No. - 38)
2.1 Research Data
2.1.1 Secondary Data
2.1.1.1 Key Data From Secondary Sources
2.1.2 Primary Data
2.1.2.1 Key Data From Primary Sources
2.1.2.2 Key Industry Insights
2.1.2.3 Breakdown of Primary Interviews
2.2 Market Size Estimation
2.2.1 Bottom-Up Approach
2.2.2 Top-Down Approach
2.3 Base Number Calculation
2.3.1 Supply Side Approach
2.4 Market Breakdown and Data Triangulation
2.5 Research Assumptions
3 Executive Summary (Page No. - 47)
4 Premium Insights (Page No. - 50)
4.1 Attractive Opportunities In Lithium Compounds Market
4.2 Lithium Compounds Market Growth, By Region
4.3 Lithium Compounds Market Share, By Derivative
4.4 Lithium Compounds Market, By Major Country
5 Market Overview (Page No. - 53)
5.1 Market Dynamics
5.1.1 Drivers
5.1.1.1 Growth of the Market for Portable Electronic Devices That Use Li-Ion Batteries
5.1.1.2 Switch From Traditional Fuel Cars to Electric Vehicles
5.1.2 Restraints
5.1.2.1 High Operational Costs
5.1.2.2 Lack of Recharging Infrastructure
5.1.2.3 Socio-Environmental Impact of Lithium Extraction
5.1.3 Opportunities
5.1.3.1 Developing Energy Storage Within the Power Sector
5.1.3.2 Growing Need for Battery-Operated Industrial and Construction Equipment
5.1.4 Challenges
5.1.4.1 Lithium Concentration In Politically Unstable Regions
5.1.4.2 Product Safety Concerns
5.2 Porter’s Five Forces Analysis
5.2.1 Bargaining Power of Suppliers
5.2.2 Bargaining Power of Buyers
5.2.3 Threat of Substitutes
5.2.4 Threat of New Entrants
5.2.5 Intensity of Competitive Rivalry
6 Lithium Compounds Market, By Derivative (Page No. - 62)
6.1 Introduction
6.2 Processing of Lithium
6.3 Lithium Carbonate
6.3.1 Lithium Carbonate Market Size, By End Use
6.3.1.1 Li-Ion Batteries
6.3.1.2 Glass & Ceramics
6.3.1.3 Medical
6.3.1.4 Lubricants
6.3.1.5 Metallurgy
6.3.1.6 Polymers
6.3.1.7 Others
6.3.2 Lithium Carbonate Market, By Region
6.3.2.1 Asia Pacific
6.3.2.1.1 China
6.3.2.1.2 South Korea
6.3.2.1.3 Japan
6.3.2.1.4 Rest of Asia Pacific
6.3.2.2 North America
6.3.2.2.1 US
6.3.2.2.2 Canada
6.3.2.2.3 Mexico
6.3.2.3 Europe
6.3.2.3.1 Germany
6.3.2.3.2 France
6.3.2.3.3 UK
6.3.2.3.4 Rest of Europe
6.3.2.4 RoW
6.4 Lithium Hydroxide
6.4.1 Lithium Hydroxide Market Size, By End Use
6.4.1.1 Li-Ion Batteries
6.4.1.2 Glass & Ceramics
6.4.1.3 Medical
6.4.1.4 Lubricants
6.4.1.5 Metallurgy
6.4.1.6 Polymers
6.4.1.7 Others
6.4.2 Lithium Hydroxide Market, By Region
6.4.2.1 Asia Pacific
6.4.2.1.1 China
6.4.2.1.2 Japan
6.4.2.1.3 South Korea
6.4.2.1.4 Rest of Asia Pacific
6.4.2.2 North America
6.4.2.2.1 US
6.4.2.2.2 Canada
6.4.2.2.3 Mexico
6.4.2.3 Europe
6.4.2.3.1 Germany
6.4.2.3.2 France
6.4.2.3.3 UK
6.4.2.3.4 Rest of Europe
6.4.2.4 RoW
6.5 Lithium Metal
6.5.1 Lithium Metal Market
6.5.1.1 Polymers
6.5.1.2 Medical
6.5.1.3 Li-Ion Batteries
6.5.1.4 Others
6.5.2 Lithium Metal Market, By Region
6.5.2.1 Asia Pacific
6.5.2.1.1 China
6.5.2.1.2 South Korea
6.5.2.1.3 Japan
6.5.2.1.4 Rest of Asia Pacific
6.5.2.2 Europe
6.5.2.2.1 Germany
6.5.2.2.2 France
6.5.2.2.3 UK
6.5.2.2.4 Rest of Europe
6.5.2.3 North America
6.5.2.3.1 US
6.5.2.3.2 Canada
6.5.2.3.3 Mexico
6.5.2.4 RoW
6.6 Lithium Concentrate
6.6.1 Lithium Concentrate Market, By End Use
6.6.1.1 Li-Ion Batteries
6.6.1.2 Glass and Ceramics
6.6.1.3 Other End Uses
6.6.2 Lithium Concentrate Market, By Region
6.6.2.1 Asia Pacific
6.6.2.1.1 China
6.6.2.1.2 South Korea
6.6.2.1.3 Japan
6.6.2.1.4 Rest of Asia Pacific
6.6.2.2 Europe
6.6.2.2.1 Germany
6.6.2.2.2 France
6.6.2.2.3 UK
6.6.2.2.4 Rest of Europe
6.6.2.3 North America
6.6.2.3.1 US
6.6.2.3.2 Canada
6.6.2.3.3 Mexico
6.6.2.4 RoW
6.7 Butyl Lithium
6.7.1 Butyl Lithium Market, By End Use
6.7.1.1 Medical
6.7.1.2 Polymers
6.7.1.3 Other End Uses
6.7.2 Butyl Lithium Market, By Region
6.7.2.1 Asia Pacific
6.7.2.1.1 China
6.7.2.1.2 Japan
6.7.2.1.3 South Korea
6.7.2.1.4 Rest of Asia Pacific
6.7.2.2 North America
6.7.2.2.1 US
6.7.2.2.2 Canada
6.7.2.2.3 Mexico
6.7.2.3 Europe
6.7.2.3.1 Germany
6.7.2.3.2 France
6.7.2.3.3 UK
6.7.2.3.4 Rest of Europe
6.7.2.4 RoW
6.8 Lithium Chloride & Other Derivatives
6.8.1 Lithium Chloride & Other Derivatives Market, By End Use
6.8.1.1 Metallurgy
6.8.1.2 Li-Ion Batteries
6.8.1.3 Glass and Ceramics
6.8.1.4 Lubricants
6.8.1.5 Polymers
6.8.1.6 Medical
6.8.2 Lithium Chloride & Other Derivatives Market, By Region
7 Lithium Compounds Market, By End Use (Page No. - 252)
7.1 Introduction
7.2 Market Size & Projection
7.3 Li-Ion Batteries
7.4 Glass & Ceramics
7.5 Medical
7.6 Lubricants
7.7 Metallurgy
7.8 Polymers
7.9 Others
8 Regional Analysis (Page No. - 267)
8.1 Introduction
8.2 Asia Pacific
8.2.1 China
8.2.1.1 China Accounted for the Largest Share of Lithium Carbonate Consumption In the Asia Pacific Market
8.2.2 Japan
8.2.2.1 Growing Demand for Electric Mobility and Energy Storage During Power Failure to Drive Demand for Lithium Compounds
8.2.3 South Korea
8.2.3.1 Increasing Use of Portable Electronic Devices and Energy Storage Systems to Drive the Demand for Lithium Compounds
8.2.4 Rest of Asia Pacific
8.2.4.1 Use In Manufacturing of Polymers, Glass & Ceramics, and Cement Contributes to Growth of Lithium Compounds Market In Rest of Asia Pacific
8.3 North America
8.3.1 US
8.3.1.1 Growing Demand From Renewable Energy Sector and Electric Vehicle Mobility Drive Growth of Lithium Compounds Market In the US
8.3.2 Canada
8.3.2.1 Government Initiatives Like “Charging the Future” to Increase Lithium Compounds Consumption In Canada
8.3.3 Mexico
8.3.3.1 Rise In Li-Ion Battery Manufacturing to Increase the Demand for Lithium Compounds In Mexico
8.4 Europe
8.4.1 Germany
8.4.1.1 Increasing Use of Li-Ion Batteries In Electric Vehicles and Energy Storage Systems to Drive the Demand for Lithium Compounds In Germany
8.4.2 France
8.4.2.1 Consumption In Glass, Li-Ion Batteries, and Lubricant Industries Fuel Growth of Lithium Compounds Market In France
8.4.3 UK
8.4.3.1 Use In Glass & Ceramic Manufacturing and Energy Storage Devices to Grow the Lithium Compounds Market In the UK
8.4.4 Rest of Europe
8.4.4.1 Rising Adoption of Electric Mobility and Increased Tire Manufacturing to Contribute to Growth of Lithium Compounds Market In the Rest of Europe
8.5 Rest of the World
8.5.1 Middle East
8.5.1.1 Glass & Lubricant Industries to Fuel Growth of Lithium Compounds Market In the Middle East
8.5.2 Africa
8.5.2.1 Increased Use of Energy Storage Devices to Boost Lithium Compounds Market In Africa
8.5.3 South America
8.5.3.1 Abundant Reserves of Lithium and Investments In the Manufacturing Sector Contribute to Growth of Lithium Compounds Market In South America
9 Competitive Landscape (Page No. - 314)
9.1 Overview
9.2 Competitive Landscape Mapping, 2019
9.2.1 Visionary Leaders
9.2.2 Innovators
9.2.3 Dynamic Differentiators
9.2.4 Emerging Companies
9.3 Competitive Benchmarking
9.3.1 Strength of Product Portfolio
9.3.2 Business Strategy Excellence
9.4 Market Ranking of Key Players
9.5 Competitive Scenario
9.5.1 Acquisitions
9.5.2 Agreements
9.5.3 Expansions
9.5.4 Joint Ventures
9.5.5 Innovative Technology
9.5.6 Divestments
10 Company Profiles (Page No. - 334)
(Business Overview, Products Offered, Recent Developments, SWOT Analysis & MnM View)*
10.1 Albemarle Corporation
10.2 Sociedad Quimica Y Minera De Chile S.A. (SQM)
10.3 Livent Corporation
10.4 Tianqi Lithium Industries Inc.
10.5 Ganfeng Lithium Co. Ltd.
10.6 China Lithium Products Technology Co. Ltd.
10.7 Sichuan Ni&Co Guorun New Materials Co. Ltd.
10.8 Shanghai China Lithium Industrial Co. Ltd.
10.9 Nemaska Lithium Inc.
10.10 Bacanora Lithium
10.11 Lithium Americas
10.12 Galaxy Resources Limited
10.13 Orocobre Limited
10.14 Shandong Ruifu Lithium Industry Co. Ltd.
10.15 NEO Lithium Corporation
10.16 Millennial Lithium Corporation
10.17 Tvel Fuel Company
10.18 Argosy Minerals Limited
10.19 Pilbara Minerals Limited
10.20 LSC Lithium Corporation
10.21 Covalent Lithium
10.22 International Lithium Corporation
10.23 General Lithium (Haimen) Corporation
10.24 Piedmont Lithium Limited
10.25 Burwill Holdings Limited
*Details on Business Overview, Products Offered, Recent Developments, SWOT Analysis & MnM View Might Not Be Captured In Case of Unlisted Companies.
11 Appendix (Page No. - 383)
11.1 Discussion Guide
11.2 Knowledge Store: Marketsandmarkets’ Subscription Portal
11.3 Available Customizations
11.4 Related Reports
11.5 Author Details
List of Tables (543 Tables)
Table 1 Lithium Compounds Market Size, 2018-2025
Table 2 Lithium Compounds Market Size, By Derivative, 2018-2025 (Kt)
Table 3 Lithium Compounds Market Size, By Derivative, 2018-2025 (USD Million)
Table 4 Lithium Carbonate Consumption Volume (Kt) and Value (USD Million), 2018-2025
Table 5 Lithium Carbonate Market Size, By End Use, 2018-2025 (Kt)
Table 6 Lithium Carbonate Market Size, By End Use, 2018-2025 (USD Million)
Table 7 Lithium Carbonate Market Size In Li-Ion Batteries, By Region, 2018-2025 (Kt)
Table 8 Lithium Carbonate Market Size In Li-Ion Batteries, By Region, 2018-2025 (USD Million)
Table 9 Asia Pacific: Lithium Carbonate Market Size In Li-Ion Batteries, By Country, 2018-2025 (Kt)
Table 10 Asia Pacific: Lithium Carbonate Market Size In Li-Ion Batteries, By Country, 2018-2025 (USD Million)
Table 11 North America: Lithium Carbonate Market Size In Li-Ion Batteries, By Country, 2018-2025 (Kt)
Table 12 North America: Lithium Carbonate Market Size In Li-Ion Batteries, By Country, 2018-2025 (USD Million)
Table 13 Europe: Lithium Carbonate Market Size In Li-Ion Batteries, By Country, 2018-2025 (Kt)
Table 14 Europe: Lithium Carbonate Market Size In Li-Ion Batteries, By Country, 2018-2025 (USD Million)
Table 15 Lithium Carbonate Market Size In Glass & Ceramics, By Region, 2018-2025 (Kt)
Table 16 Lithium Carbonate Market Size In Glass & Ceramics, By Region, 2018-2025 (USD Million)
Table 17 Asia Pacific: Lithium Carbonate Market Size In Glass & Ceramics, By Country, 2018-2025 (Kt)
Table 18 Asia Pacific: Lithium Carbonate Market Size In Glass & Ceramics, By Country, 2018-2025 (USD Million)
Table 19 North America: Lithium Carbonate Market Size In Glass & Ceramics, By Country, 2018-2025 (Kt)
Table 20 North America: Lithium Carbonate Market Size In Glass & Ceramics, By Country, 2018-2025 (USD Million)
Table 21 Europe: Lithium Carbonate Market Size In Glass & Ceramics, By Country, 2018-2025 (Kt)
Table 22 Europe: Lithium Carbonate Market Size In Glass & Ceramics, By Country, 2018-2025 (USD Million)
Table 23 Lithium Carbonate Market Size In Medical, By Region, 2018-2025 (Kt)
Table 24 Lithium Carbonate Market Size In Medical, By Region, 2018-2025 (USD Million)
Table 25 Asia Pacific: Lithium Carbonate Market Size In Medical, By Country, 2018-2025 (Kt)
Table 26 Asia Pacific: Lithium Carbonate Market Size In Medical, By Country, 2018-2025 (USD Million)
Table 27 North America: Lithium Carbonate Market Size In Medical, By Country, 2018-2025 (Kt)
Table 28 North America: Lithium Carbonate Market Size In Medical, By Country, 2018-2025 (USD Million)
Table 29 Europe: Lithium Carbonate Market Size In Medical, By Country, 2018-2025 (Kt)
Table 30 Europe: Lithium Carbonate Market Size In Medical, By Country, 2018-2025 (USD Million)
Table 31 Lithium Carbonate Market Size In Lubricants, By Region, 2018-2025 (Kt)
Table 32 Lithium Carbonate Market Size In Lubricants, By Region, 2018-2025 (USD Million)
Table 33 Asia Pacific: Lithium Carbonate Market Size In Lubricants, By Country, 2018-2025 (Kt)
Table 34 Asia Pacific: Lithium Carbonate Market Size In Lubricants, By Country, 2018-2025 (USD Million)
Table 35 North America: Lithium Carbonate Market Size In Lubricants, By Country, 2018-2025 (Kt)
Table 36 North America: Lithium Carbonate Market Size In Lubricants, By Country, 2018-2025 (USD Million)
Table 37 Europe: Lithium Carbonate Market Size In Lubricants, By Country, 2018-2025 (Kt)
Table 38 Europe: Lithium Carbonate Market Size In Lubricants, By Country, 2018-2025 (USD Million)
Table 39 Lithium Carbonate Market Size In Metallurgy, By Region, 2018-2025 (Kt)
Table 40 Lithium Carbonate Market Size In Metallurgy, By Region, 2018-2025 (USD Million)
Table 41 Asia Pacific: Lithium Carbonate Market Size In Metallurgy, By Country, 2018-2025 (Kt)
Table 42 Asia Pacific: Lithium Carbonate Market Size In Metallurgy, By Country, 2018-2025 (USD Million)
Table 43 North America: Lithium Carbonate Market Size In Metallurgy, By Country, 2018-2025 (Kt)
Table 44 North America: Lithium Carbonate Market Size In Metallurgy, By Country, 2018-2025 (USD Million)
Table 45 Europe: Lithium Carbonate Market Size In Metallurgy, By Country, 2018-2025 (Kt)
Table 46 Europe: Lithium Carbonate Market Size In Metallurgy, By Country, 2018-2025 (USD Million)
Table 47 Lithium Carbonate Market Size In Polymers, By Region, 2018-2025 (Kt)
Table 48 Lithium Carbonate Market Size In Polymers, By Region, 2018-2025 (USD Million)
Table 49 Asia Pacific: Lithium Carbonate Market Size In Polymers, By Country, 2018-2025 (Kt)
Table 50 Asia Pacific: Lithium Carbonate Market Size In Polymers, By Country, 2018-2025 (USD Million)
Table 51 North America: Lithium Carbonate Market Size In Polymers, By Country, 2018-2025 (Kt)
Table 52 North America: Lithium Carbonate Market Size In Polymers, By Country, 2018-2025 (USD Million)
Table 53 Europe: Lithium Carbonate Market Size In Polymers, By Country, 2018-2025 (Kt)
Table 54 Europe: Lithium Carbonate Market Size In Polymers, By Country, 2018-2025 (USD Million)
Table 55 Lithium Carbonate Market Size In Other End Uses, By Region, 2018-2025 (Kt)
Table 56 Lithium Carbonate Market Size In Other End Uses, By Region, 2018-2025 (USD Million)
Table 57 Asia Pacific: Lithium Carbonate Market Size In Other End Uses, By Country, 2018-2025 (Kt)
Table 58 Asia Pacific: Lithium Carbonate Market Size In Other End Uses, By Country, 2018-2025 (USD Million)
Table 59 North America: Lithium Carbonate Market Size In Other End Uses, By Country, 2018-2025 (Kt)
Table 60 North America: Lithium Carbonate Market Size In Other End Uses, By Country, 2018-2025 (USD Million)
Table 61 Europe: Lithium Carbonate Market Size In Other End Uses, By Country, 2018-2025 (Kt)
Table 62 Europe: Lithium Carbonate Market Size In Other End Uses, By Country, 2018-2025 (USD Million)
Table 63 Lithium Carbonate Market Size, By Region, 2018-2025 (Kt)
Table 64 Lithium Carbonate Market Size, By Region, 2018-2025 (USD Million)
Table 65 Asia Pacific: Lithium Carbonate Market Size, By Country, 2018-2025 (Kt)
Table 66 Asia Pacific: Lithium Carbonate Market Size, By Country, 2018-2025 (USD Million)
Table 67 Asia Pacific: Lithium Carbonate Market Size, By End Use, 2018-2025 (Kt)
Table 68 Asia Pacific: Lithium Carbonate Market Size, By End Use, 2018-2025 (USD Million)
Table 69 China: Lithium Carbonate Market Size, By End Use, 2018-2025 (Kt)
Table 70 China: Lithium Carbonate Market Size, By End Use, 2018-2025 (USD Million)
Table 71 South Korea: Lithium Carbonate Market Size, By End Use, 2018-2025 (Kt)
Table 72 South Korea: Lithium Carbonate Market Size, By End Use, 2018-2025 (USD Million)
Table 73 Japan: Lithium Carbonate Market Size, By End Use, 2018-2025 (Kt)
Table 74 Japan: Lithium Carbonate Market Size, By End Use, 2018-2025 (USD Million)
Table 75 Rest of Asia Pacific: Lithium Carbonate Market Size, By End Use, 2018-2025 (Kt)
Table 76 Rest of Asia Pacific: Lithium Carbonate Market Size, By End Use, 2018-2025 (USD Million)
Table 77 North America: Lithium Carbonate Market Size, By Country, 2018-2025 (Kt)
Table 78 North America: Lithium Carbonate Market Size, By Country, 2018-2025 (USD Million)
Table 79 North America: Lithium Carbonate Market Size, By End Use, 2018-2025 (Kt)
Table 80 North America: Lithium Carbonate Market Size, By End Use, 2018-2025 (USD Million)
Table 81 US: Lithium Carbonate Market Size, By End Use, 2018-2025 (Kt)
Table 82 US: Lithium Carbonate Market Size, By End Use, 2018-2025 (USD Million)
Table 83 Canada: Lithium Carbonate Market Size, By End Use, 2018-2025 (Kt)
Table 84 Canada: Lithium Carbonate Market Size, By End Use, 2018-2025 (USD Million)
Table 85 Mexico: Lithium Carbonate Market Size, By End Use, 2018-2025 (Kt)
Table 86 Mexico: Lithium Carbonate Market Size, By End Use, 2018-2025 (USD Million)
Table 87 Europe: Lithium Carbonate Market Size, By Country, 2018-2025 (Kt)
Table 88 Europe: Lithium Carbonate Market Size, By Country, 2018-2025 (USD Million)
Table 89 Europe: Lithium Carbonate Market Size, By End Use, 2018-2025 (Kt)
Table 90 Europe: Lithium Carbonate Market Size, By End Use, 2018-2025 (USD Million)
Table 91 Germany: Lithium Carbonate Market Size, By End Use, 2018-2025 (Kt)
Table 92 Germany: Lithium Carbonate Market Size, By End Use, 2018-2025 (USD Million)
Table 93 France: Lithium Carbonate Market Size, By End Use, 2018-2025 (Kt)
Table 94 France: Lithium Carbonate Market Size, By End Use, 2018-2025 (USD Million)
Table 95 UK: Lithium Carbonate Market Size, By End Use, 2018-2025 (Kt)
Table 96 UK: Lithium Carbonate Market Size, By End Use, 2018-2025 (USD Million)
Table 97 Rest of Europe: Lithium Carbonate Market Size, By End Use, 2018-2025 (Kt)
Table 98 Rest of Europe: Lithium Carbonate Market Size, By End Use, 2018-2025 (USD Million)
Table 99 RoW: Lithium Carbonate Market Size, By End Use, 2018-2025 (Kt)
Table 100 RoW: Lithium Carbonate Market Size, By End Use, 2018-2025 (USD Million)
Table 101 Lithium Hydroxide Consumption Volume (Kt) and Value (USD Million), 2018-2025
Table 102 Lithium Hydroxide Market Size, By End Use, 2018-2025 (Kt)
Table 103 Lithium Hydroxide Market Size, By End Use, 2018-2025 (USD Million)
Table 104 Lithium Hydroxide Market Size In Li-Ion Batteries, By Region, 2018-2025 (Kt)
Table 105 Lithium Hydroxide Market Size In Li-Ion Batteries, By Region, 2018-2025 (USD Million)
Table 106 Asia Pacific: Lithium Hydroxide Market Size In Li-Ion Batteries, By Country, 2018-2025 (Kt)
Table 107 Asia Pacific: Lithium Hydroxide Market Size In Li-Ion Batteries, By Country, 2018-2025 (USD Million)
Table 108 North America: Lithium Hydroxide Market Size In Li-Ion Batteries, By Country, 2018-2025 (Kt)
Table 109 North America: Lithium Hydroxide Market Size In Li-Ion Batteries, By Country, 2018-2025 (USD Million)
Table 110 Europe: Lithium Hydroxide Market Size In Li-Ion Batteries, By Country, 2018-2025 (Kt)
Table 111 Europe: Lithium Hydroxide Market Size In Li-Ion Batteries, By Country, 2018-2025 (USD Million)
Table 112 Lithium Hydroxide Market Size In Glass & Ceramics, By Region, 2018-2025 (Kt)
Table 113 Lithium Hydroxide Market Size In Glass & Ceramics, By Region, 2018-2025 (USD Million)
Table 114 Asia Pacific: Lithium Hydroxide Market Size In Glass & Ceramics, By Country, 2018-2025 (Kt)
Table 115 Asia Pacific: Lithium Hydroxide Market Size In Glass & Ceramics, By Country, 2018-2025 (USD Million)
Table 116 North America: Lithium Hydroxide Market Size In Glass & Ceramics,By Country, 2018-2025 (Kt)
Table 117 North America: Lithium Hydroxide Market Size In Glass & Ceramics, By Country, 2018-2025 (USD Million)
Table 118 Europe: Lithium Hydroxide Market Size In Glass & Ceramics, By Country, 2018-2025 (Kt)
Table 119 Europe: Lithium Hydroxide Market Size In Glass & Ceramics, By Country, 2018-2025 (USD Million)
Table 120 Lithium Hydroxide Market Size In Medical, By Region, 2018-2025 (Kt)
Table 121 Lithium Hydroxide Market Size In Medical, By Region, 2018-2025 (USD Million)
Table 122 Asia Pacific: Lithium Hydroxide Market Size In Medical, By Country, 2018-2025 (Kt)
Table 123 Asia Pacific: Lithium Hydroxide Market Size In Medical, By Country, 2018-2025 (USD Million)
Table 124 North America: Lithium Hydroxide Market Size In Medical, By Country, 2018-2025 (Kt)
Table 125 North America: Lithium Hydroxide Market Size In Medical, By Country, 2018-2025 (USD Million)
Table 126 Europe: Lithium Hydroxide Market Size In Medical, By Country, 2018-2025 (Kt)
Table 127 Europe: Lithium Hydroxide Market Size In Medical, By Country, 2018-2025 (USD Million)
Table 128 Lithium Hydroxide Market Size In Lubricants, By Region, 2018-2025 (Kt)
Table 129 Lithium Hydroxide Market Size In Lubricants, By Region, 2018-2025 (USD Million)
Table 130 Asia Pacific: Lithium Hydroxide Market Size In Lubricants, By Country, 2018-2025 (Kt)
Table 131 Asia Pacific: Lithium Hydroxide Market Size In Lubricants, By Country, 2018-2025 (USD Million)
Table 132 North America: Lithium Hydroxide Market Size In Lubricants, By Country, 2018-2025 (Kt)
Table 133 North America: Lithium Hydroxide Market Size In Lubricants, By Country, 2018-2025 (USD Million)
Table 134 Europe: Lithium Hydroxide Market Size In Lubricants, By Country, 2018-2025 (Kt)
Table 135 Europe: Lithium Hydroxide Market Size In Lubricants, By Country, 2018-2025 (USD Million)
Table 136 Lithium Hydroxide Market Size In Metallurgy, By Region, 2018-2025 (Kt)
Table 137 Lithium Hydroxide Market Size In Metallurgy, By Region, 2018-2025 (USD Million)
Table 138 Asia Pacific Lithium Hydroxide Market Size In Metallurgy, By Country, 2018-2025 (Kt)
Table 139 Asia Pacific: Lithium Hydroxide Market Size In Metallurgy, By Country, 2018-2025 (USD Million)
Table 140 North America: Lithium Hydroxide Market Size In Metallurgy, By Country, 2018-2025 (Kt)
Table 141 North America: Lithium Hydroxide Market Size In Metallurgy, By Country, 2018-2025 (USD Million)
Table 142 Europe: Lithium Hydroxide Market Size In Metallurgy, By Country, 2018-2025 (Kt)
Table 143 Europe: Lithium Hydroxide Market Size In Metallurgy, By Country, 2018-2025 (USD Million)
Table 144 Lithium Hydroxide Market Size In Polymers, By Region, 2018-2025 (Kt)
Table 145 Lithium Hydroxide Market Size In Polymers, By Region, 2018-2025 (USD Million)
Table 146 Asia Pacific: Lithium Hydroxide Market Size In Polymers, By Country, 2018-2025 (Kt)
Table 147 Asia Pacific: Lithium Hydroxide Market Size In Polymers, By Country, 2018-2025 (USD Million)
Table 148 North America: Lithium Hydroxide Market Size In Polymers, By Country, 2018-2025 (Kt)
Table 149 North America: Lithium Hydroxide Market Size In Polymers, By Country, 2018-2025 (USD Million)
Table 150 Europe: Lithium Hydroxide Market Size In Polymers, By Country, 2018-2025 (Kt)
Table 151 Europe: Lithium Hydroxide Market Size In Polymers, By Country, 2018-2025 (USD Million)
Table 152 Lithium Hydroxide Market Size In Other End Uses, By Region, 2018-2025 (Kt)
Table 153 Lithium Hydroxide Market Size In Other End Uses, By Region, 2018-2025 (USD Million)
Table 154 Asia Pacific: Lithium Hydroxide Market Size In Other End Uses, By Country, 2018-2025 (Kt)
Table 155 Asia Pacific: Lithium Hydroxide Market Size In Other End Uses, By Country, 2018-2025 (USD Million)
Table 156 North America: Lithium Hydroxide Market Size In Other End Uses, By Country, 2018-2025 (Kt)
Table 157 North America: Lithium Hydroxide Market Size In Other End Uses, By Country, 2018-2025 (USD Million)
Table 158 Europe: Lithium Hydroxide Market Size In Others, By Country, 2018-2025 (Kt)
Table 159 Europe: Lithium Hydroxide Market Size In Other End Uses, By Country, 2018-2025 (USD Million)
Table 160 Lithium Hydroxide Market Size, By Region, 2018-2025 (Kt)
Table 161 Lithium Hydroxide Market Size, By Region, 2018-2025 (USD Millions)
Table 162 Asia Pacific: Lithium Hydroxide Market Size, By Country, 2018-2025 (Kt)
Table 163 Asia Pacific: Lithium Hydroxide Market Size, By Country, 2018-2025 (USD Million)
Table 164 Asia Pacific: Lithium Hydroxide Market Size, By End Use, 2018-2025 (Kt)
Table 165 Asia Pacific: Lithium Hydroxide Market Size, By End Use, 2018-2025 (USD Million)
Table 166 China: Lithium Hydroxide Market Size, By End Use, 2018-2025 (Kt)
Table 167 China: Lithium Hydroxide Market Size, By End Use, 2018-2025 (USD Million)
Table 168 Japan: Lithium Hydroxide Market Size, By End Use, 2018-2025 (Kt)
Table 169 Japan: Lithium Hydroxide Market Size, By End Use, 2018-2025 (USD Million)
Table 170 South Korea: Lithium Hydroxide Market Size, By End Use, 2018-2025 (Kt)
Table 171 South Korea: Lithium Hydroxide Market Size, By End Use, 2018-2025 (USD Million)
Table 172 Rest of Asia Pacific: Lithium Hydroxide Market Size, By End Use, 2018-2025 (Kt)
Table 173 Rest of Asia Pacific: Lithium Hydroxide Market Size, By End Use, 2018-2025 (USD Million)
Table 174 North America: Lithium Hydroxide Market Size, By Country, 2018-2025 (Kt)
Table 175 North America: Lithium Hydroxide Market Size, By Country, 2018-2025 (USD Million)
Table 176 North America: Lithium Hydroxide Market Size, By End Use, 2018-2025 (Kt)
Table 177 North America: Lithium Hydroxide Market Size, By End Use 2018-2025 (USD Million)
Table 178 US: Lithium Hydroxide Market Size, By End Use, 2018-2025 (Kt)
Table 179 US: Lithium Hydroxide Market Size, By End Use, 2018-2025 (USD Million)
Table 180 Canada: Lithium Hydroxide Market Size, By End Use, 2018-2025 (Kt)
Table 181 Canada: Lithium Hydroxide Market Size, By End Use, 2018-2025 (USD Million)
Table 182 Mexico: Lithium Hydroxide Market Size, By End Use, 2018-2025 (Kt)
Table 183 Mexico: Lithium Hydroxide Market Size, By End Use, 2018-2025 (USD Million)
Table 184 Europe: Lithium Hydroxide Market Size, By Country, 2018-2025 (Kt)
Table 185 Europe: Lithium Hydroxide Market Size, By Country, 2018-2025 (USD Million)
Table 186 Europe: Lithium Hydroxide Market Size, By End Use, 2018-2025 (Kt)
Table 187 Europe: Lithium Hydroxide Market Size, By End Use, 2018-2025 (USD Million)
Table 188 Germany: Lithium Hydroxide Market Size, By End Use, 2018-2025 (Kt)
Table 189 Germany: Lithium Hydroxide Market Size, By End Use, 2018-2025 (USD Million)
Table 190 France: Lithium Hydroxide Market Size, By End Use, 2018-2025 (Kt)
Table 191 France: Lithium Hydroxide Market Size, By End Use, 2018-2025 (USD Million)
Table 192 UK: Lithium Hydroxide Market Size, By End Use, 2018-2025 (Kt)
Table 193 UK: Lithium Hydroxide Market Size, By End Use, 2018-2025 (USD Million)
Table 194 Rest of Europe: Lithium Hydroxide Market Size, By End Use, 2018-2025 (Kt)
Table 195 Rest of Europe: Lithium Hydroxide Market Size, By End Use, 2018-2025 (USD Million)
Table 196 RoW: Lithium Hydroxide Market Size, By End Use, 2018-2025 (Kt)
Table 197 RoW: Lithium Hydroxide Market Size, By End Use, 2018-2025 (USD Million)
Table 198 Lithium Metal Consumption Volume (Kt) and Value (USD Million), 2018-2025
Table 199 Lithium Metal Market Size, By End Use, 2018-2025 (Kt)
Table 200 Lithium Metal Market Size, By End Use, 2018-2025 (USD Million)
Table 201 Lithium Metal Market Size In Polymers, By Region, 2018-2025 (Kt)
Table 202 Lithium Metal Market Size In Polymers, By Region, 2018-2025 (USD Million)
Table 203 Asia Pacific: Lithium Metal Market Size In Polymers, By Country, 2018-2025 (Kt)
Table 204 Asia Pacific: Lithium Metal Market Size In Polymers, By Country, 2018-2025 (USD Million)
Table 205 North America: Lithium Metal Market Size In Polymers, By Country, 2018-2025 (Kt)
Table 206 North America: Lithium Metal Market Size In Polymers, By Country, 2018-2025 (USD Million)
Table 207 Europe: Lithium Metal Market Size In Polymers, By Country, 2018-2025 (Kt)
Table 208 Europe: Lithium Metal Market Size In Polymers, By Country, 2018-2025 (USD Million)
Table 209 Lithium Metal Market Size In Medical, By Region, 2018-2025 (Kt)
Table 210 Lithium Metal Market Size In Medical, By Region, 2018-2025 (USD Million)
Table 211 Asia Pacific: Lithium Metal Market Size In Medical, By Country, 2018-2025 (Kt)
Table 212 Asia Pacific: Lithium Metal Market Size In Medical, By Country, 2018-2025 (USD Million)
Table 213 North America: Lithium Metal Market Size In Medical, By Country, 2018-2025 (Kt)
Table 214 North America: Lithium Metal Market Size In Medical, By Country, 2018-2025 (USD Million)
Table 215 Europe: Lithium Metal Market Size In Medical, By Country, 2018-2025 (Kt)
Table 216 Europe: Lithium Metal Market Size In Medical, By Country, 2018-2025 (USD Million)
Table 217 Lithium Metal Market Size In Li-Ion Batteries, By Region, 2018-2025 (Kt)
Table 218 Lithium Metal Market Size In Li-Ion Batteries, By Region, 2018-2025 (USD Million)
Table 219 Asia Pacific Lithium Metal Market Size In Li-Ion Batteries, By Country, 2018-2025 (Kt)
Table 220 Asia Pacific Lithium Metal Market Size In Li-Ion Batteries, By Country, 2018-2025 (USD Million)
Table 221 North America: Lithium Metal Market Size In Li-Ion Batteries, By Country, 2018-2025 (Kt)
Table 222 North America: Lithium Metal Market Size In Li-Ion Batteries, By Country, 2018-2025 (USD Million)
Table 223 Europe: Lithium Metal Market Size In Li-Ion Batteries, By Country, 2018-2025 (Kt)
Table 224 Europe: Lithium Metal Market Size In Li-Ion Batteries, By Country, 2018-2025 (USD Million)
Table 225 Lithium Metal Market Size In Other End Uses, By Region, 2018-2025 (Kt)
Table 226 Lithium Metal Market Size In Other End Uses, By Region, 2018-2025 (USD Million)
Table 227 Asia Pacific: Lithium Metal Market Size In Other End Uses, By Country, 2018-2025 (Kt)
Table 228 Asia Pacific: Lithium Metal Market Size In Other End Uses, By Country, 2018-2025 (USD Million)
Table 229 North America: Lithium Metal Market Size In Other End Uses, By Country, 2018-2025 (Tons)
Table 230 North America: Lithium Metal Market Size In Other End Uses, By Country, 2018-2025 (USD Million)
Table 231 Europe: Lithium Metal Market Size In Other End Uses, By Country, 2018-2025 (Tons)
Table 232 Europe: Lithium Metal Market Size In Other End Uses, By Country, 2018-2025 (USD Million)
Table 233 Lithium Metal Market Size, By Region, 2018-2025 (Kt)
Table 234 Lithium Metal Market Size, By Region, 2018-2025 (USD Million)
Table 235 Asia Pacific: Lithium Metal Market Size, By Country, 2018-2025 (Kt)
Table 236 Asia Pacific: Lithium Metal Market Size, By Country, 2018-2025 (USD Million)
Table 237 Asia Pacific: Lithium Metal Market Size, By End Use, 2018-2025 (Kt)
Table 238 Asia Pacific: Lithium Metal Market Size, By End Use, 2018-2025 (USD Million)
Table 239 China: Lithium Metal Market Size, By End Use, 2018-2025 (Kt)
Table 240 China: Lithium Metal Market Size, By End Use, 2018-2025 (USD Million)
Table 241 South Korea: Lithium Metal Market Size, By End Use, 2018-2025 (Kt)
Table 242 South Korea: Lithium Metal Market Size, By End Use, 2018-2025 (USD Million)
Table 243 Japan: Lithium Metal Market Size, By End Use, 2018-2025 (Kt)
Table 244 Japan: Lithium Metal Market Size, By End Use, 2018-2025 (USD Million)
Table 245 Rest of Asia Pacific: Lithium Metal Market Size, By End Use, 2018-2025 (Kt)
Table 246 Rest of Asia Pacific: Lithium Metal Market Size, By End Use, 2018-2025 (USD Million)
Table 247 Europe: Lithium Metal Market Size, By Country, 2018-2025 (Kt)
Table 248 Europe: Lithium Metal Market Size, By Country, 2018-2025 (USD Million)
Table 249 Europe: Lithium Metal Market Size, By End Use, 2018-2025 (Kt)
Table 250 Europe: Lithium Metal Market Size, By End Use, 2018-2025 (USD Million)
Table 251 Germany: Lithium Metal Market Size, By End Use, 2018-2025 (Kt)
Table 252 Germany: Lithium Metal Market Size, By End Use, 2018-2025 (USD Million)
Table 253 France: Lithium Metal Market Size, By End Use, 2018-2025 (Kt)
Table 254 France: Lithium Metal Market Size, By End Use, 2018-2025 (USD Million)
Table 255 UK: Lithium Metal Market Size, By End Use, 2018-2025 (Kt)
Table 256 UK: Lithium Metal Market Size, By End Use, 2018-2025 (USD Million)
Table 257 Rest of Europe: Lithium Metal Market Size, By End Use, 2018-2025 (Kt)
Table 258 Rest of Europe: Lithium Metal Market Size, By End Use, 2018-2025 (USD Million)
Table 259 North America: Lithium Metal Market Size, By Country, 2018-2025 (Kt)
Table 260 North America: Lithium Metal Market Size, By Country, 2018-2025 (USD Million)
Table 261 North America: Lithium Metal Market Size, By End Use, 2018-2025 (Kt)
Table 262 North America: Lithium Metal Market Size, By End Use, 2018-2025 (USD Million)
Table 263 US: Lithium Metal Market Size, By End Use, 2018-2025 (Kt)
Table 264 US: Lithium Metal Market Size, By End Use, 2018-2025 (USD Million)
Table 265 Canada: Lithium Metal Market Size, By End Use, 2018-2025 (Kt)
Table 266 Canada: Lithium Metal Market Size, By End Use, 2018-2025 (USD Million)
Table 267 Mexico: Lithium Metal Market Size, By End Use, 2018-2025 (Tons)
Table 268 Mexico: Lithium Metal Market Size, By End Use, 2018-2025 (USD Million)
Table 269 RoW: Lithium Metal Market Size, By End Use, 2018-2025 (Kt)
Table 270 RoW: Lithium Metal Market Size, By End Use, 2018-2025 (USD Million)
Table 271 Lithium Concentrate Consumption Volume (Kt) and Value (USD Million), 2018-2025
Table 272 Lithium Concentrate Market Size, By End Use, 2018-2025 (Kt)
Table 273 Lithium Concentrate Market Size, By End Use, 2018-2025 (USD Million)
Table 274 Lithium Concentrate Market Size In Li-Ion Batteries, By Region, 2018-2025 (Kt)
Table 275 Lithium Concentrate Market Size In Li-Ion Batteries, By Region, 2018-2025 (USD Million)
Table 276 Asia Pacific: Lithium Concentrate Market Size In Li-Ion Batteries, By Country, 2018-2025 (Kt)
Table 277 Asia Pacific: Lithium Concentrate Market Size In Li-Ion Batteries, By Country, 2018-2025 (USD Million)
Table 278 Europe: Lithium Concentrate Market Size In Li-Ion Batteries, By Country, 2018-2025 (Kt)
Table 279 Europe: Lithium Concentrate Market Size In Li-Ion Batteries, By Country, 2018-2025 (USD Million)
Table 280 North America: Lithium Concentrate Market Size In Li-Ion Batteries, By Country, 2018-2025 (Kt)
Table 281 North America: Lithium Concentrate Market Size In Li-Ion Batteries, By Country, 2018-2025 (USD Million)
Table 282 Lithium Concentrate Market Size In Glass & Ceramics, By Region, 2018-2025 (Kt)
Table 283 Lithium Concentrate Market Size In Glass & Ceramics, By Region, 2018-2025 (USD Million)
Table 284 Asia Pacific: Lithium Concentrate Market Size In Glass & Ceramics, By Country, 2018-2025 (Kt)
Table 285 Asia Pacific: Lithium Concentrate Market Size In Glass & Ceramics, By Country, 2018-2025 (USD Million)
Table 286 Europe: Lithium Concentrate Market Size In Glass & Ceramics, By Country, 2018-2025 (Kt)
Table 287 Europe: Lithium Concentrate Market Size In Glass & Ceramics, By Country, 2018-2025 (USD Million)
Table 288 North America: Lithium Concentrate Market Size In Glass & Ceramics, By Country, 2018-2025 (Kt)
Table 289 North America: Lithium Concentrate Market Size In Glass & Ceramics, By Country, 2018-2025 (USD Million)
Table 290 Lithium Concentrate Market Size In Other End Uses, By Region, 2018-2025 (Kt)
Table 291 Lithium Concentrate Market Size In Other End Uses, By Region, 2018-2025 (USD Million)
Table 292 Asia Pacific: Lithium Concentrate Market Size In Other End Uses, By Country, 2018-2025 (Kt)
Table 293 Asia Pacific: Lithium Concentrate Market Size In Other End Uses , By Country, 2018-2025 (USD Million)
Table 294 Europe: Lithium Concentrate Market Size In Other End Uses, By Country, 2018-2025 (Tons)
Table 295 Europe: Lithium Concentrate Market Size In Other End Uses, By Country, 2018-2025 (USD Thousand)
Table 296 North America: Lithium Concentrate Market Size In Other End Uses, By Country, 2018-2025 (Tons)
Table 297 North America: Lithium Concentrate Market Size In Other End Uses, By Country, 2018-2025 (USD Million)
Table 298 Lithium Concentrate Market Size, By Region, 2018-2025 (Kt)
Table 299 Lithium Concentrate Market Size, By Region, 2018-2025 (USD Million)
Table 300 Asia Pacific: Lithium Concentrate Market Size, By Country, 2018-2025 (Kt)
Table 301 Asia Pacific: Lithium Concentrate Market Size, By Country, 2018-2025 (USD Million)
Table 302 Asia Pacific: Lithium Concentrate Market Size, By End Use, 2018-2025 (Kt)
Table 303 Asia Pacific: Lithium Concentrate Market Size, By End Use, 2018-2025 (USD Million)
Table 304 China: Lithium Concentrate Market Size, By End Use, 2018-2025 (Kt)
Table 305 China: Lithium Concentrate Market Size, By End Use, 2018-2025 (USD Million)
Table 306 South Korea: Lithium Concentrate Market Size, By End Use, 2018-2025 (Kt)
Table 307 South Korea: Lithium Concentrate Market Size, By End Use, 2018-2025 (USD Million)
Table 308 Japan: Lithium Concentrate Market Size, By End Use, 2018-2025 (Kt)
Table 309 Japan: Lithium Concentrate Market Size, By End Use, 2018-2025 (USD Million)
Table 310 Rest of Asia Pacific: Lithium Concentrate Market Size, By End Use, 2018-2025 (Kt)
Table 311 Rest of Asia Pacific: Lithium Concentrate Market Size, By End Use, 2018-2025 (USD Thousand)
Table 312 Europe: Lithium Concentrate Market Size, By Country, 2018-2025 (Kt)
Table 313 Europe: Lithium Concentrate Market Size, By Country, 2018-2025 (USD Million)
Table 314 Europe: Lithium Concentrate Market Size, By End Use, 2018-2025 (Kt)
Table 315 Europe: Lithium Concentrate Market, By End Use, 2018-2025 (USD Million)
Table 316 Germany: Lithium Concentrate Market Size, By End Use, 2018-2025 (Tons)
Table 317 Germany: Lithium Concentrate Market Size, By End Use, 2018-2025 (USD Thousand)
Table 318 France: Lithium Concentrate Market Size, By End Use, 2018-2025 (Tons)
Table 319 France: Lithium Concentrate Market Size, By End Use, 2018-2025 (USD Thousand)
Table 320 UK: Lithium Concentrate Market Size, By End Use, 2018-2025 (Tons)
Table 321 UK: Lithium Concentrate Market Size, By End Use, 2018-2025 (USD Thousand)
Table 322 Rest of Europe: Lithium Concentrate Market Size, By End Use, 2018-2025 (Tons)
Table 323 Rest of Europe: Lithium Concentrate Market Size, By End Use, 2018-2025 (USD Thousand)
Table 324 North America: Lithium Concentrate Market Size, By Country, 2018-2025 (Kt)
Table 325 North America: Lithium Concentrate Market Size, By Country, 2018-2025 (USD Million)
Table 326 North America: Lithium Concentrate Market Size, By End Use, 2018-2025 (Kt)
Table 327 North America: Lithium Concentrate Market Size, By End Use, 2018-2025 (USD Million)
Table 328 US: Lithium Concentrate Market Size, By End Use, 2018-2025 (Kt)
Table 329 US: Lithium Concentrate Market Size, By End Use, 2018-2025 (USD Million)
Table 330 Canada: Lithium Concentrate Market Size, By End Use, 2018-2025 (Tons)
Table 331 Canada: Lithium Concentrate Market Size, By End Use, 2018-2025 (USD Million)
Table 332 Mexico: Lithium Concentrate Market Size, By End Use, 2018-2025 (Tons)
Table 333 Mexico: Lithium Concentrate Market Size, By End Use, 2018-2025 (USD Million)
Table 334 RoW: Lithium Concentrate Market Size, By End Use, 2018-2025 (Tons)
Table 335 RoW: Lithium Concentrate Market Size, By End Use, 2018-2025 (USD Thousand)
Table 336 Butyl Lithium Consumption Volume (Kt) and Value (USD Million), 2018-2025
Table 337 Butyl Lithium Market Size, By End Use, 2018-2025 (Kt)
Table 338 Butyl Lithium Market Size, By End Use, 2018-2025 (USD Million)
Table 339 Butyl Lithium Market Size In Medical, By Region, 2018-2025 (Tons)
Table 340 Butyl Lithium Market Size In Medical, By Region, 2018-2025 (USD Million)
Table 341 Asia Pacific: Butyl Lithium Market Size In Medical, By Country, 2018-2025 (Tons)
Table 342 Asia Pacific: Butyl Lithium Market Size In Medical, By Country, 2018-2025 (USD Million)
Table 343 North America: Butyl Lithium Market Size In Medical, By Country, 2018-2025 (Tons)
Table 344 North America: Butyl Lithium Market Size In Medical, 2018-2025 (USD Million)
Table 345 Europe: Butyl Lithium Market Size In Medical, By Country, 2018-2025 (Tons)
Table 346 Europe: Butyl Lithium Market Size In Medical, By Country, 2018-2025 (USD Million)
Table 347 Butyl Lithium Market Size In Polymers, By Region, 2018-2025 (Kt)
Table 348 Butyl Lithium Market Size In Polymers, By Region, 2018-2025 (USD Million)
Table 349 Asia Pacific: Butyl Lithium Market Size In Polymers, By Country, 2018-2025 (Kt)
Table 350 Asia Pacific: Butyl Lithium Market Size In Polymers, By Country, 2018-2025 (USD Million)
Table 351 North America: Butyl Lithium Market Size In Polymers, By Country, 2018-2025 (Kt)
Table 352 North America: Butyl Lithium Market Size In Polymers, By Country, 2018-2025 (USD Million)
Table 353 Europe: Butyl Lithium Market Size In Polymers, By Country, 2018-2025 (Kt)
Table 354 Europe: Butyl Lithium Market Size In Polymers, By Country, 2018-2025 (USD Million)
Table 355 Butyl Lithium Market Size In Other End Uses, By Region, 2018-2025 (Tons)
Table 356 Butyl Lithium Market Size In Other End Uses, By Region, 2018-2025 (USD Million)
Table 357 Asia Pacific: Butyl Lithium Market Size In Other End Uses, By Country, 2018-2025 (Tons)
Table 358 Asia Pacific: Butyl Lithium Market Size In Other End Uses, By Country, 2018-2025 (USD Million)
Table 359 North America: Butyl Lithium Market Size In Other End Uses, By Country, 2018-2025 (Kt)
Table 360 North America: Butyl Lithium Market Size In Other End Uses, By Country, 2018-2025 (USD Million)
Table 361 Europe: Butyl Lithium Market Size In Other End Uses, By Country, 2018-2025 (Tons)
Table 362 Europe: Butyl Lithium Market Size In Other End Uses, By Country, 2018-2025 (USD Million)
Table 363 Butyl Lithium Market Size, By Region, 2018-2025 (Kt)
Table 364 Butyl Lithium Market Size, By Region, 2018-2025 (USD Million)
Table 365 Asia Pacific: Butyl Lithium Market Size, By Country, 2018-2025 (Kt)
Table 366 Asia Pacific: Butyl Lithium Market Size, By Country, 2018-2025 (USD Million)
Table 367 Asia Pacific: Butyl Lithium Market Size, By End Use, 2018-2025 (Kt)
Table 368 Asia Pacific: Butyl Lithium Market Size, By End Use, 2018-2025 (USD Million)
Table 369 China: Butyl Lithium Market Size, By End Use, 2018-2025 (Kt)
Table 370 China: Butyl Lithium Market Size, By End Use, 2018-2025 (USD Million)
Table 371 Japan: Butyl Lithium Market Size, By End Use, 2018-2025 (Kt)
Table 372 Japan: Butyl Lithium Market Size, By End Use, 2018-2025 (USD Million)
Table 373 South Korea: Butyl Lithium Market Size, By End Use, 2018-2025 (Kt)
Table 374 South Korea: Butyl Lithium Market Size, By End Use, 2018-2025 (USD Million)
Table 375 Rest of Asia Pacific: Butyl Lithium Market Size, By End Use, 2018-2025 (Tons)
Table 376 Rest of Asia Pacific: Butyl Lithium Market Size, By End Use, 2018-2025 (USD Million)
Table 377 North America: Butyl Lithium Market Size, By Country, 2018-2025 (Tons)
Table 378 North America: Butyl Lithium Market Size, By Country, 2018-2025 (USD Million)
Table 379 North America: Butyl Lithium Market Size, By End Use, 2018-2025 (Tons)
Table 380 North America: Butyl Lithium Market Size, By End Use, 2018-2025 (USD Million)
Table 381 US: Butyl Lithium Market Size, By End Use, 2018-2025 (Tons)
Table 382 US: Butyl Lithium Market Size, By End Use, 2018-2025 (USD Million)
Table 383 Canada: Butyl Lithium Market Size, By End Use, 2018-2025 (Tons)
Table 384 Canada: Butyl Lithium Market Size, By End Use, 2018-2025 (USD Million)
Table 385 Mexico: Butyl Lithium Market Size, By End Use, 2018-2025 (Kt)
Table 386 Mexico: Butyl Lithium Market Size, By End Use, 2018-2025 (USD Million)
Table 387 Europe: Butyl Lithium Market Size, By Country, 2018-2025 (Tons)
Table 388 Europe: Butyl Lithium Market Size, By Country, 2018-2025 (USD Million)
Table 389 Europe: Butyl Lithium Market Size, By End Use, 2018-2025 (Tons)
Table 390 Europe: Butyl Lithium Market Size, By End Use, 2018-2025 (USD Million)
Table 391 Germany: Butyl Lithium Market Size, By End Use, 2018-2025 (Tons)
Table 392 Germany: Butyl Lithium Market Size, By End Use, 2018-2025 (USD Million)
Table 393 France: Butyl Lithium Market Size, By End Use, 2018-2025 (Tons)
Table 394 France: Butyl Lithium Market Sze, By End Use, 2018-2025 (USD Million)
Table 395 UK: Butyl Lithium Market Size, By End Use, 2018-2025 (Tons)
Table 396 UK: Butyl Lithium Market Size, By End Use, 2018-2025 (USD Million)
Table 397 Rest of Europe: Butyl Lithium Market Size, By End Use, 2018-2025 (Tons)
Table 398 Rest of Europe: Butyl Lithium Market Size, By End Use, 2018-2025 (USD Million)
Table 399 RoW: Butyl Lithium Market Size, By End Use, 2018-2025 (Tons)
Table 400 RoW: Butyl Lithium Market Size, By End Use, 2018-2025 (USD Million)
Table 401 Lithium Chloride & Other Derivatives Market Size, By End Use, 2018-2025 (Kt)
Table 402 Lithium Chloride & Other Derivatives Market Size, By End Use, 2018-2025 (USD Million)
Table 403 Lithium Chloride & Other Derivatives Market Size In Metallurgy, By Region, 2018-2025 (Kt)
Table 404 Lithium Chloride & Other Derivatives Market Size In Metallurgy, By Region, 2018-2025 (USD Million)
Table 405 Asia Pacific: Lithium Chloride & Other Derivatives Market Size In Metallurgy, By Country, 2018-2025 (Kt)
Table 406 Asia Pacific: Lithium Chloride & Other Derivatives Market Size In Metallurgy, By Country, 2018-2025 (USD Million)
Table 407 North America: Lithium Chloride & Other Derivatives Market Size In Metallurgy, By Country, 2018-2025 (Kt)
Table 408 North America: Lithium Chloride & Other Derivatives Market Size In Metallurgy, By Country, 2018-2025 (USD Million)
Table 409 Europe: Lithium Chloride & Other Derivatives Market Size In Metallurgy, By Country, 2018-2025 (Kt)
Table 410 Europe: Lithium Chloride & Other Derivatives Market Size In Metallurgy, By Country, 2018-2025 (USD Million)
Table 411 Lithium Chloride & Other Derivatives Market Size In Li-Ion Batteries, By Region, 2018-2025 (Kt)
Table 412 Lithium Chloride & Other Derivatives Market Size In Li-Ion Batteries, By Region, 2018-2025 (USD Million)
Table 413 Asia Pacific: Lithium Chloride & Other Derivatives Market Size In Li-Ion Batteries, By Country, 2018-2025 (Kt)
Table 414 Asia Pacific: Lithium Chloride & Other Derivatives Market Size In Li-Ion Batteries, By Country, 2018-2025 (USD Million)
Table 415 North America: Lithium Chloride & Other Derivatives Market Size In Li-Ion Batteries, By Country, 2018-2025 (Tons)
Table 416 North America: Lithium Chloride & Other Derivatives Market Size In Li-Ion Batteries, By Country, 2018-2025 (USD Million)
Table 417 Europe: Lithium Chloride & Other Derivatives Market Size In Li-Ion Batteries, By Country, 2018-2025 (Tons)
Table 418 Europe: Lithium Chloride & Other Derivatives Market Size In Li-Ion Batteries, By Country, 2018-2025 (USD Million)
Table 419 Lithium Chloride & Other Derivatives Market Size In Glass & Ceramics, By Region, 2018-2025 (Tons)
Table 420 Lithium Chloride & Other Derivatives Market Size In Glass & Ceramics, By Region, 2018-2025 (USD Million)
Table 421 Asia Pacific: Lithium Chloride & Other Derivatives Market Size In Glass & Ceramics, By Country, 2018-2025 (Tons)
Table 422 Asia Pacific: Lithium Chloride & Other Derivatives Market Size In Glass & Ceramics, By Country, 2018-2025 (USD Million)
Table 423 North America: Lithium Chloride & Other Derivatives Market Size In Glass & Ceramics, By Country, 2018-2025 (Tons)
Table 424 North America: Lithium Chloride & Other Derivatives Market Size In Glass & Ceramics, By Country, 2018-2025 (USD Million)
Table 425 Europe: Lithium Chloride & Other Derivatives Market Size In Glass & Ceramics, By Country, 2018-2025 (Tons)
Table 426 Europe: Lithium Chloride & Other Derivatives Market Size In Glass & Ceramics, By Country, 2018-2025 (USD Million)
Table 427 Lithium Chloride & Other Derivatives Market Size In Lubricants, By Region, 2018-2025 (Tons)
Table 428 Lithium Chloride & Other Derivatives Market Size In Lubricants, By Region, 2018-2025 (USD Million)
Table 429 Asia Pacific: Lithium Chloride & Other Derivatives Market Size In Lubricants, By Country, 2018-2025 (Tons)
Table 430 Asia Pacific: Lithium Chloride & Other Derivatives Market Size In Lubricants, By Country, 2018-2025 (USD Million)
Table 431 North America: Lithium Chloride & Other Derivatives Market Size In Lubricants, By Country, 2018-2025 (Tons)
Table 432 North America: Lithium Chloride & Other Derivatives Market Size In Lubricants, By Country, 2018-2025 (USD Million)
Table 433 Europe: Lithium Chloride & Other Derivatives Market Size In Lubricants, By Country, 2018-2025 (Tons)
Table 434 Europe: Lithium Chloride & Other Derivatives Market Size In Lubricants, By Country, 2018-2025 (USD Million)
Table 435 Lithium Chloride & Other Derivatives Market Size In Polymers, By Region, 2018-2025 (Tons)
Table 436 Lithium Chloride & Other Derivatives Market Size In Polymers, By Region, 2018-2025 (USD Million)
Table 437 Asia Pacific: Lithium Chloride & Other Derivatives Market Size In Polymers, By Country, 2018-2025 (Tons)
Table 438 Asia Pacific: Lithium Chloride & Other Derivatives Market Size In Polymers, By Country, 2018-2025 (USD Million)
Table 439 North America: Lithium Chloride & Other Derivatives Market Size In Polymers, By Country, 2018-2025 (Tons)
Table 440 North America: Lithium Chloride & Other Derivatives Market Size In Polymers, By Country, 2018-2025 (USD Million)
Table 441 Europe: Lithium Chloride & Other Derivatives Market Size In Polymers, By Country, 2018-2025 (Tons)
Table 442 Europe: Lithium Chloride & Other Derivatives Market Size In Polymers, By Country, 2018-2025 (USD Million)
Table 443 Lithium Chloride & Other Derivatives Market Size In Medical, By Region, 2018-2025 (Tons)
Table 444 Lithium Chloride & Other Derivatives Market Size In Medical, By Region, 2018-2025 (USD Million)
Table 445 Asia Pacific: Lithium Chloride & Other Derivatives Market Size In Medical, By Country, 2018-2025 (Tons)
Table 446 Asia Pacific: Lithium Chloride & Other Derivatives Market Size In Medical, By Country, 2018-2025 (USD Million)
Table 447 North America: Lithium Chloride & Other Derivatives Market Size In Medical, By Country, 2018-2025 (Tons)
Table 448 North America: Lithium Chloride & Other Derivatives Market Size In Medical, By Country, 2018-2025 (USD Thousand)
Table 449 Europe: Lithium Chloride & Other Derivatives Market Size In Medical, By Country, 2018-2025 (Tons)
Table 450 Europe: Lithium Chloride & Other Derivatives Market Size In Medical, By Country, 2018-2025 (USD Thousand)
Table 451 Lithium Chloride & Other Derivatives Market Size, By Region, 2018-2025 (Kt)
Table 452 Lithium Chloride & Other Derivatives Market Size, By Region, 2018-2025 (USD Million)
Table 453 Lithium Compounds Market Size, By End Use, 2018-2025 (Kt)
Table 454 Lithium Compounds Market Size, By End Use, 2018-2025 (USD Million)
Table 455 Lithium Requirement In Batteries Across End Uses
Table 456 Li-Ion Batteries: Lithium Compounds Market Size, By Region, 2018-2025 (Kt)
Table 457 Li-Ion Batteries: Lithium Compounds Market Size, By Region, 2018-2025 (USD Million)
Table 458 Glass & Ceramics: Lithium Compounds Market Size, By Region, 2018-2025 (Kt)
Table 459 Glass & Ceramics: Lithium Compounds Market Size, By Region, 2018-2025 (USD Million)
Table 460 Medical: Lithium Compounds Market Size, By Region, 2018-2025 (Kt)
Table 461 Medical: Lithium Compounds Market Size, By Region, 2018-2025 (USD Million)
Table 462 Lubricants: Lithium Compounds Market Size, By Region, 2018-2025 (Kt)
Table 463 Lubricants: Lithium Compounds Market Size, By Region, 2018-2025 (USD Million)
Table 464 Metallurgy: Lithium Compounds Market Size, By Region, 2018-2025 (Kt)
Table 465 Metallurgy: Lithium Compounds Market Size, By Region, 2018-2025 (USD Million)
Table 466 Polymers: Lithium Compounds Market Size, By Region, 2018-2025 (Kt)
Table 467 Polymers: Lithium Compounds Market Size, By Region, 2018-2025 (USD Million)
Table 468 Other End Uses: Lithium Compounds Market Size, By Region, 2018-2025 (Kt)
Table 469 Others: Lithium Compounds Market Size, By Region, 2018-2025 (USD Million)
Table 470 Lithium Compounds Market Size, By Region, 2018-2025 (Kt)
Table 471 Lithium Compounds Market Size, By Region, 2018-2025 (USD Million)
Table 472 Asia Pacific: Lithium Compounds Market Size, By Country, 2018–2025 (Kt)
Table 473 Asia Pacific: Lithium Compounds Market Size, By Country, 2018–2025 (USD Million)
Table 474 Asia Pacific: Lithium Compounds Market Size, By Derivative, 2018-2025 (Kt)
Table 475 Asia Pacific: Lithium Compounds Market Size, By Derivative, 2018-2025 (USD Million)
Table 476 Asia Pacific: Lithium Compounds Market Size, By End Use, 2018–2025 (Kt)
Table 477 Asia Pacific: Lithium Compounds Market Size, By End Use, 2018–2025 (USD Million)
Table 478 China: Lithium Compounds Market Size, By Derivative, 2018–2025 (Kt)
Table 479 China: Lithium Compounds Market Size, By Derivative, 2018–2025 (USD Million)
Table 480 China: Lithium Compounds Market Size, By End Use, 2018–2025 (Kt)
Table 481 China: Lithium Compounds Market Size, By End Use, 2018–2025 (USD Million)
Table 482 Japan: Lithium Compounds Market Size, By Derivative, 2018–2025 (Kt)
Table 483 Japan: Lithium Compounds Market Size, By Derivative, 2018–2025 (USD Million)
Table 484 Japan: Lithium Compounds Market Size, By End Use, 2018–2025 (Kt)
Table 485 Japan: Lithium Compounds Market Size, By End Use, 2018–2025 (USD Million)
Table 486 South Korea: Lithium Compounds Market Size, By Derivative, 2018–2025 (Kt)
Table 487 South Korea: Lithium Compounds Market Size, By Derivative, 2018–2025 (USD Million)
Table 488 South Korea: Lithium Compounds Market Size, By End Use, 2018–2025 (Kt)
Table 489 South Korea: Lithium Compounds Market Size, By End Use, 2018–2025 (USD Million)
Table 490 Rest of Asia Pacific: Lithium Compounds Market Size, By Derivative, 2018–2025 (Kt)
Table 491 Rest of Asia Pacific: Lithium Compounds Market Size, By Derivative, 2018–2025 (USD Million)
Table 492 Rest of Asia Pacific: Lithium Compounds Market Size, By End Use, 2018–2025 (Kt)
Table 493 Rest of Asia Pacific: Lithium Compounds Market Size, By End Use, 2018–2025 (USD Million)
Table 494 North America: Lithium Compounds Market Size, By Country, 2018–2025 (Kt)
Table 495 North America : Lithium Compounds Market Size, By Country, 2018–2025 (USD Million)
Table 496 North America: Lithium Compounds Market Size, By Derivative, 2018-2025 (Kt)
Table 497 North America: Lithium Compounds Market Size, By Derivative, 2018-2025 (USD Million)
Table 498 North America: Lithium Compounds Market Size, By End Use, 2018–2025 (Kt)
Table 499 North America: Lithium Compounds Market Size, By End Use, 2018–2025 (USD Million)
Table 500 US: Lithium Compounds Market Size, By Derivative, 2018–2025 (Kt)
Table 501 US: Lithium Compounds Market Size, By Derivative, 2018–2025 (USD Million)
Table 502 US: Lithium Compounds Market Size, By End USe, 2018–2025 (Kt)
Table 503 US: Lithium Compounds Market Size, By End Use, 2018–2025 (USD Million)
Table 504 Canada: Lithium Compounds Market Size, By Derivative, 2018–2025 (Kt)
Table 505 Canada: Lithium Compounds Market Size, By Derivative, 2018–2025 (USD Million)
Table 506 Canada: Lithium Derivatives Market, By End Use, 2018–2025 (Kt)
Table 507 Canada: Lithium Compounds Market Size, By End Use, 2018–2025 (USD Million)
Table 508 Mexico: Lithium Compounds Market Size, By Derivative, 2018–2025 (Kt)
Table 509 Mexico: Lithium Compounds Market Size, By Derivative, 2018–2025 (USD Million)
Table 510 Mexico: Lithium Compounds Market Size, By End Use, 2018–2025 (Kt)
Table 511 Mexico: Lithium Compounds Market Size, By End Use, 2018–2025 (USD Million)
Table 512 Europe: Lithium Compounds Market Size, By Country, 2018–2025 (Kt)
Table 513 Europe: Lithium Compounds Market Size, By Country, 2018–2025 (USD Million)
Table 514 Europe: Lithium Compounds Market Size, By Derivative, 2018-2025 (Kt)
Table 515 Europe: Lithium Compounds Market Size, By Derivative, 2018-2025 (USD Million)
Table 516 Europe: Lithium Compounds Market Size, By End Use, 2018–2025 (Kt)
Table 517 Europe: Lithium Compounds Market Size, By End Use, 2018–2025 (USD Million)
Table 518 Germany: Lithium Compounds Market Size, By Derivative, 2018–2025 (Kt)
Table 519 Germany: Lithium Compounds Market Size, By Derivative, 2018–2025 (USD Million)
Table 520 Germany: Lithium Compounds Market Size, By End Use, 2018–2025 (Kt)
Table 521 Germany: Lithium Compounds Market Size, By End Use, 2018–2025 (USD Million)
Table 522 France: Lithium Compounds Market Size, By Derivative, 2018–2025 (Kt)
Table 523 France: Lithium Compounds Market Size, By Derivative, 2018–2025 (USD Million)
Table 524 France: Lithium Compounds Market Size, By End Use, 2018–2025 (Kt)
Table 525 France: Lithium Compounds Market Size, By End Use, 2018–205 (USD Million)
Table 526 UK: Lithium Compounds Market Size, By Derivative, 2018–2025 (Kt)
Table 527 UK: Lithium Compounds Market Size, By Derivative, 2018–2025 (USD Million)
Table 528 UK: Lithium Compounds Market Size, By End Use, 2018–2025 (Kt)
Table 529 UK: Lithium Compounds Market Size, By End Use, 2018–2025 (USD Million)
Table 530 Rest of Europe: Lithium Compounds Market Size, By Derivative, 2018–2025 (Kt)
Table 531 Rest of Europe: Lithium Compounds Market Size, By Derivative, 2018–2025 (USD Million)
Table 532 Rest of Europe: Lithium Compounds Market Size, By End Use, 2018–2025 (Kt)
Table 533 Rest of Europe: Lithium Compounds Market Size, By End Use, 2018–2025 (USD Million)
Table 534 RoW: Lithium Compounds Market Size, By Derivative, 2018–2025 (Kt)
Table 535 RoW: Lithium Compounds Market Size, By Derivative, 2018–2025 (USD Million)
Table 536 RoW: Lithium Compounds Market Size, By End Use, 2018-2025 (Kt)
Table 537 RoW: Lithium Compounds Market Size, By End Use, 2018-2025 (USD Million)
Table 538 Acquisitions, 2014–2019
Table 539 Agreements, 2014–2019
Table 540 Expansions, 2014–2019
Table 541 Joint Ventures, 2014–2019
Table 542 Innovative Technology, 2014–2019
Table 543 Divestments, 2014–2019
List of Figures (60 Figures)
Figure 1 Lithium Compounds Market Segmentation
Figure 2 Lithium Compounds Market: Research Design
Figure 3 Breakdown of Primary Interviews, By Company, Designation, and Region
Figure 4 Market Size Estimation: Bottom-Up Approach
Figure 5 Market Size Estimation: Top-Down Approach
Figure 6 Market Breakdown and Data Triangulation
Figure 7 Li-Ion Batteries Segment Expected to Register the Highest CAGR During the Forecast Period (Kt)
Figure 8 Lithium Carbonate Segment Is Estimated to Account for the Largest Share of Lithium Compounds Market In 2020
Figure 9 Asia Pacific Is Estimated to Account for the Largest Share of Lithium Compounds Market In 2020
Figure 10 Groeing Demand for Lithium-Ion Batteries Is Expected Drive the Lithium Compounds Market From 2020 to 2025
Figure 11 Asia Pacific to Be the Fastest-Growing Market for Lithium Compounds Between 2020 and 2025 (USD Million)
Figure 12 Lithium Carbonate and China are Estimated to Account for the Largest Share of the Lithium Compounds Market In Asia Pacific In 2020
Figure 13 Lithium Compounds Market In China Is Projected to Grow at the Highest CAGR From 2020 to 2025
Figure 14 Drivers, Restraints, Opportunities, and Challenges
Figure 15 Electric Car Stock, 2013-2018
Figure 16 Electric Car Market Share In Electric Vehicles Initiative (Evi), By Country, 2018
Figure 17 Global Installation of Publicly Available Electric Vehicle Chargers, 2013-2018
Figure 18 Lithium Compounds Market: Porter’s Five Forces Analysis
Figure 19 Lithium Processing Procedure
Figure 20 Lithium Carbonate to Dominate the Lithium Compounds Market, 2020 vs. 2025 (Kt)
Figure 21 Li-Ion Batteries Segment Projected to Register High Growth Between 2020 and 2025
Figure 22 Lithium Carbonate Segment Projected to Register High Growth In Asia Pacific Between 2020 and 2025
Figure 23 Li-Ion Batteries Segment to Register Largest Share In Lithium Hydroxide Market Between 2020 and 2025 (Kt)
Figure 24 Asia Pacific to Register Largest Share In Lithium Hydroxide Market Between 2020 and 2025 (Kt)
Figure 25 Li-Ion Batteries Segment Projected to Register Fastest Growth In Lithium Metal Market Between 2020 and 2025 (Kt)
Figure 26 Asia Pacific Projected to Register Highest Growth In Lithium Metal Market Between 2020 and 2025 (Kt)
Figure 27 Li-Ion Batteries Segment Projected to Hold Largest Share In Lithium Concentrate Market Between 2020 and 2025 (Kt)
Figure 28 Asia Pacific Projected to Dominate the Lithium Concentrate Segment During the Forecast Period (Kt)
Figure 29 Polymers Segment Projected to Register Highest Growth Rate In Butyl Lithium Market Between 2020 and 2025 (Kt)
Figure 30 Asia Pacific Market for Butyl Lithium Projected to Register Fastest Growth Between 2020 and 2025 (Kt)
Figure 31 Li-Ion Batteries Projected to Register Fastest Growth In Lithium Chloride & Other Derivatives Market Between 2020 and 2025
Figure 32 Asia Pacific to Lead the Market for Lithium Chloride & Other Derivatives Between 2020 and 2025 (Kt)
Figure 33 Li-Ion Batteries Segment to Register the Highest CAGR During the Forecast Period (Kt)
Figure 34 Asia Pacific Is Expected to Be the Largest Lithium Compounds Market for Li-Ion Batteries (Kt)
Figure 35 Asia Pacific Is Expected to Dominate the Lithium Compounds Market for Glass & Ceramics (Kt)
Figure 36 Asia Pacific Expected to Be the Fastest-Growing Lithium Compounds Market for Medical End Uses (Kt)
Figure 37 Asia Pacific to Dominate the Lithium Compounds Market for Lubricants (Kt)
Figure 38 Asia Pacific Expected to Lead the Lithium Compounds Market In Metallurgy (Kt)
Figure 39 Asia Pacific to Register the Highest Growth Rate In Lithium Polymers Market (Kt)
Figure 40 Regional Snapshot – China Expected to Be the Fastest-Growing Market (2020–2025)
Figure 41 Asia Pacific Market Snapshot: China to Register the Highest Growth
Figure 42 North America Market Snapshot: US Dominates the Lithium Compounds Market
Figure 43 Europe Snapshot: Germany to Dominate Lithium Compounds Market In Europe
Figure 44 Companies Adopted Both Organic and Inorganic Growth Strategies Between January 2014 and December 2019
Figure 45 Lithium Compounds Market: Competitive Landscape Mapping, 2019
Figure 46 Albemarle Corporation, Led the Lithium Compounds Market In 2019
Figure 47 Albemarle Corporation: Company Snapshot
Figure 48 Albemarle Corporation: SWOT Analysis
Figure 49 Sociedad Quimica Y Minera De Chile S.A. (SQM).: Company Snapshot
Figure 50 Sociedad Quimica Y Minera De Chile S.A. (SQM): SWOT Analysis
Figure 51 Livent Corporation: Company Snapshot
Figure 52 Livent Corporation: SWOT Analysis
Figure 53 Tianqi Lithium Industries: Company Snapshot
Figure 54 Tianqi Lithium Industries Inc.: SWOT Analysis
Figure 55 Ganfeng Lithium Co. Ltd.: Company Snapshot
Figure 56 SWOT Analysis: Ganfeng Lithium Co. Ltd.
Figure 57 Galaxy Resource Limited: Company Snapshot
Figure 58 Orocobre Limited: Company Snapshot
Figure 59 Tvel Fuel Company: Company Snapshot
Figure 60 Burwill Holdings Limited: Company Snapshot
This study involved four major activities to estimate the current size of the lithium compounds market. Exhaustive secondary research was undertaken to collect information on the lithium compounds market, its peer markets, and its parent market. The next step was to validate these findings, assumptions, and sizing with industry experts across the lithium compounds value chain through primary research. Both, the top-down and bottom-up approaches were employed to estimate the overall size of the market. Thereafter, the market breakdown and data triangulation procedures were used to estimate the sizes of different segments and subsegments of the lithium compounds market.
Secondary Research
As a part of the secondary research process, various secondary sources such as Hoovers, Bloomberg, BusinessWeek, Reuters, and Factiva were referred for identifying and collecting information for this study on the lithium compounds market. Secondary sources included annual reports, press releases & investor presentations of companies, white papers, certified publications, articles by recognized authors, authenticated directories, and databases.
Secondary research was mainly conducted to obtain key information about the supply chain of the industry, the monetary chain of the market, the total pool of players, market classification & segmentation according to industry trends to the bottom-most level, regional markets, and key developments undertaken from both, market- and technology-oriented perspectives.
Primary Research
As a part of the primary research process, various sources from the supply and demand sides were interviewed to obtain qualitative and quantitative information for this report on the lithium compounds market. Primary sources from the supply side included industry experts such as chief executive officers (CEOs), vice presidents, marketing directors, technology and innovation directors, and related key executives from various companies and organizations operating in the lithium compounds market. Primary sources from the demand side included directors, marketing heads, and purchase managers from various end-use industries. Following is the breakdown of the primary respondents.
To know about the assumptions considered for the study, download the pdf brochure
Market Size Estimation
Both, the top-down and bottom-up approaches were used to estimate and validate the total size of the lithium compounds market. These methods were also used extensively to estimate the size of various segments and subsegments of the market. The research methodology used to estimate the market size included the following:
- The key players in the industry and markets were identified through extensive secondary research.
- The supply chain of the industry and the market size, in terms of value, were determined through primary and secondary research processes.
- All percentage shares, splits, and breakdowns were determined using secondary sources and verified through primary sources.
Data Triangulation
After arriving at the overall size from the market size estimation process explained above, the total market was split into several segments and subsegments. The data triangulation and market breakdown procedures were used, wherever applicable, to complete the overall market engineering process and arrive at the exact statistics for all segments and subsegments of the market. The data was triangulated by studying various factors and trends from both, the demand and supply sides. In addition to this, the market size was validated using both, the top-down and bottom-up approaches.
Objectives of the Report
- To define, describe, and forecast the lithium compounds market based on end use, derivative, and region
- To forecast the size of the market and its segments with respect to five main regions, namely, North America, Europe, Asia Pacific, and Rest of the World, along with their respective key countries
- To provide detailed information regarding major factors such as drivers, restraints, opportunities, and challenges, influencing the growth of the market
- To strategically analyze micromarkets with respect to individual growth trends, future prospects, and contribution to the total market
- To analyze opportunities in the market for stakeholders and provide a detailed competitive landscape of market leaders
- To strategically profile key players and comprehensively analyze their market share and core competencies
- To analyze competitive developments such as acquisitions, agreements, expansions, joint ventures, and divestments, in the lithium compounds market
The following customization options are available for the report:
- Further breakdown of the Asia Pacific and Europe lithium compounds markets
- Product matrix, which gives a detailed comparison of the product portfolio of each company
- Detailed analysis and profiles of additional market players (up to 3)


Growth opportunities and latent adjacency in Lithium Compounds Market