Lithium Titanate Oxide (LTO) Battery Market Size, Share, Statistics and Industry Growth Analysis Report by Capacity (Below 3,000 mAh, 3,001–10,000 mAh, Above 10,000 mAh), Voltage, Application (Consumer Electronics, Automotive), Component (Electrodes, Electrolytes), Material and Region - Global Forecast to 2028
Updated on : October 23, 2024
Lithium Titanate Oxide (LTO) Battery Market Size
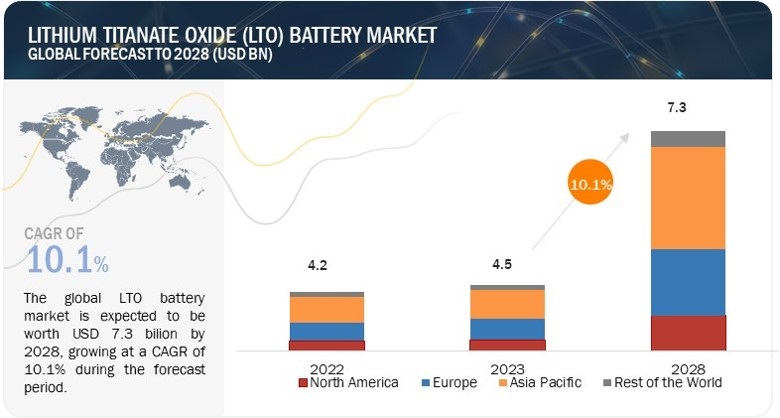
[183 Pages Report] The global Lithium Titanate Oxide (LTO) Battery Market size is expected to grow from USD 4.5 billion in 2023 to USD 7.3 billion by 2028, growing at a CAGR of 10.1% from 2023 to 2028.
Due to the increase in the trend of industrial automation, the demand for advanced material-handling equipment has also increased. Over the course of time, various technological advancements have taken place in the material handling equipment industry including electrification of industrial vehicles. Automated material handling and lifting equipment including automated guided vehicles (AGVs), autonomous mobile robots (AMRs), and industrial trucks have undergone various technological advancements and have started using batteries such as LTO for increased efficiency and reduced carbon emissions.
Lithium Titanate Oxide (LTO) Battery Market Forecast to 2028
To know about the assumptions considered for the study, Request for Free Sample Report
Lithium Titanate Oxide (LTO) Battery Market Trends & Dynamics
DRIVERS: Growing demand for hybrid electric vehicles (HEVs) and plug-in hybrid electric vehicles (PHEVs)
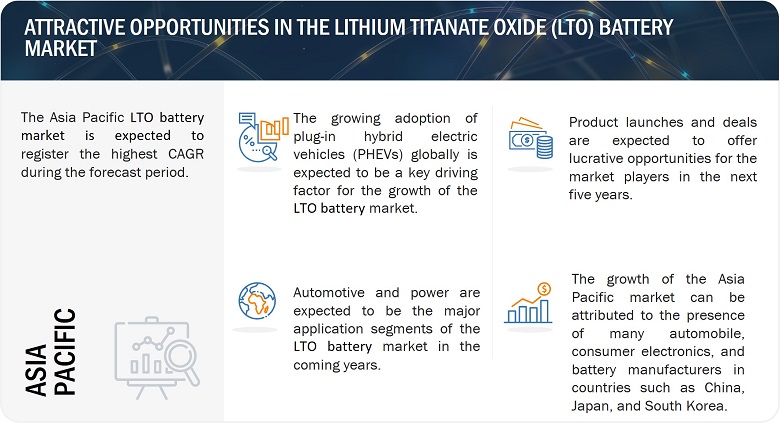
The rising adoption of hybrid electric vehicles (HEVs) and plug-in hybrid electric vehicles (PHEVs) is fueling the adoption of lithium-ion chemistry-based batteries, such as LTO batteries. Several governments worldwide are actively promoting cleaner transportation alternatives to combat climate change, which has spurred the use of HEVs/PHEVs. Increasing environmental concerns, coupled with government subsidies, tax incentives, and strict emission regulations, are propelling the expansion of the global plug-in hybrid electric vehicle (PHEV) market. Public awareness campaigns such as the “GO Electric” Campaign by the Bureau of Energy Efficiency, India, and the EV30@30 campaign by a global forum called Clean Energy Ministerial (CEM) are being organized to educate individuals about the benefits of PHEVs compared with conventional vehicles. This trend will help to drive the adoption of LTO batteries.
RESTRAINTS: Higher cost compared with other lithium-ion battery chemistries
The higher cost of LTO batteries compared with other lithium-ion battery chemistries is predominantly attributed to the raw materials used in their production, particularly high-purity lithium and titanium. The manufacturing process for LTO batteries also involves the use of specialized materials and techniques, resulting in higher production costs. As a result, the higher cost of LTO batteries has hindered their widespread adoption in certain applications where cost competitiveness is crucial. Further, the cost factor challenges LTO batteries to achieve broad market acceptance, especially in price-sensitive markets such as consumer electronics and electric vehicles. The higher upfront cost of LTO batteries deters manufacturers and consumers from choosing them over alternative battery chemistries that offer similar performance at a lower cost.
OPPORTUNITIES: Increasing demand for LTO battery-based devices in medical sector
LTO batteries are known for their excellent safety features, including a lower risk of thermal runaway and reduced fire hazard compared to other lithium-ion chemistries. This is paramount in medical devices, where patient safety and reliable operation are critical. Metabolism trackers, smart anti-snoring muscle stimulators, pacemakers, medical defibrillators, oximeters, medical robots, infusion pumps, and ventilators are some of the medical devices that are potential applications of LTO batteries. The medical device industry has experienced significant growth worldwide in recent years. Several factors contribute to the growth of the medical device industry, including technological advancements, an aging population, increasing healthcare expenditure, and a rise in lifestyle-related diseases. The growing expenditure in the medical sector is expected to fuel the demand for LTO batteries and create growth opportunities for the market players.
CHALLENGES: Availability of alternative lithium-ion chemistries
LTO batteries face tough competition from other well-established lithium-ion chemistries such as lithium nickel manganese cobalt (NMC), lithium iron phosphate (LFP), and lithium cobalt oxide (LCO), as well as emerging battery technologies such as solid-state batteries, silicon anode batteries, and lithium-sulfur batteries. These alternative technologies offer higher energy density and are available at lower costs, posing a challenge to LTO batteries in terms of market competitiveness. Continual innovation, cost reduction efforts, and differentiation based on unique properties will be crucial for LTO batteries to remain competitive. Besides, the awareness regarding the benefits of LTO batteries is lower compared with other lithium-ion chemistries. Many industries and consumers are more familiar with other battery technologies, such as lithium iron phosphate (LFP) or lithium nickel manganese cobalt oxide (NMC). Hence, raising awareness about the benefits and potential applications of LTO batteries and educating potential customers and end-users about their unique characteristics is essential for market growth.
LTO Battery Market Ecosystem
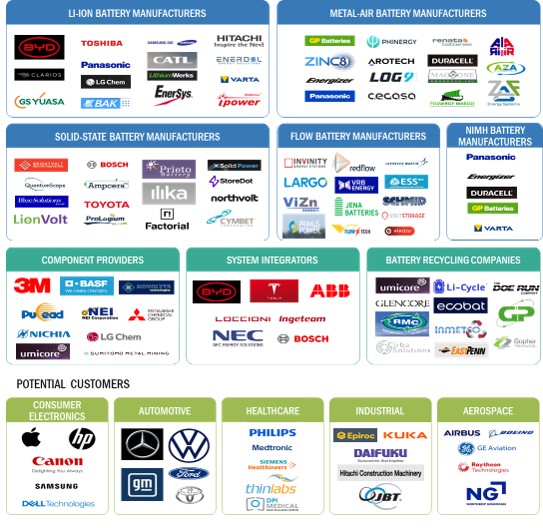
Prominent companies in this LTO Battery industry include well-established manufacturers such as Toshiba Corporation (Japan), Microvast Holdings, Inc. (US), and Nichicon Corporation (Japan). These companies have been operating in the market for several years and possess a diversified product portfolio, state-of-the-art technologies, and strong global sales and marketing networks. Along with the well-established companies, there are a large number of small and medium scale companies operating in this market, such as LiTech Power Co.,Ltd. (Germany), OSN Power Energy Limited (China), GRINERGY (South Korea).
Lithium Titanate Oxide (LTO) Battery Market Share
High voltage batteries segment is expected hold the largest market share during the forecast period.
High voltage batteries are used in marine, power, automotive, industrial, aerospace, and telecommunication applications. They are crucial in marine and aerospace applications, providing robust power for electric propulsion, energy storage, and equipment in submarines, ships, unmanned aerial vehicles (UAVs), and military vehicles. These batteries enhance efficiency, reduce emissions, and ensure reliability in demanding environments, aligning with the growing emphasis on advanced technology in these applications. Compared with traditional lead-acid and nickel-cadmium batteries, they offer higher power, longer lifespan, and enhanced safety features. With high power capacities and deep-cycle capabilities, these batteries deliver exceptional performance. Additionally, they are equipped with automatic battery management systems that ensure peak performance, prevent overcharging and overheating, and optimize cell cycle life.
The market for above 10,000 mAh capacity is projected to gain highest market share during the forecast period
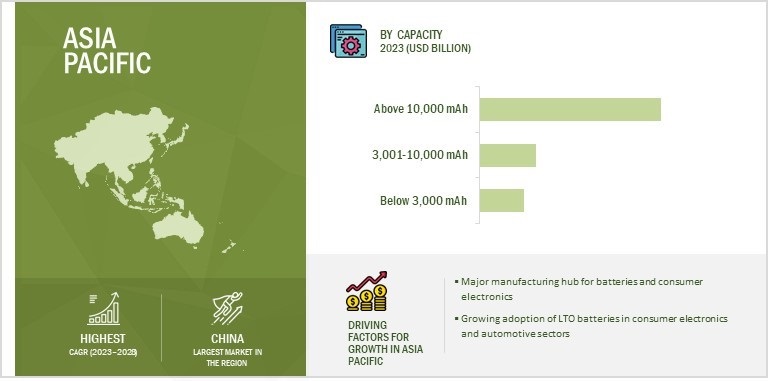
Above 10,000 mAh LTO batteries are used in applications that require high battery power, such as electric buses, electric ferries, energy storage systems, hybrid electric buses/trucks, railways, cranes, and industrial vehicles such as electric forklifts, AGVs, and AMRs. These batteries are also being used in the aerospace and marine industries. The growing hybrid electric vehicle industry and the demand for renewable energy storage will drive the adoption of LTO batteries in the market.
Lithium Titanate Oxide (LTO) Battery Market Statistics by Region
To know about the assumptions considered for the study, download the pdf brochure
Lithium Titanate Oxide (LTO) Battery Market Regional Analysis
The market in Asia Pacific is projected to grow at the highest CAGR from 2023 to 2028.
The Asia Pacific market has been studied for China, Japan, India, South Korea, and the Rest of the Asia Pacific. The presence of several electronics manufacturers in the region, such as Panasonic Holdings Corporation (Japan), Sony Corporation (Japan), Samsung Electronics (South Korea), and LG Electronics Inc. (South Korea), is a crucial factor driving the regional market growth. The countries in Asia Pacific are moving toward green energy and, therefore, are focusing on developing an ecosystem to manufacture LTO batteries locally. The region has become an attractive automotive market, emerging as a hub for automobile production in recent years. The increasing purchasing power of the population has stimulated the demand for consumer electronics and automobiles, thereby generating demand for LTO batteries.
Top Lithium Titanate Oxide (LTO) Battery Companies: Key players
Some of the key players in global LTO battery companies include
- Toshiba Corporation (Japan),
- Microvast Holdings, Inc. (US),
- Nichicon Corporation (Japan),
- Leclanché SA (Switzerland),
- Gree Altairnano New Energy Inc. (China),
- Clarios (US),
- AA Portable Power Corp. (US),
- GRINERGY (South Korea),
- Zenaji Pty Ltd. (Australia),
- Log9 Materials (India),
- LiTech Power Co., Ltd. (Germany) and others.
Lithium Titanate Oxide (LTO) Battery Market Report Scope
|
Report Metric |
Details |
|
Estimated Market Size in 2023 |
USD 4.5 Billion |
|
Projected Market Size in 2028 |
USD 7.3 Billion |
|
Growth Rate |
CAGR of 10.1% |
|
Lithium Titanate Oxide (LTO) Battery Market size available for years |
2019—2028 |
|
Base year |
2022 |
|
Forecast period |
2023—2028 |
|
Forecast Units |
USD Millions/USD Billions and Million Units |
|
Segments Covered |
Capacity, Voltage, and Application |
|
Geographic regions covered |
North America, Europe, Asia Pacific, and RoW |
|
Companies covered |
Toshiba Corporation (Japan), Microvast Holdings, Inc. (US), Nichicon Corporation (Japan), Leclanché SA (Switzerland), Gree Altairnano New Energy Inc. (China), Clarios (US), AA Portable Power Corp. (US), GRINERGY (South Korea), Zenaji Pty Ltd. (Australia), Log9 Materials (India), LiTech Power Co., Ltd. (Germany) and Others. A total of 20 players covered |
Lithium Titanate Oxide (LTO) Battery Market Highlights
This research report categorizes the LTO battery market by component, material, capacity, voltage, application, and region.
|
Segment |
Subsegment |
|
Lithium Titanate Oxide (LTO) Battery Market size By Component: |
|
|
Lithium Titanate Oxide (LTO) Battery Market size By Material: |
|
|
By Capacity: |
|
|
By Voltage: |
|
|
By Application: |
|
|
Lithium Titanate Oxide (LTO) Battery Market size By Region |
|
Recent Developments in Lithium Titanate Oxide (LTO) Battery Industry
- In June 2023, Nichicon Corporation introduced evaluation boards to accelerate the design process for applications with small lithium-titanate rechargeable batteries. The evaluation board used to configure a power supply using environmental power generation by inserting the SLB series into the board and connecting it to a power generation device.
- In January 2022, Toshiba Corporation launched a 20Ah-HP SCiB rechargeable lithium-ion battery cell that can deliver high energy and power.
- In June 2021, Leclanché SA introduced an M3 power module with high energy and power density compared to the previous module. The company’s module offers a very-high cycle life of up to 20,000 cycles (LTO) or 8,000 cycles (G/NMC), significantly reducing total ownership cost, making it ideal for commercial applications.
Frequently Asked Questions (FAQs):
What is the total CAGR expected to be recorded for the LTO battery market during 2023-2028?
The global LTO battery market is expected to record a CAGR of 10.1% from 2023–2028.
What are the driving factors for the LTO battery market?
Growing adoption of HEVs and PHEVs in automotive industry is one of the driving factors for the LTO battery market.
Which application will grow at a fast rate in the future?
The power application is expected to grow at the highest CAGR during the forecast period. As the countries across the world are focusing on achieving net-zero carbon emissions, thus, they are focusing on increasing investments in renewable energy sources such as solar and wind.
Which are the significant players operating in the LTO battery market?
Toshiba Corporation (Japan), Microvast Holdings, Inc. (US), Leclanché SA (Switzerland), and Nichicon Corporation (Japan) are among a few top players in the LTO battery market.
Which region will grow at a fast rate in the future?
The LTO battery market in Asia Pacific is expected to grow at the highest CAGR during the forecast period.
To speak to our analyst for a discussion on the above findings, click Speak to Analyst


- 5.1 INTRODUCTION
-
5.2 MARKET DYNAMICSDRIVERS- Growing demand for hybrid electric vehicles (HEVs) and plug-in hybrid electric vehicles (PHEVs)- Rising demand for renewable energy storage systemsRESTRAINTS- Higher cost compared with other lithium-ion battery chemistriesOPPORTUNITIES- Rising demand for battery-operated material-handling equipment- Increasing demand for LTO battery-based devices in medical sectorCHALLENGES- Availability of alternative lithium-ion chemistries
- 5.3 VALUE CHAIN ANALYSIS
-
5.4 ECOSYSTEM ANALYSIS
-
5.5 PRICING ANALYSISAVERAGE SELLING PRICE (ASP) TREND OF LITHIUM-ION BATTERY PACKS AND CELLSAVERAGE SELLING PRICE (ASP) OF LTO BATTERIES OFFERED BY THREE KEY PLAYERSAVERAGE SELLING PRICE (ASP) TREND, BY REGION
-
5.6 TRENDS/DISRUPTIONS IMPACTING CUSTOMERS’ BUSINESSES
-
5.7 TECHNOLOGY ANALYSISLITHIUM-SILICON BATTERYSOLID-STATE BATTERYZINC-MANGANESE BATTERYLITHIUM-SULFUR BATTERYSODIUM-SULFUR BATTERYMETAL-AIR BATTERYLIQUID-METAL BATTERYPOTASSIUM METAL BATTERYVANADIUM FLOW BATTERY
-
5.8 PORTER’S FIVE FORCES ANALYSISBARGAINING POWER OF SUPPLIERSBARGAINING POWER OF BUYERSTHREAT OF NEW ENTRANTSTHREAT OF SUBSTITUTESINTENSITY OF COMPETITIVE RIVALRY
-
5.9 KEY STAKEHOLDERS AND BUYING CRITERIAKEY STAKEHOLDERS IN BUYING PROCESSBUYING CRITERIA
-
5.10 CASE STUDY ANALYSISAGP CORPORATION DEVELOPED BATTERY-POWERED GPU USING LTO BATTERYMAEDA SEISAKUSHO USED SCIB LTO BATTERIES IN SPIDER CRANES AND MINI CRANES TO REDUCE NOISE LEVELS AND EXHAUST EMISSIONSNICHICON CORPORATION OFFERED SLB SERIES LTO BATTERIES FOR S PENS TO FACILITATE FAST CHARGING RATE AND HIGH STABILITY
-
5.11 TRADE ANALYSISIMPORT SCENARIOEXPORT SCENARIO
-
5.12 PATENT ANALYSIS
- 5.13 KEY CONFERENCES AND EVENTS, 2023–2024
-
5.14 REGULATORY LANDSCAPEREGULATORY BODIES, GOVERNMENT AGENCIES, AND OTHER ORGANIZATIONS
- 5.15 STANDARDS
- 6.1 INTRODUCTION
-
6.2 ELECTRODESFACILITATE ELECTROCHEMICAL REACTIONS IN LTO BATTERIES- Cathode- Anode
-
6.3 ELECTROLYTESMAINTAIN STABLE AND CONDUCTIVE ENVIRONMENT IN LTO BATTERIES
- 7.1 INTRODUCTION
-
7.2 LITHIUM TITANATEOFFERS THERMAL STABILITY AND SAFETY DUE TO SPINEL STRUCTURE
-
7.3 GRAPHITEUSED AS PRIMARY ANODE MATERIAL IN CONVENTIONAL LI-ION BATTERIES
-
7.4 METAL OXIDESOFFERS HIGH ENERGY DENSITY AND EXCELLENT PERFORMANCE
- 8.1 INTRODUCTION
-
8.2 BELOW 3,000 MAHEXPANDING CONSUMER ELECTRONICS INDUSTRY
-
8.3 3,001–10,000 MAHRISING DEMAND FOR HYBRID ELECTRIC VEHICLES (HEVS)
-
8.4 ABOVE 10,000 MAHGROWING REQUIREMENT FOR HIGH-CAPACITY BATTERIES IN HIGH-POWER APPLICATIONS
- 9.1 INTRODUCTION
-
9.2 LOWGROWING ADOPTION OF LTO BATTERIES IN CONSUMER ELECTRONICS INDUSTRY
-
9.3 MEDIUMRISING USE OF LTO BATTERIES IN VARIOUS APPLICATIONS ATTRIBUTED TO LONG OPERATIONAL LIFE
-
9.4 HIGHSUPERIOR PERFORMANCE OVER TRADITIONAL BATTERIES
- 10.1 INTRODUCTION
-
10.2 CONSUMER ELECTRONICSGROWING DEMAND FOR LTO BATTERIES OWING TO HIGH ENERGY DENSITY AND LONG LIFE
-
10.3 AUTOMOTIVEINCREASING GLOBAL ADOPTION OF HYBRID ELECTRIC VEHICLES (HEVS) AND PLUG-IN HYBRID ELECTRIC VEHICLES (PHEVS)- Hybrid electric vehicles (HEVs)- Plug-in hybrid electric vehicles (PHEVs)
-
10.4 AEROSPACEGROWING NEED FOR HIGH-POWER AND SAFE BATTERIES
-
10.5 MARINERISING DEMAND ATTRIBUTED TO FAST CHARGING AND DURABILITY FEATURES
-
10.6 MEDICALGROWING NEED FOR RELIABLE AND SAFE BATTERIES IN MEDICAL DEVICES
-
10.7 INDUSTRIALINCREASING USE OF ELECTRIC MATERIAL HANDLING EQUIPMENT
-
10.8 POWERGROWING DEPLOYMENT OF RENEWABLE ENERGY STORAGE SYSTEMS
-
10.9 TELECOMMUNICATIONLONG LIFE, FAST CHARGING, AND REDUCED CARBON EMISSIONS
- 11.1 INTRODUCTION
-
11.2 NORTH AMERICANORTH AMERICA LITHIUM TITANATE OXIDE (LTO) BATTERY MARKET: RECESSION IMPACTUS- Presence of favorable policies and rising government-led investments in battery industryCANADA- Growing adoption of low and zero-emission vehiclesMEXICO- Rising investments in lithium-ion battery manufacturing
-
11.3 EUROPEEUROPE LITHIUM TITANATE OXIDE (LTO) BATTERY MARKET: IMPACT OF RECESSIONGERMANY- Booming healthcare and automotive sectorsUK- Increasing use of HEVs and PHEVsFRANCE- Rising investments in battery manufacturingREST OF EUROPE
-
11.4 ASIA PACIFICASIA PACIFIC LITHIUM TITANATE OXIDE (LTO) BATTERY MARKET: IMPACT OF RECESSIONCHINA- Presence of abundant titanium reservesJAPAN- Healthy growth of automotive sectorINDIA- Discovery of lithium reservesSOUTH KOREA- Government-led support to promote green initiativesREST OF ASIA PACIFIC
-
11.5 ROWROW LITHIUM TITANATE OXIDE (LTO) BATTERY MARKET: IMPACT OF RECESSIONMIDDLE EAST & AFRICA- Increasing government-led focus on reducing carbon emissionsSOUTH AMERICA- Growing demand for consumer electronics and medical devices

- 12.1 OVERVIEW
- 12.2 KEY STRATEGIES ADOPTED BY MAJOR PLAYERS
- 12.3 REVENUE ANALYSIS, 2018–2022
- 12.4 MARKET SHARE ANALYSIS, 2022
-
12.5 EVALUATION MATRIX OF KEY COMPANIES, 2022STARSEMERGING LEADERSPERVASIVE PLAYERSPARTICIPANTSCOMPANY FOOTPRINT
-
12.6 EVALUATION MATRIX OF STARTUPS/ SMALL AND MEDIUM-SIZED ENTERPRISES (SMES), 2022PROGRESSIVE COMPANIESRESPONSIVE COMPANIESDYNAMIC COMPANIESSTARTING BLOCKSCOMPETITIVE BENCHMARKING OF STARTUPS/SMES
-
12.7 COMPETITIVE SCENARIOS AND TRENDSPRODUCT LAUNCHESDEALS
-
13.1 KEY PLAYERSTOSHIBA CORPORATION- Business overview- Products offered- Recent developments- MnM viewMICROVAST HOLDINGS, INC.- Business overview- Products offered- Recent developments- MnM viewNICHICON CORPORATION- Business overview- Products offered- Recent developments- MnM viewLECLANCHÉ SA- Business overview- Products offered- Recent developments- MnM viewCLARIOS- Business overview- Products offered- Recent developments- MnM viewGREE ALTAIRNANO NEW ENERGY INC.- Business overview- Products offered- Recent developmentsHUNAN HUAHUI NEW ENERGY CO., LTD.- Business overview- Products offeredPADRE ELECTRONICS CO., LIMITED- Business overview- Products offered
-
13.2 OTHER PLAYERSAA PORTABLE POWER CORP.AOT BATTERY TECHNOLOGY CO., LTD.ELB ENERGY GROUPGRINERGYLITECH POWER CO., LTD.LOG9 MATERIALSLTO BATTERY CO., LTD.NEI CORPORATIONOSN POWER ENERGY LIMITEDSHENZHEN SIQI NEW ENERGY COMPANY LIMITEDTARGRAY TECHNOLOGY INTERNATIONAL INC.ZENAJI PTY LTD.
- 14.1 INTRODUCTION
-
14.2 MICRO BATTERY MARKET, BY REGIONINTRODUCTIONNORTH AMERICA- US- Canada- Mexico
- 15.1 INSIGHTS FROM INDUSTRY EXPERTS
- 15.2 DISCUSSION GUIDE
- 15.3 KNOWLEDGESTORE: MARKETSANDMARKETS’ SUBSCRIPTION PORTAL
- 15.4 CUSTOMIZATION OPTIONS
- 15.5 RELATED REPORTS
- 15.6 AUTHOR DETAILS
- TABLE 1 ASSUMPTIONS
- TABLE 2 COMPANIES AND THEIR ROLE IN LITHIUM TITANATE OXIDE (LTO) BATTERY ECOSYSTEM
- TABLE 3 AVERAGE SELLING PRICE (ASP) OF LTO BATTERIES OFFERED BY THREE KEY PLAYERS
- TABLE 4 AVERAGE SELLING PRICE (ASP) TREND, BY REGION
- TABLE 5 LITHIUM TITANATE OXIDE (LTO) BATTERY MARKET: PORTER’S FIVE FORCES ANALYSIS
- TABLE 6 INFLUENCE OF STAKEHOLDERS ON BUYING PROCESS FOR TOP THREE APPLICATIONS (%)
- TABLE 7 KEY BUYING CRITERIA FOR TOP THREE APPLICATIONS
- TABLE 8 TOP 20 PATENT OWNERS IN US IN LAST 10 YEARS
- TABLE 9 MARKET: LIST OF PATENTS, 2021–2023
- TABLE 10 MARKET: LIST OF CONFERENCES AND EVENTS
- TABLE 11 NORTH AMERICA: LIST OF REGULATORY BODIES, GOVERNMENT AGENCIES, AND OTHER ORGANIZATIONS
- TABLE 12 EUROPE: LIST OF REGULATORY BODIES, GOVERNMENT AGENCIES, AND OTHER ORGANIZATIONS
- TABLE 13 ASIA PACIFIC: LIST OF REGULATORY BODIES, GOVERNMENT AGENCIES, AND OTHER ORGANIZATIONS
- TABLE 14 ROW: LIST OF REGULATORY BODIES, GOVERNMENT AGENCIES, AND OTHER ORGANIZATIONS
- TABLE 15 LITHIUM TITANATE OXIDE (LTO) BATTERY MARKET: STANDARDS
- TABLE 16 MARKET, BY CAPACITY, 2019–2022 (USD MILLION)
- TABLE 17 MARKET, BY CAPACITY, 2023–2028 (USD MILLION)
- TABLE 18 BELOW 3,000 MAH: MARKET, BY APPLICATION, 2019–2022 (USD MILLION)
- TABLE 19 BELOW 3,000 MAH: MARKET, BY APPLICATION, 2023–2028 (USD MILLION)
- TABLE 20 BELOW 3,000 MAH: MARKET, BY REGION, 2019–2022 (USD MILLION)
- TABLE 21 BELOW 3,000 MAH: MARKET, BY REGION, 2023–2028 (USD MILLION)
- TABLE 22 3,001–10,000 MAH: MARKET, BY APPLICATION, 2019–2022 (USD MILLION)
- TABLE 23 3,001–10,000 MAH: MARKET, BY APPLICATION, 2023–2028 (USD MILLION)
- TABLE 24 3,001–10,000 MAH: MARKET, BY REGION, 2019–2022 (USD MILLION)
- TABLE 25 3,001–10,000 MAH: MARKET, BY REGION, 2023–2028 (USD MILLION)
- TABLE 26 ABOVE 10,000 MAH: MARKET, BY APPLICATION, 2019–2022 (USD MILLION)
- TABLE 27 ABOVE 10,000 MAH: MARKET, BY APPLICATION, 2023–2028 (USD MILLION)
- TABLE 28 ABOVE 10,000 MAH: MARKET, BY REGION, 2019–2022 (USD MILLION)
- TABLE 29 ABOVE 10,000 MAH: MARKET, BY REGION, 2023–2028 (USD MILLION)
- TABLE 30 LITHIUM TITANATE OXIDE (LTO) BATTERY MARKET, BY VOLTAGE, 2019–2022 (USD MILLION)
- TABLE 31 MARKET, BY VOLTAGE, 2023–2028 (USD MILLION)
- TABLE 32 LOW: MARKET, BY REGION, 2019–2022 (USD MILLION)
- TABLE 33 LOW: MARKET, BY REGION, 2023–2028 (USD MILLION)
- TABLE 34 MEDIUM: MARKET, BY REGION, 2019–2022 (USD MILLION)
- TABLE 35 MEDIUM: MARKET, BY REGION, 2023–2028 (USD MILLION)
- TABLE 36 HIGH: MARKET, BY REGION, 2019–2022 (USD MILLION)
- TABLE 37 HIGH: MARKET, BY REGION, 2023–2028 (USD MILLION)
- TABLE 38 MARKET, BY APPLICATION, 2019–2022 (USD MILLION)
- TABLE 39 MARKET, BY APPLICATION, 2023–2028 (USD MILLION)
- TABLE 40 CONSUMER ELECTRONICS: MARKET, BY CAPACITY, 2019–2022 (USD MILLION)
- TABLE 41 CONSUMER ELECTRONICS: MARKET, BY CAPACITY, 2023–2028 (USD MILLION)
- TABLE 42 CONSUMER ELECTRONICS: MARKET, BY REGION, 2019–2022 (USD MILLION)
- TABLE 43 CONSUMER ELECTRONICS: MARKET, BY REGION, 2023–2028 (USD MILLION)
- TABLE 44 AUTOMOTIVE: MARKET, BY CAPACITY, 2019–2022 (USD MILLION)
- TABLE 45 AUTOMOTIVE: MARKET, BY CAPACITY, 2023–2028 (USD MILLION)
- TABLE 46 AUTOMOTIVE: MARKET, BY REGION, 2019–2022 (USD MILLION)
- TABLE 47 AUTOMOTIVE: MARKET, BY REGION, 2023–2028 (USD MILLION)
- TABLE 48 AEROSPACE: LITHIUM TITANATE OXIDE (LTO) BATTERY MARKET, BY CAPACITY, 2019–2022 (USD MILLION)
- TABLE 49 AEROSPACE: MARKET, BY CAPACITY, 2023–2028 (USD MILLION)
- TABLE 50 AEROSPACE: MARKET, BY REGION, 2019–2022 (USD MILLION)
- TABLE 51 AEROSPACE: MARKET, BY REGION, 2023–2028 (USD MILLION)
- TABLE 52 MARINE: MARKET, BY CAPACITY, 2019–2022 (USD MILLION)
- TABLE 53 MARINE: MARKET, BY CAPACITY, 2023–2028 (USD MILLION)
- TABLE 54 MARINE: MARKET, BY REGION, 2019–2022 (USD MILLION)
- TABLE 55 MARINE: MARKET, BY REGION, 2023–2028 (USD MILLION)
- TABLE 56 MEDICAL: MARKET, BY CAPACITY, 2019–2022 (USD MILLION)
- TABLE 57 MEDICAL: MARKET, BY CAPACITY, 2023–2028 (USD MILLION)
- TABLE 58 MEDICAL: MARKET, BY REGION, 2019–2022 (USD MILLION)
- TABLE 59 MEDICAL: MARKET, BY REGION, 2023–2028 (USD MILLION)
- TABLE 60 INDUSTRIAL: MARKET, BY CAPACITY, 2019–2022 (USD MILLION)
- TABLE 61 INDUSTRIAL: MARKET, BY CAPACITY, 2023–2028 (USD MILLION)
- TABLE 62 INDUSTRIAL: MARKET, BY REGION, 2019–2022 (USD MILLION)
- TABLE 63 INDUSTRIAL: MARKET, BY REGION, 2023–2028 (USD MILLION)
- TABLE 64 POWER: MARKET, BY CAPACITY, 2019–2022 (USD MILLION)
- TABLE 65 POWER: MARKET, BY CAPACITY, 2023–2028 (USD MILLION)
- TABLE 66 POWER: MARKET, BY REGION, 2019–2022 (USD MILLION)
- TABLE 67 POWER: MARKET, BY REGION, 2023–2028 (USD MILLION)
- TABLE 68 TELECOMMUNICATION: MARKET, BY CAPACITY, 2019–2022 (USD MILLION)
- TABLE 69 TELECOMMUNICATION: MARKET, BY CAPACITY, 2023–2028 (USD MILLION)
- TABLE 70 TELECOMMUNICATION: MARKET, BY REGION, 2019–2022 (USD MILLION)
- TABLE 71 TELECOMMUNICATION: MARKET, BY REGION, 2023–2028 (USD MILLION)
- TABLE 72 LITHIUM TITANATE OXIDE (LTO) BATTERY MARKET, BY REGION, 2019–2022 (USD MILLION)
- TABLE 73 MARKET, BY REGION, 2023–2028 (USD MILLION)
- TABLE 74 NORTH AMERICA: MARKET, BY COUNTRY, 2019–2022 (USD MILLION)
- TABLE 75 NORTH AMERICA: MARKET, BY COUNTRY, 2023–2028 (USD MILLION)
- TABLE 76 NORTH AMERICA: MARKET, BY CAPACITY, 2019–2022 (USD MILLION)
- TABLE 77 NORTH AMERICA: MARKET, BY CAPACITY, 2023–2028 (USD MILLION)
- TABLE 78 NORTH AMERICA: MARKET, BY VOLTAGE, 2019–2022 (USD MILLION)
- TABLE 79 NORTH AMERICA: MARKET, BY VOLTAGE, 2023–2028 (USD MILLION)
- TABLE 80 NORTH AMERICA: MARKET, BY APPLICATION, 2019–2022 (USD MILLION)
- TABLE 81 NORTH AMERICA: MARKET, BY APPLICATION, 2023–2028 (USD MILLION)
- TABLE 82 EUROPE: MARKET, BY COUNTRY, 2019–2022 (USD MILLION)
- TABLE 83 EUROPE: MARKET, BY COUNTRY, 2023–2028 (USD MILLION)
- TABLE 84 EUROPE: MARKET, BY CAPACITY, 2019–2022 (USD MILLION)
- TABLE 85 EUROPE: MARKET, BY CAPACITY, 2023–2028 (USD MILLION)
- TABLE 86 EUROPE: MARKET, BY VOLTAGE, 2019–2022 (USD MILLION)
- TABLE 87 EUROPE: MARKET, BY VOLTAGE, 2023–2028 (USD MILLION)
- TABLE 88 EUROPE: MARKET, BY APPLICATION, 2019–2022 (USD MILLION)
- TABLE 89 EUROPE: MARKET, BY APPLICATION, 2023–2028 (USD MILLION)
- TABLE 90 ASIA PACIFIC: LITHIUM TITANATE OXIDE (LTO) BATTERY MARKET, BY COUNTRY, 2019–2022 (USD MILLION)
- TABLE 91 ASIA PACIFIC: MARKET, BY COUNTRY, 2023–2028 (USD MILLION)
- TABLE 92 ASIA PACIFIC: MARKET, BY CAPACITY, 2019–2022 (USD MILLION)
- TABLE 93 ASIA PACIFIC: MARKET, BY CAPACITY, 2023–2028 (USD MILLION)
- TABLE 94 ASIA PACIFIC: MARKET, BY VOLTAGE, 2019–2022 (USD MILLION)
- TABLE 95 ASIA PACIFIC: MARKET, BY VOLTAGE, 2023–2028 (USD MILLION)
- TABLE 96 ASIA PACIFIC: MARKET, BY APPLICATION, 2019–2022 (USD MILLION)
- TABLE 97 ASIA PACIFIC: MARKET, BY APPLICATION, 2023–2028 (USD MILLION)
- TABLE 98 ROW: MARKET, BY REGION, 2019–2022 (USD MILLION)
- TABLE 99 ROW: MARKET, BY REGION, 2023–2028 (USD MILLION)
- TABLE 100 ROW: MARKET, BY CAPACITY, 2019–2022 (USD MILLION)
- TABLE 101 ROW: MARKET, BY CAPACITY, 2023–2028 (USD MILLION)
- TABLE 102 ROW: MARKET, BY VOLTAGE, 2019–2022 (USD MILLION)
- TABLE 103 ROW: MARKET, BY VOLTAGE, 2023–2028 (USD MILLION)
- TABLE 104 ROW: MARKET, BY APPLICATION, 2019–2022 (USD MILLION)
- TABLE 105 ROW: MARKET, BY APPLICATION, 2023–2028 (USD MILLION)
- TABLE 106 MARKET: OVERVIEW OF STRATEGIES ADOPTED BY KEY PLAYERS
- TABLE 107 MARKET SHARE ANALYSIS, 2022
- TABLE 108 COMPANY FOOTPRINT
- TABLE 109 APPLICATION: COMPANY FOOTPRINT
- TABLE 110 REGION: COMPANY FOOTPRINT
- TABLE 111 MARKET: LIST OF KEY STARTUPS/SMES
- TABLE 112 MARKET: COMPETITIVE BENCHMARKING OF KEY STARTUPS/SMES
- TABLE 113 MARKET: PRODUCT LAUNCHES, 2020–2023
- TABLE 114 MARKET: DEALS, 2020–2023
- TABLE 115 TOSHIBA CORPORATION: COMPANY OVERVIEW
- TABLE 116 TOSHIBA CORPORATION: PRODUCTS OFFERED
- TABLE 117 TOSHIBA CORPORATION: PRODUCT LAUNCHES
- TABLE 118 MICROVAST HOLDINGS, INC.: COMPANY OVERVIEW
- TABLE 119 MICROVAST HOLDINGS, INC.: PRODUCTS OFFERED
- TABLE 120 MICROVAST HOLDINGS, INC.: DEALS
- TABLE 121 NICHICON CORPORATION: COMPANY OVERVIEW
- TABLE 122 NICHICON CORPORATION: PRODUCTS OFFERED
- TABLE 123 NICHICON CORPORATION: PRODUCT LAUNCHES
- TABLE 124 LECLANCHÉ SA: COMPANY OVERVIEW
- TABLE 125 LECLANCHÉ SA: PRODUCTS OFFERED
- TABLE 126 LECLANCHÉ SA: PRODUCT LAUNCHES
- TABLE 127 CLARIOS: COMPANY OVERVIEW
- TABLE 128 CLARIOS: PRODUCTS OFFERED
- TABLE 129 CLARIOS: DEALS
- TABLE 130 GREE ALTAIRNANO NEW ENERGY INC.: COMPANY OVERVIEW
- TABLE 131 GREE ALTAIRNANO NEW ENERGY INC.: PRODUCTS OFFERED
- TABLE 132 GREE ALTAIRNANO NEW ENERGY INC.: DEALS
- TABLE 133 HUNAN HUAHUI NEW ENERGY CO., LTD.: COMPANY OVERVIEW
- TABLE 134 HUNAN HUAHUI NEW ENERGY CO., LTD.: PRODUCTS OFFERED
- TABLE 135 PADRE ELECTRONICS CO., LIMITED: COMPANY OVERVIEW
- TABLE 136 PADRE ELECTRONICS CO., LIMITED: PRODUCTS OFFERED
- TABLE 137 MICRO BATTERY MARKET, BY REGION, 2019–2022 (USD MILLION)
- TABLE 138 MICRO BATTERY MARKET, BY REGION, 2023–2028 (USD MILLION)
- TABLE 139 NORTH AMERICA: MICRO BATTERY MARKET, BY COUNTRY, 2019–2022 (USD MILLION)
- TABLE 140 NORTH AMERICA: MICRO BATTERY MARKET, BY COUNTRY, 2023–2028 (USD MILLION)
- FIGURE 1 LITHIUM TITANATE OXIDE (LTO) BATTERY MARKET: SEGMENTATION
- FIGURE 2 MARKET: RESEARCH DESIGN
- FIGURE 3 MARKET: RESEARCH APPROACH
- FIGURE 4 MARKET: BOTTOM-UP APPROACH
- FIGURE 5 MARKET: TOP-DOWN APPROACH
- FIGURE 6 MARKET SIZE ESTIMATION METHODOLOGY: SUPPLY-SIDE ANALYSIS
- FIGURE 7 DATA TRIANGULATION
- FIGURE 8 MARKET, 2019–2028 (USD MILLION)
- FIGURE 9 ABOVE 10,000 MAH SEGMENT TO HOLD LARGEST MARKET SHARE IN 2028
- FIGURE 10 HIGH VOLTAGE SEGMENT TO HOLD LARGEST MARKET SHARE IN 2028
- FIGURE 11 INDUSTRIAL SEGMENT TO REGISTER HIGHEST CAGR DURING FORECAST PERIOD
- FIGURE 12 ASIA PACIFIC TO RECORD HIGHEST CAGR FROM 2023 TO 2028
- FIGURE 13 GROWING ADOPTION OF LTO BATTERIES IN AUTOMOTIVE AND POWER APPLICATIONS
- FIGURE 14 ABOVE 10,000 MAH SEGMENT TO HOLD LARGEST MARKET SHARE IN 2028
- FIGURE 15 POWER SEGMENT TO DOMINATE MARKET DURING FORECAST PERIOD
- FIGURE 16 ABOVE 10,000 MAH SEGMENT AND US TO HOLD LARGEST SHARES OF NORTH AMERICAN MARKET IN 2028
- FIGURE 17 CHINA TO REGISTER HIGHEST CAGR IN MARKET FROM 2023 TO 2028
- FIGURE 18 LITHIUM TITANATE OXIDE (LTO) BATTERY MARKET: DRIVERS, RESTRAINTS, OPPORTUNITIES, AND CHALLENGES
- FIGURE 19 GLOBAL PHEV SALES, 2018–2022 (THOUSAND UNITS)
- FIGURE 20 MARKET: IMPACT ANALYSIS OF DRIVERS
- FIGURE 21 MARKET: IMPACT ANALYSIS OF RESTRAINTS
- FIGURE 22 MARKET: IMPACT ANALYSIS OF OPPORTUNITIES
- FIGURE 23 MARKET: IMPACT ANALYSIS OF CHALLENGES
- FIGURE 24 MARKET: VALUE CHAIN ANALYSIS
- FIGURE 25 MARKET: ECOSYSTEM ANALYSIS
- FIGURE 26 AVERAGE SELLING PRICE (ASP) TREND OF LITHIUM-ION BATTERY PACKS AND CELLS, 2013–2022
- FIGURE 27 AVERAGE SELLING PRICE (ASP) OF LTO BATTERIES OFFERED BY THREE KEY PLAYERS
- FIGURE 28 REVENUE SHIFT AND NEW REVENUE POCKETS FOR PLAYERS IN MARKET
- FIGURE 29 LITHIUM TITANATE OXIDE (LTO) BATTERY MARKET: PORTER’S FIVE FORCES ANALYSIS
- FIGURE 30 INFLUENCE OF STAKEHOLDERS ON BUYING PROCESS FOR TOP THREE APPLICATIONS
- FIGURE 31 KEY BUYING CRITERIA FOR TOP THREE APPLICATIONS
- FIGURE 32 IMPORT DATA FOR LITHIUM CELLS AND BATTERIES, BY COUNTRY, 2018–2022 (USD MILLION)
- FIGURE 33 EXPORT DATA FOR LITHIUM CELLS AND BATTERIES, BY COUNTRY, 2018–2022 (USD MILLION)
- FIGURE 34 TOP 10 COMPANIES WITH HIGHEST NUMBER OF PATENT APPLICATIONS IN LAST 10 YEARS
- FIGURE 35 NUMBER OF PATENTS GRANTED PER YEAR, 2013–2022
- FIGURE 36 MARKET, BY CAPACITY
- FIGURE 37 ABOVE 10,000 MAH SEGMENT TO REGISTER HIGHEST CAGR DURING FORECAST PERIOD
- FIGURE 38 MARKET, BY VOLTAGE
- FIGURE 39 HIGH VOLTAGE SEGMENT TO HOLD LARGEST MARKET SHARE IN 2028
- FIGURE 40 MARKET, BY APPLICATION
- FIGURE 41 POWER SEGMENT TO HOLD LARGEST MARKET SHARE IN 2028
- FIGURE 42 LITHIUM TITANATE OXIDE (LTO) BATTERY MARKET, BY REGION
- FIGURE 43 CHINA TO BE FASTEST-GROWING MARKET DURING FORECAST PERIOD
- FIGURE 44 NORTH AMERICA: MARKET SNAPSHOT
- FIGURE 45 US TO ACCOUNT FOR LARGEST SHARE OF NORTH AMERICAN MARKET IN 2028
- FIGURE 46 EUROPE: MARKET SNAPSHOT
- FIGURE 47 GERMANY TO REGISTER HIGHEST CAGR IN EUROPEAN MARKET DURING FORECAST PERIOD
- FIGURE 48 ASIA PACIFIC: MARKET SNAPSHOT
- FIGURE 49 CHINA TO ACCOUNT FOR LARGEST SHARE OF ASIA PACIFIC MARKET IN 2028
- FIGURE 50 MIDDLE EAST & AFRICA TO REGISTER HIGHER CAGR IN ROW MARKET DURING FORECAST PERIOD
- FIGURE 51 MARKET: REVENUE ANALYSIS OF FOUR KEY PLAYERS, 2018–2022
- FIGURE 52 MARKET SHARE ANALYSIS OF KEY PLAYERS, 2022
- FIGURE 53 MARKET: EVALUATION MATRIX OF KEY COMPANIES, 2022
- FIGURE 54 MARKET: EVALUATION MATRIX OF STARTUPS/SMES, 2022
- FIGURE 55 TOSHIBA CORPORATION: COMPANY SNAPSHOT
- FIGURE 56 MICROVAST HOLDINGS, INC.: COMPANY SNAPSHOT
- FIGURE 57 NICHICON CORPORATION: COMPANY SNAPSHOT
- FIGURE 58 LECLANCHÉ SA: COMPANY SNAPSHOT
- FIGURE 59 CLARIOS: COMPANY SNAPSHOT
The study involved four major activities in estimating the current size of the lithium titanate oxide (LTO) battery market. Exhaustive secondary research has been done to collect information on the market, peer, and parent markets. The next step has been to validate these findings, assumptions, and sizing with industry experts across the value chain through primary research. Both top-down and bottom-up approaches have been employed to estimate the total market size. After that, market breakdown and data triangulation methods were used to estimate the market size of segments and subsegments. Two sources of information—secondary and primary—have been used to identify and collect information for an extensive technical and commercial study of the LTO battery market.
Secondary Research
Secondary sources include company websites, magazines, industry news, associations, and databases (Factiva and Bloomberg). These secondary sources include annual reports, press releases, investor presentations of companies, white papers, certified publications, articles by recognized authors, regulatory bodies, trade directories, and databases.
Primary Research
Primary sources mainly consist of several experts from the core and related industries, along with preferred LTO battery providers, distributors, alliances, standards, and certification organizations related to various segments of this industry’s value chain.
In the primary research process, various primary sources from both supply and demand sides were interviewed to obtain qualitative and quantitative information on the market. The primary sources from the supply side included various industry experts such as Chief Experience Officers (CXOs), Vice Presidents (VPs), and Directors from business development, marketing, product development/innovation teams, and related key executives from LTO battery providers, such as Toshiba Corporation (Japan), Microvast Holdings, Inc. (US), Leclanché SA (Switzerland), and Nichicon Corporation (Japan); research organizations, distributors, industry associations, and key opinion leaders. Following is the breakdown of primary respondents.
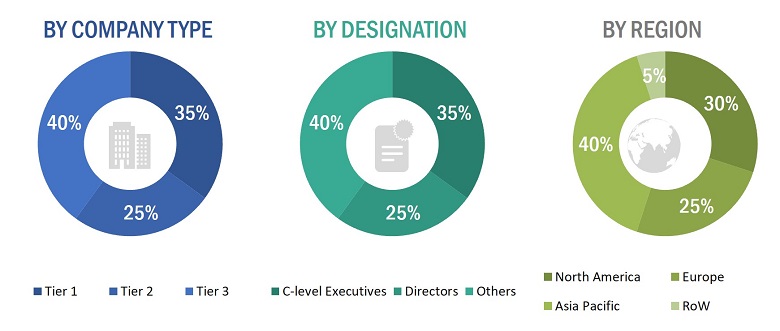
To know about the assumptions considered for the study, download the pdf brochure
Market Size Estimation
Both top-down and bottom-up approaches have been used to estimate and validate the total size of the LTO battery market. These methods have also been used extensively to estimate the size of various subsegments in the market. The following research methodology has been used to estimate the market size:
- Major players in the industry and markets have been identified through extensive secondary research.
- The industry’s value chain and market size (in terms of value) have been determined through primary and secondary research processes.
- All percentage shares, splits, and breakdowns have been determined using secondary sources and verified through primary sources.
Data Triangulation
After arriving at the overall market size from the estimation process explained above, the overall market has been split into several segments and subsegments. The market breakdown and data triangulation procedures have been employed, wherever applicable, to complete the overall market engineering process and arrive at the exact statistics for all segments and subsegments. The data has been triangulated by studying various factors and trends from both the demand and supply sides. The market has also been validated using both top-down and bottom-up approaches.
Top-down Approach
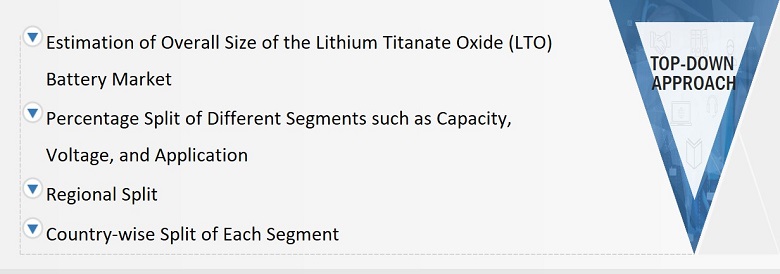
In the top-down approach, the overall market size has been used to estimate the size of the individual market segments (mentioned in market segmentation) through percentage splits from secondary and primary research. For specific market segments, the size of the most appropriate immediate parent market has been used to implement the top-down approach. The bottom-up approach has also been implemented for data obtained from secondary research to validate the market size of various segments.
LTO Battery Market: Top-down Approach
Bottom-Up Approach
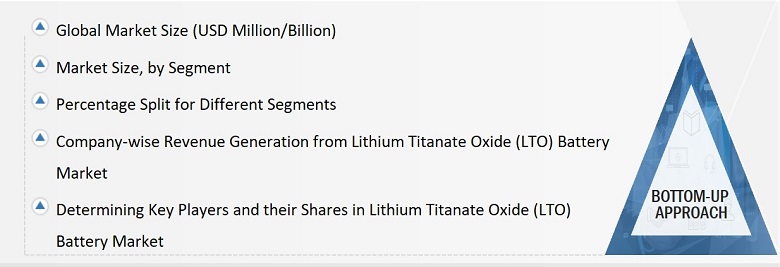
The bottom-up approach has been used to arrive at the overall size of the LTO battery market from the revenues of the key players and their market shares. Calculations based on revenues of key companies identified in the market led to the estimation of their overall market size.
LTO Battery Market: Bottom-up Approach
Market Definition
Lithium titanate oxide (LTO) battery is a type of lithium-ion battery known for its unique characteristics and diverse applications. A LTO battery uses a titanate-based anode, allowing for a faster flow of lithium ions. This battery has gained prominence in various industries as an advanced energy storage solution due to its exceptional safety features, fast charging capabilities, and long life. Its composition, which includes a titanate-based anode, sets it apart from conventional lithium-ion batteries and provides distinct advantages in specific use cases. LTO batteries have found applications in automotive, grid-scale energy storage, and consumer electronics. As battery technology continues to evolve, LTO batteries remain a promising option for addressing the demands of modern energy storage and power management needs.
Key Stakeholders
- Government bodies, such as regulatory authorities and policymakers
- Organizations, forums, alliances, and associations
- Market research and consulting firms
- Raw material suppliers and distributors
- Research institutes and organizations
- Battery cell and battery pack manufacturers
- Testing, inspection, and certification providers
- Distributors and resellers
- End-users
Report Objectives
- To define and forecast the LTO battery market regarding voltage, capacity, and application.
- To describe and forecast the LTO battery market and its value segments for four regions—North America, Europe, Asia Pacific, and the Rest of the World (RoW), along with their respective countries.
- To provide detailed information regarding the drivers, restraints, opportunities, and challenges influencing the growth of the market
- To strategically analyze micro-markets concerning individual growth trends, prospects, and contributions to the overall market
- To study the complete value chain of the LTO battery market
- To analyze opportunities in the market for stakeholders by identifying high-growth segments of the market
- To strategically profile key players and comprehensively analyze their market position regarding ranking and core competencies, along with a detailed market competitive landscape.
- To analyze strategic approaches such as agreements, collaborations, and partnerships in the LTO battery market
- To provide an analysis of the recession impact on the growth of the market and its segments
Available Customizations:
Based on the given market data, MarketsandMarkets offers customizations in the reports according to the client’s specific requirements. The available customization options are as follows:
Company Information
- Detailed analysis and profiling of additional market players (up to 5)


Growth opportunities and latent adjacency in Lithium Titanate Oxide (LTO) Battery Market