
Battery Technology Market Size, Share & Trends

Battery Technology Market Size, Share & Trends by Type (Lithium-ion Battery, Lead Acid, NiMh, NiCd, Sodium-ion, Solid-state Battery, Redox Flow Battery, Lithium Silicon, Lithium Sulfur Battery), Li-ion Battery Type (LFP, NMC, LCO, LTO, LMO, NCA) - Global Forecast to 2030


BATTERY TECHNOLOGY MARKET SIZE, SHARE & TRENDS
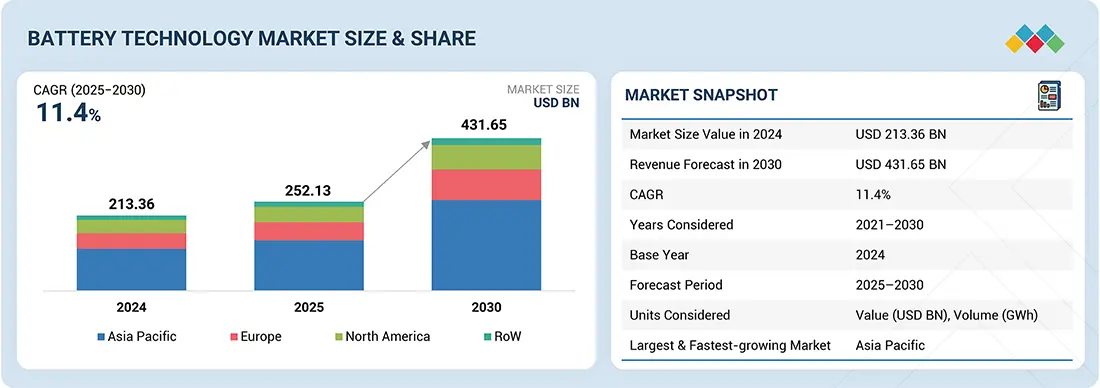
According to Marketsandmarkets, the global Battery Technology Market Size is expected to grow from USD 252.13 billion in 2025 to USD 431.65 billion by 2030, growing at a CAGR of 11.4% from 2025 to 2030. The growth is fueled by EV adoption, renewable energy integration, and demand for efficient storage. Lithium-ion, solid-state, flow, and sodium-ion battery advancements enhance energy density, charging speed, and lifecycle performance. Materials, recycling, and digital management innovations improve efficiency while addressing supply chain issues. Due to the implementation of decarbonization goals, battery technologies have emerged as a key to clean mobility, resilient energy systems, and next-generation electronics.
MARKET SNAPSHOT TABLE
| REPORT METRIC | DETAILS |
|---|---|
| Market Size in 2025 (Value) | USD 252.13 Billion |
| Market Forecast in 2030 (Value) | USD 431.65 Billion |
| Growth Rate | CAGR of 11.4% from 2025–2030 |
| Years Considered | 2021–2030 |
| Base Year | 2024 |
| Forecast Period | 2025–2030 |
| Units Considered | Value (USD Billion), Volume (GWh) |
| Report Coverage | Revenue Forecast, Company Ranking, Competitive Landscape, Growth Factors, and Trends |
| Top Companies |
|
| Growth Driver |
|
| Segments Covered | By Type: Lithium-ion, Lead Acid, Nickel-based, Solid-state, Sodium-ion, and Flow |
| Regional Scope | North America, Asia Pacific, Europe, and RoW |
BATTERY TECHNOLOGY MARKET SIZE & FORECAST
BATTERY TECHNOLOGY MARKET KEY TAKEAWAYS
- Asia Pacific is expected to register the highest CAGR of 12.4%.
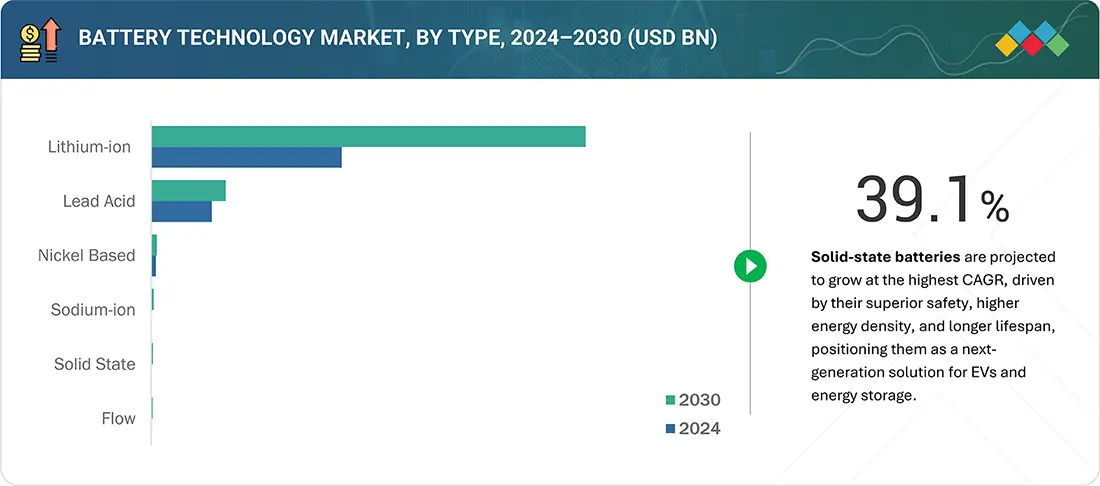
- By type, the solid-state segment is expected to register the highest CAGR of 39.1% in the battery technology market share
- Contemporary Amperex Technology Co., Limited (CATL), LG Energy Solution and BYD Company Ltd., were identified as Star players in the Battery Technology Market, as they have focused on innovation and have broad industry coverage, and strong operational & financial strength
- LithiumWerks, Amperex Technology, and BAK Power, among others, have distinguished themselves among startups and emerging battery innovators by securing strong footholds in specialized niche areas, underscoring their potential as progressive leaders in the battery technology market.
The battery technology market trends is projected to grow steadily over the next decade, driven by the rising demand for efficient energy storage, electrification of transportation, and integration with renewable energy systems. Adoption in electric vehicles, grid infrastructure, and consumer electronics is accelerating, positioning advanced batteries as a cornerstone technology for enabling clean mobility, enhancing energy resilience, and supporting sustainability goals across industries.
Source: Secondary Research, Interviews with Experts, MarketsandMarkets Analysis
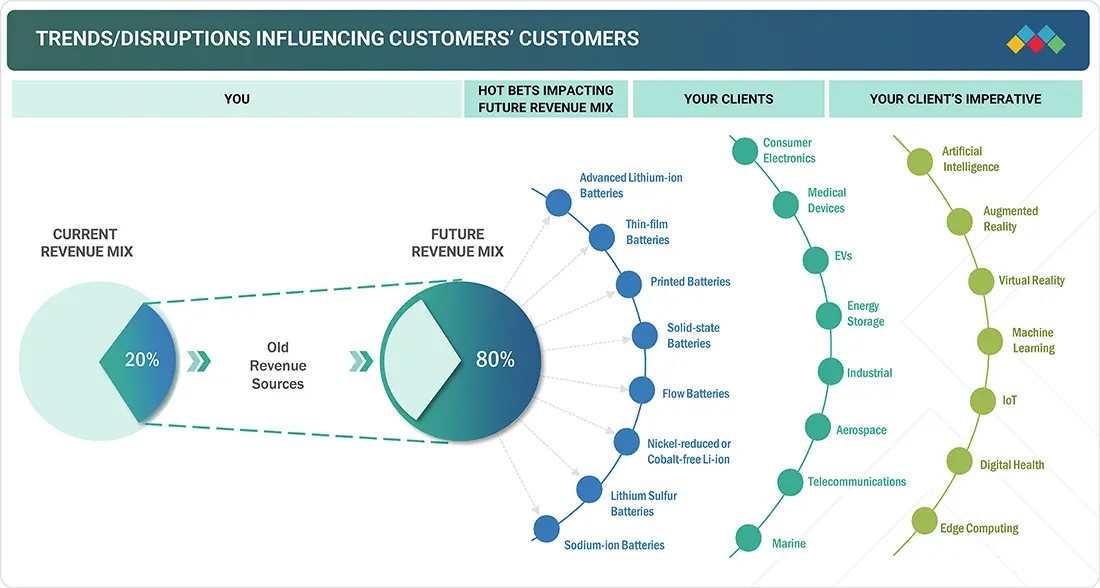
TRENDS & DISRUPTIONS IMPACTING CUSTOMERS' CUSTOMERS
The impact on consumers' businesses in the battery technology industry stems from evolving energy needs and accelerating industry transitions. Automotive, renewable energy, consumer electronics, and industrial sectors are the primary users of advanced batteries, with efficiency, energy density, and lifecycle performance as key priorities. The global shift toward electrification, renewable integration, and sustainable energy solutions directly enhances operational performance and cost efficiency for end users. These factors drive the demand for next-generation batteries, shaping the market's long-term growth trajectory.
Source: Secondary Research, Interviews with Experts, MarketsandMarkets Analysis
BATTERY TECHNOLOGY MARKET DYNAMICS
Level
-
Strong demand for batteries amid increasing EV sales

-
Increasing adoption of LFP chemistry in electric vehicles

Level
-
High production costs of solid-state batteries

-
Standardization and commercialization hurdles of flow batteries

Level
-
Advancements in sodium-ion technologies

-
Solid-state powering innovation in medical devices

Level
-
Trade tariffs on Chinese EVs in Europe and North America

-
Financial risks and market volatility

Source: Secondary Research, Interviews with Experts, MarketsandMarkets Analysis
Driver: Strong demand for batteries amid increasing EV sales
The rapid adoption of electric vehicles worldwide creates unprecedented demand for advanced batteries. Automakers are investing heavily in electrification, supported by government incentives, stricter emission regulations, and consumer preference for clean mobility. This surge drives large-scale deployment of lithium-ion batteries and spurs innovation in energy density, fast charging, and lifecycle performance, making batteries the backbone of EV growth.
Restraint: High production costs of solid-state batteries
Although solid-state batteries promise superior safety, higher energy density, and longer lifespans, their commercialization is restrained by expensive raw materials, complex manufacturing processes, and limited scalability. These high costs hinder mass adoption, particularly in price-sensitive EV and storage markets, slowing the transition from conventional lithium-ion chemistries.
Opportunity: Advancements in sodium-ion technologies
Sodium-ion batteries are emerging as a cost-effective and sustainable alternative to lithium-ion, using abundant raw materials and offering stable performance across temperatures. These advantages make them suitable for grid-scale storage and entry-level EVs. As R&D accelerates and commercialization expands, sodium-ion creates opportunities for broader accessibility and supply chain resilience.
Challenge: Financial risks and market volatility
The battery industry faces challenges from volatile raw material prices, geopolitical tensions, and inflation, which increase production costs and squeeze profit margins. Market uncertainty discourages investment in new projects, delaying capacity expansions and technology upgrades. These risks affect long-term growth and competitiveness across automotive, storage, and electronics applications.
Battery Technology Market SIZE, SHARE & GROWTH, 2030: COMMERCIAL USE CASES ACROSS INDUSTRIES
| COMPANY | USE CASE DESCRIPTION | BENEFITS |
|---|---|---|
 |
Next-generation lithium-ion and sodium-ion batteries for EVs and energy storage systems | Higher energy density, faster charging, wider temperature adaptability, and cost efficiency |
 |
Lithium-ion batteries for electric vehicles, energy storage, and consumer electronics | Extended driving range, stable performance, and improved energy efficiency |
 |
Blade battery technology for electric vehicles and buses | Enhanced safety with reduced fire risk, long lifecycle, and optimized space utilization |
 |
Lithium-ion and NiMH batteries for EVs and hybrid vehicles | High energy density, reliable lifecycle, and versatile solutions for full EVs and hybrids |
 |
Lithium-ion batteries for EVs and electronics; developing solid-state batteries with anode-less designs and solid electrolytes | High energy density, improved safety, extended lifespan, and compact form factor for mobility and storage |
Logos and trademarks shown above are the property of their respective owners. Their use here is for informational and illustrative purposes only.
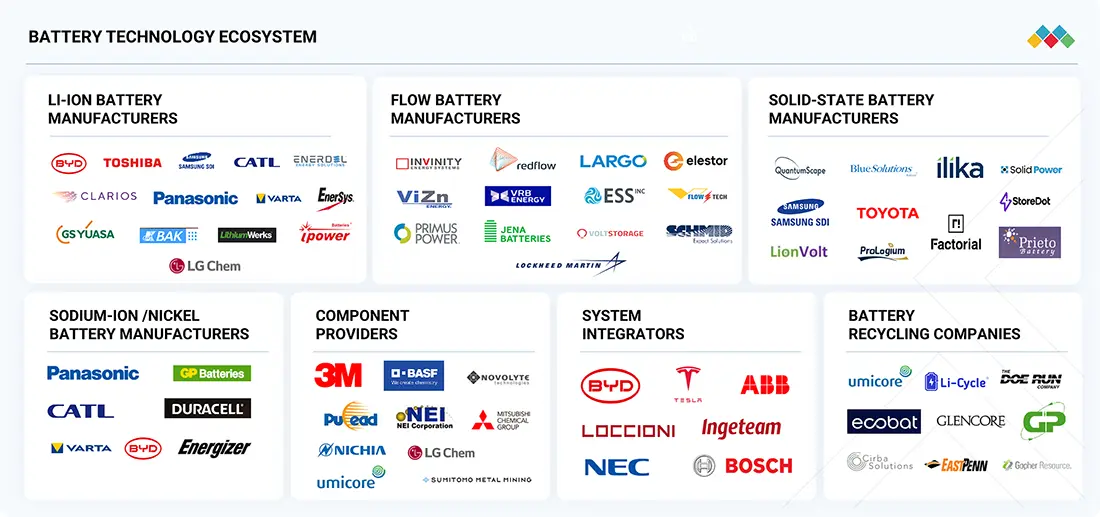
BATTERY TECHNOLOGY MARKET ECOSYSTEM
Key players operating in the battery technology companies are Contemporary Amperex Technology Co., Limited. (China), LG Energy Solution (South Korea), Panasonic Holdings Corporation (Japan), BYD Company Ltd. (China), and SAMSUNG SDI (South Korea). These companies boast a comprehensive product portfolio and have a strong geographic footprint. Players in this market have adopted various growth strategies, including partnerships and expansions, to establish their foothold. The battery technology ecosystem comprises multiple participants, each playing a vital role in developing, manufacturing, and deploying advanced battery solutions worldwide.
Logos and trademarks shown above are the property of their respective owners. Their use here is for informational and illustrative purposes only.
BATTERY TECHNOLOGY MARKET SEGMENTS
Source: Secondary Research, Interviews with Experts, MarketsandMarkets Analysis
Battery Technology Market, By Type
The lithium-ion battery segment held the largest market share in 2024, driven by its high energy density, long cycle life, and suitability across diverse applications. Widely adopted in electric vehicles, consumer electronics, and grid storage systems, lithium-ion batteries form the backbone of modern energy storage. Their ability to deliver reliable performance, faster charging, and scalability at competitive costs reinforces their dominance in the market, positioning them as the preferred choice for industries advancing toward electrification and sustainable energy solutions.
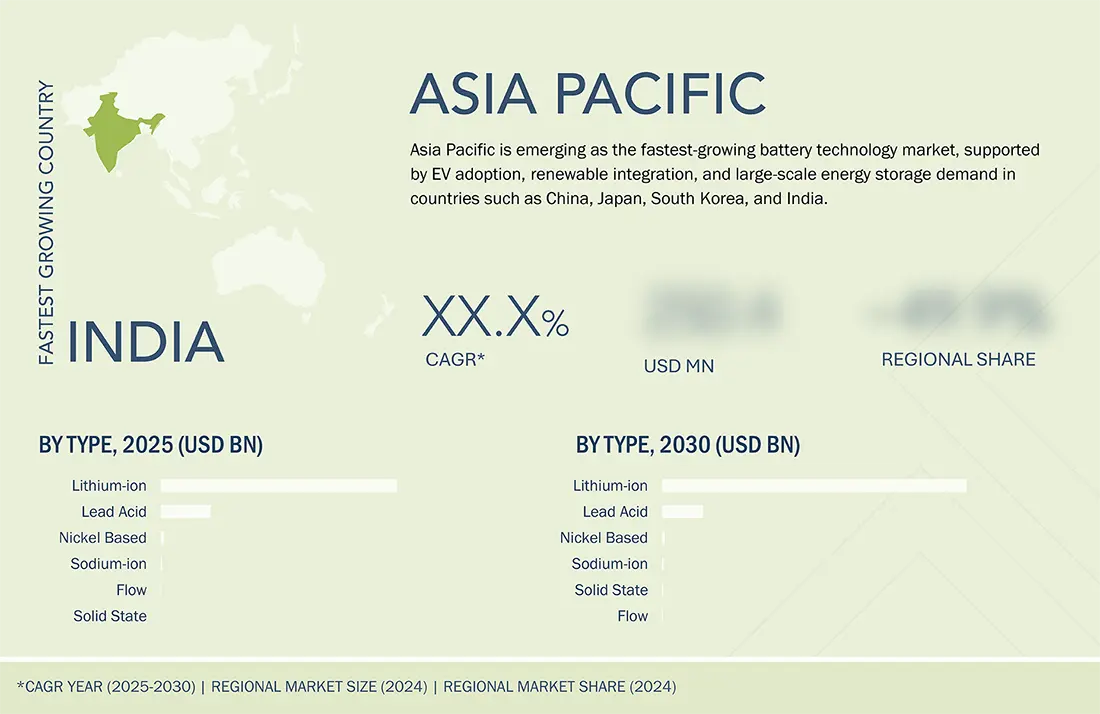
BATTERY TECHNOLOGY MARKET REGION
Asia Pacific to be the fastest-growing region in the global battery technology market during the forecast period
Asia Pacific is expected to dominate the global battery technology market growth, driven by the rising adoption of electric vehicles, rapid renewable energy integration, and strong demand for energy storage solutions. Government initiatives promoting clean energy, electrification, and industrial digitalization accelerate deployment. Key economies, such as China, Japan, South Korea, and India, are at the forefront, leveraging advancements in lithium-ion, solid-state, sodium-ion, and flow batteries to enhance sustainability, performance, and supply chain resilience across multiple sectors.
Battery Technology Market SIZE, SHARE & GROWTH, 2030: COMPANY EVALUATION MATRIX
In the battery technology market matrix, Contemporary Amperex Technology Co., Limited (CATL) (Star) leads with a strong global presence and a comprehensive portfolio spanning lithium-ion and emerging sodium-ion batteries, enabling large-scale adoption across electric vehicles and energy storage systems. SK Innovation Co., Ltd. (Emerging Leader) is gaining momentum with innovative lithium-ion solutions and expanding investments in next-generation solid-state technologies. While CATL dominates through scale, diversified offerings, and established global partnerships, SK Innovation demonstrates strong growth potential to progress toward the leaders' quadrant.

Source: Secondary Research, Interviews with Experts, MarketsandMarkets Analysis
BATTERY TECHNOLOGY MARKET KEY PLAYERS
WHAT IS IN IT FOR YOU: Battery Technology Market SIZE, SHARE & GROWTH, 2030 REPORT CONTENT GUIDE
DELIVERED CUSTOMIZATIONS
We have successfully delivered the following deep-dive customizations:
| CLIENT REQUEST | CUSTOMIZATION DELIVERED | VALUE ADDS |
|---|---|---|
| Global EV Battery Manufacturer | Competitive benchmarking of leading players' chemistries (Li-ion, LFP, solid-state, and sodium-ion), cost curve analysis across regions, and EV OEM adoption roadmaps | • Identify interconnections and supply chain blind spots • Detect customer migration trends across industries • Highlight untapped customer clusters for market entry |
| Energy Storage Provider | Market forecast for grid-scale storage batteries, comparative assessment of long-duration technologies, and regulatory and incentive mapping by region | • Highlight viable technologies for large-scale renewable integration • Identify policy-driven demand hotspots • Support investment planning in utility-scale storage |
| Automotive OEM | Evaluation of battery adoption roadmaps, patent landscape & R&D strength mapping in advanced chemistries, and analysis of safety, charging speed, and lifecycle innovations | • Support backward integration in battery sourcing • Identify disruptive innovations in EV batteries • Secure early-mover advantage in next-gen chemistries |
RECENT DEVELOPMENTS
- March 2025 : Factorial (US) launched Gammatron, an AI-powered digital twin platform that dramatically accelerates battery development, forecasting long-term performance from just two weeks of lab data and optimizing fast-charging, cycle life, and electrolyte formulation to speed innovation from lab to road.
- May 2025 : ProLogium Technology (Taiwan) partnered with Japan's Kyushu Electric Power to co-develop a 24 V lithium ceramic battery module for construction machinery, with a collaboration technology unveiling planned at CES 2026. This collaboration advances ProLogium's global clean energy strategy and aims to expand sustainable solutions across industrial sectors.
- May 2025 : Contemporary Amperex Technology Co., Limited (China) launched the TENER Stack, the world's first 9 MWh ultra-large capacity energy storage system, at Entry/Exit System (EES) Europe 2025. The product was introduced to meet the rising global demand for high-density, flexible, and transportable energy storage solutions. Targeted at utilities, developers, and industrial users, the TENER Stack delivers significant advancements in space utilization, energy efficiency, and cost performance. It supports various applications, including AI data centers and industrial electrification.
- April 2025 : LG Energy Solution (South Korea) entered a joint venture with French metal recycling company Derichebourg Multiservices to strengthen its closed-loop battery recycling system and enhance value chain competitiveness in Europe. The partnership will establish a pre-processing facility in Bruyères-sur-Oise, northern France, to extract black mass. Construction is scheduled to begin in 2026, with operations expected to commence in 2027.
- April 2025 : CALB (China) unveiled its latest energy storage technologies at the 2025 ESIE Summit, announcing the global mass production of its 392Ah cell and 6.25 MWh liquid-cooled container system. The company also introduced the 314Gen2.0 ultra-long-cycle cell and the 640Ah high-capacity cell, showcasing its broad portfolio of advanced, reliable, high-performance energy storage solutions.
Table of Contents
 Exclusive indicates content/data unique to MarketsandMarkets and not available with any competitors.
Methodology
The study involved four major activities in estimating the current size of the battery technology market. Exhaustive secondary research has been conducted to gather information on the market, adjacent markets, and the overall battery technology landscape. These findings and assumptions and projections were validated through primary research involving interviews with industry experts and key stakeholders across the value chain. Both top-down and bottom-up approaches were utilized to estimate the overall market size. Subsequently, market breakdown and data triangulation techniques were applied to determine the sizes of various segments and subsegments. Two key sources, secondary and primary, were leveraged to conduct a comprehensive technical and commercial assessment of the battery technology market.
Secondary Research
Various secondary sources have been referred to in the secondary research process to identify and collect important information for this study. The secondary sources include annual reports, press releases, and investor presentations of companies; white papers; journals and certified publications; and articles from recognized authors, websites, directories, and databases. Secondary research has been conducted to obtain key information about the industry’s supply chain, the market’s value chain, the total pool of key players, market segmentation according to the industry trends (to the bottom-most level), regional markets, and key developments from market- and technology-oriented perspectives. The secondary data has been collected and analyzed to determine the overall market size, further validated by primary research.
Primary Research
Extensive primary research was conducted after gaining knowledge about the current scenario of the battery technology market through secondary research. Several primary interviews were conducted with experts from the demand and supply sides across four major regions—North America, Europe, Asia Pacific and RoW. This primary data was collected through questionnaires, emails, and telephonic interviews.

Note: Other designations include sales and product managers. The three tiers of the companies are defined based on their total revenue in 2024: Tier 1 - revenue greater than or equal to USD 5 billion; Tier 2 - revenue between USD 500 million and USD 5 billion; and Tier 3 revenue less than or equal to USD 500 million.
To know about the assumptions considered for the study, download the pdf brochure
Market Size Estimation
Both top-down and bottom-up approaches have been used to estimate and validate the total size of the battery technology market. These methods have also been used extensively to estimate the size of various subsegments in the market. The following research methodology has been used to estimate the market size:
- Major players in the industry and markets have been identified through extensive secondary research.
- The industry’s value chain and market size (in terms of value) have been determined through primary and secondary research processes.
- All percentage shares, splits, and breakdowns have been determined using secondary sources and verified through primary sources.
Battery Technology Market : Top-Down and Bottom-Up Approach

Data Triangulation
After arriving at the overall size of the battery technology market from the market size estimation process explained above, the total market has been split into several segments and subsegments. Data triangulation and market breakdown procedures have been employed, wherever applicable, to complete the overall market engineering process and arrive at the exact statistics for all segments and subsegments of the market. The data has been triangulated by studying various factors and trends from both the demand and supply sides. Along with this, the market size has been validated using both top-down and bottom-up approaches.
Market Definition
The battery technology encompasses advanced energy storage solutions that enable the storage, management, and delivery of electrical energy across diverse applications. These technologies include a range of battery types such as lithium-ion, lead acid, nickel-based, flow, solid-state, and sodium-ion, each designed to meet specific performance, cost, and application requirements. Battery systems provide critical functionalities including high energy density, fast charging, extended cycle life, and reliable power backup, supporting industries such as automotive and transportation, consumer electronics, industrial manufacturing, energy and power, and renewable integration. Battery technologies play a central role in advancing electrification and sustainability goals by enabling clean mobility, grid stability, and portable energy access. The market is increasingly driven by innovation in materials and chemistries, integration of digital battery management systems, and growing global emphasis on energy transition, carbon neutrality, and cost-effective storage solutions.
Key Stakeholders
- Lithium-ion Battery Manufacturers
- Lead Acid Battery Manufacturers
- Solid State Battery Manufacturers
- Nickel Battery Manufacturers
- Flow Battery Manufacturers
- Sodium-ion Battery Manufacturers
- Government Bodies and Policymakers
- Standards Organizations, Forums, Alliances, and Associations
- Market Research and Consulting Firms
- Raw Material Suppliers and Distributors
- Research Institutes and Organizations
- Material and Technology Providers
- Battery Cell and Battery Pack Manufacturers
- Consumer Electronics Manufacturers
- Testing, Inspection, and Certification Providers
- Distributors and Resellers
- End Users
Report Objectives
- To define, describe, and forecast the battery technology market, in terms of battery type and region.
- To evaluate the market, in terms of value, with regard to four main regions: North America, Europe, Asia Pacific, and Rest of the World (RoW) along with their respective countries
- To provide detailed information regarding major factors influencing the market growth (drivers, restraints, opportunities, and challenges)
- To offer a detailed overview of the value chain of battery technology market.
- To strategically analyze micromarkets with respect to individual growth trends, prospects, and contributions to the battery technology market
- To study opportunities in the market for stakeholders by identifying high-growth segments of the battery technology market.
- To strategically profile key players and comprehensively analyze their market position in terms of ranking and core competencies, along with detailing the competitive landscape for market leaders
- To provide ecosystem analysis, case study analysis, patent analysis, technology analysis, trends/disruptions impacting customers' business, impact of AI, pricing analysis, Porter’s five forces analysis, US Tariff analysis, and regulations pertaining to the market under study.
- To analyze competitive strategies, such as product launches, expansions, mergers, and acquisitions, adopted by key market players in the battery technology market.
Available Customizations
With the given market data, MarketsandMarkets offers customizations according to the company’s specific needs. The following customization options are available for the report:
Product Analysis
- Detailed analysis and profiling of additional market players (up to 5)
Key Questions Addressed by the Report
What is the current size of the battery technology market?
The global battery technology market is estimated at USD 252.13 billion in 2025.
What is the projected market size by 2030?
The market is projected to reach USD 431.65 billion by 2030, driven by increasing electrification and energy storage demand.
What is the CAGR of the battery technology market?
The market is expected to grow at a CAGR of 11.4% from 2025 to 2030.
What are the key growth drivers of this market?
Growth is driven by rapid EV adoption, renewable energy integration, and increasing demand for efficient energy storage systems.
What are the major trends in the battery technology market?
Key trends include advancements in solid-state batteries, sodium-ion innovation, improved energy density, faster charging, and AI-driven battery management systems.
Which industries are driving demand for battery technology?
Major industries include automotive (EVs), renewable energy, consumer electronics, industrial manufacturing, and power utilities.
Which regions dominate the battery technology market?
Asia Pacific dominates and is the fastest-growing region (CAGR ~12.4%), followed by North America and Europe.
Who are the key companies in the battery technology market?
Leading players include CATL, BYD Company Ltd., LG Energy Solution, Samsung SDI, and Panasonic Holdings Corporation.
What segments are covered in the report?
The report segments the market by battery type (lithium-ion, solid-state, lead-acid, sodium-ion, flow batteries), application, and region.
What insights does the report provide?
The report includes market forecasts, competitive landscape, value chain analysis, pricing trends, AI impact, regulatory framework, and strategic developments.
Need a Tailored Report?
Customize this report to your needs
Get 10% FREE Customization
Customize This ReportPersonalize This Research
- Triangulate with your Own Data
- Get Data as per your Format and Definition
- Gain a Deeper Dive on a Specific Application, Geography, Customer or Competitor
- Any level of Personalization
Let Us Help You
- What are the Known and Unknown Adjacencies Impacting the Battery Technology Market
- What will your New Revenue Sources be?
- Who will be your Top Customer; what will make them switch?
- Defend your Market Share or Win Competitors
- Get a Scorecard for Target Partners

Custom Market Research Services
We Will Customise The Research For You, In Case The Report Listed Above Does Not Meet With Your Requirements
Get 10% Free CustomisationTESTIMONIALS

Tetsuya Ohhira
Business Development Manager-Technology Business
Nikon Corporation,
Leading Japanese MNC specializing in optics and imaging productswww.nikon.com
MarketsandMarkets™ response
is quick. Their attitude is flexible and positive. Analyst Insights are globally considered and
significant. Client Services quickly respond to our inquiry and demand. Their wide range of global
surveys help us make our strategic plan.
We hope Knowledge Store will be easier to search
for a report.
VP - Marketing & Business Development
Leading Provider of Process Control Solutions
We engaged with MarketsandMarkets on a study to perform an analysis and recommend a Go-To-Market strategy for metrology and process control in the semiconductor market. The study was tailored to our targets and needs with well-defined milestones. Our overall experience with the MarketsandMarkets team was very good throughout the project in all aspects including the analysis methodologies used, the quality and depth of primary and secondary data sets, the professionalism and flexibility of the team and the ability to meet the target schedule and milestones. We want to thank MarketsandMarkets team for a job well done.


Growth opportunities and latent adjacency in Battery Technology Market