Magnetic Materials Market by Type (Semi-Hard Magnet, Soft Magnet, Hard/Permanent Magnet) & by Application (Automotive, Electronics, Industrial, Power Generation, and Others) - Global Forecasts to 2020


[116 Pages Report] The market size of magnetic materials is estimated to have been USD 55.52 billion in 2014, and is projected to reach USD 96.00 billion by 2020, at a CAGR of 9.6% between 2015 and 2020. Semi-hard magnet is projected to play a key role in fueling the growth of the overall magnetic materials market owing to its unique properties, making it suitable for use in various automotive, electronics, industrial, power generation, and other applications. Semi-hard is the most extensively used magnetic materials owing to global demand for technological systems & devices that are used to develop innovative products. In this report, 2014 is considered as the base year and forecast period is 2015�2020.
Market Dynamics
Drivers
- Growing Automotive Industry
- Growth in End-Use Industries
- Development and modernization of infrastructures
Restraints
- Volatile raw material prices
- Requirement of huge investment in R&D
Opportunities
- Development pf new technologies
Development and modernization of infrastructures
The growing trend of modernization and electrification to improve efficiencies and reduce the cost of production enhances the use of permanent magnets in various industries. The building technologies offer advanced solutions that ensure the highest levels of sustainability, energy efficiency, and safety. These not only offer industry-specific solutions for data centers, hospitals, life science companies, airports, hotels, and utility companies, but also offer solutions for commercial buildings of international companies as well as cities and their infrastructures. Permanent magnets are increasingly used in the motors of train doors and lift doors. NdFeB magnets are also used to dewax oil pipelines in China.
The objectives of this study are:
- To define and segment the magnetic materials market
- To identify the market dynamics for magnetic materials
- To analyze and forecast the types and applications of magnetic materials in terms of volume and value
- To analyze and forecast the market size, by value and volume, for different segments based on the key countries of the regions covered in the study
- To analyze and identify drivers, restraints, and opportunities in the market for stakeholders and draw a competitive landscape for the market leaders
- To strategically profile key players and comprehensively analyze their market shares
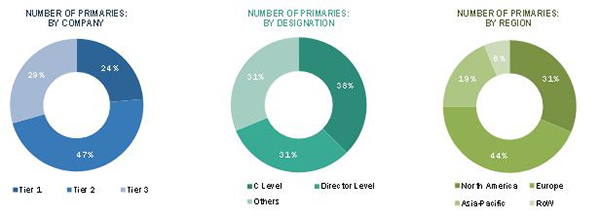
This technical, market-oriented, and commercial research study of the global magnetic material market involves the extensive use of secondary sources, directories, and databases (such as Hoovers, Bloomberg BusinessWeek, and Factiva), to identify and collect information. The primary sources mainly include several industry experts from core and related industries and preferred suppliers, manufacturers, distributors, service providers, and organizations related to all segments of the industry�s supply chain. After arriving at the overall market size, the total market has been split into several segments. The figure below illustrates the breakdown of the primary interviews based on company type, designation, and region conducted during the research study:
The major factor restraining growth of the magnetic materials market is volatile raw materials prices in North America and Western Europe. However, Asian countries such as, China and Japan have increased the production and utilization of magnetic materials.
Some of the important magnetic materials companies are Hitachi Metals Ltd. (Japan), Daido Steel Co. Ltd. (Japan), Molycorp Magnequench (Canada), Shin-Etsu Chemical Co. Ltd. (Japan), and TDK Corp. (Japan). The players in this market need to compete with each other with respect to prices and offering wide product range to meet the market requirements.
Major Market Developments
- In May 2015, Electron Energy Corporation expanded its production capacity for Samarium Cobalt (SmCo) by adding new furnace to its Landisville manufacturing unit.
- In March 2015, Hitachi Metals Ltd. introduced ML95S and ML90s, high frequency characteristic soft ferrite core materials. These materials are to be used in the energy-savings pertaining to the components for automobile, smartphones, and other network equipment.
- In June 2015, Hitachi Metals, Ltd. and Zhong Ke San Huan entered into a joint venture to manufacture and sell neodymium-iron-boron magnets
The target audiences for the magnetic materials market report are as follows:
- Magnetic material manufacturers
- Magnetic material suppliers
- Magnetic material formulators
- Raw material suppliers
- Service providers
- End users, such as automobile, electronic, power generation, and other manufacturing companies
Scope of the Report:
Magnetic Materials Market, by Type:
- Semi-hard magnet
- Soft magnet
- Permanent/hard magnet type
Magnetic Materials Market, by Application:
- Automotive
- Electronics
- Industrial
- Power Generation
- Others
Magnetic Materials Market, by Region:
- Asia-Pacific
- North America
- Europe
- Rest of the World
Available Customizations:
With the given market data, MarketsandMarkets offers customizations according to the company�s specific needs. The following customization options (not limited to) are available for the report:
Regional Analysis
- Further breakdown of a region with respect to a particular country, additional application, and/or type
Country Information
- Additional country information (Up to three)
Company Information
- Detailed analysis and profiling of additional market players (Up to five)
The global magnetic materials market is projected to reach USD 96.00 billion by 2020, registering a CAGR of 9.6% between 2015 and 2020. The growth of the market is primarily driven by the automotive industry. Automobile uses magnetic materials in various parts, such as motors, sensors, actuators, and switches. Increasing concerns to enhance the fuel economy of vehicles force manufacturers to extensively reduce vehicle weight and increase combustion efficiency.
The materials that respond to the applied magnetic field either in the form of attraction or repulsion by generating magnetization or demagnetization property are known as magnetic materials. There are three categories of magnetic materials, namely, soft, semi-hard, and hard/permanent. These are used in various applications such as automotive, electronics, power generation, industrial, and others.
The automotive application dominated the magnetic materials market in 2014; however, the application is projected to register the highest growth rate in the overall market between 2015 and 2020. The increased need for high-quality magnetic materials used in processing automotive bodies and use of advanced technologies boost the market.
The magnetic materials market is classified on the basis of type into semi-hard magnet, soft magnet, and hard/permanent magnet. The market is dominated by semi-hard magnet owing to global demand for technological systems & devices providing innovative products. Some of the related products are antitheft articles, electronic systems, automotive devices, and smart electronic bank cards. Semi-hard magnet is estimated to register high growth during the forecast period.
The industry is highly fragmented in terms of segments to which the products are offered, which increases the market competition for small players. Moreover, the players are focusing on developing innovative products to meet the growing demand from end-use industries.
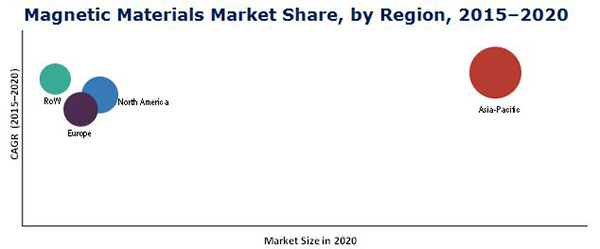
Currently, Asia-Pacific is the largest and fastest-growing market for magnetic materials owing to high demand from major markets, such as China, India, and Japan. The growing automotive industry in the region is also driving the market for magnetic materials.
Automotive, electronics, and Industrial applications to drive the growth of magnetic materials market
Automotive
Magnetic materials have vast applications in the automobile industry. The automobile contains magnetic materials in various parts such as motors, sensors, actuators, and switches. The concerns regarding the fuel economy of vehicles lead the manufacturers to reduce vehicle weight and to increase the combustion efficiency. This has resulted in an elevated use of magnetic materials in automobiles. Magnetic materials are increasingly used in electric motors for various functions such as electric steering, electric braking, electric throttle actuation, auto-clutch, and gearbox actuation.
Electronics
A computer, its peripheral devices, and electronics are the traditional application markets for magnetic materials. Magnetic materials are used in magnetic heads of hard disk drives (HDD), CD, as well as in motors of peripheral devices such as printer, fax machines, scanners, and photocopies. The increasing usage of cloud computing and related development resulted in the growing demand for data centers to store enormous data volumes involved. The mounting demand from data centers for HDD pushes the demand for magnetic materials. Consumer electronics such as air conditioner, washing machines, dryers, and lawn motors use magnetic materials to enhance the efficiency of appliances.
Industrial
The increasing automation in various industries leads to the growth of magnetic materials. The magnetic materials are used in various magnetic assemblies such as metal detectors, magnetic material handling equipment, conveyor belts, and separation equipment. These magnetic assemblies are an essential part of various processing industries such as chemical, food, and ceramic. Industrialization is the back bone of the economic development of any economy. Several developing countries such as China, India, and Brazil are focusing on accelerating industrialization for the economic development of their country. This rapid industrialization drives the demand for advanced magnetic materials.
Critical questions the report answers:
- Where will all these developments take the industry in the mid to long term?
- What are the upcoming applicartions of magnetic materials?
To speak to our analyst for a discussion on the above findings, click Speak to Analyst
The major factor restraining growth of the magnetic materials market is volatile raw materials prices in North America and Western Europe. However, Asian countries such as, China and Japan have increased the production and utilization of magnetic materials.
Some of the important magnetic materials companies are Hitachi Metals Ltd. (Japan), Daido Steel Co. Ltd. (Japan), Molycorp Magnequench (Canada), Shin-Etsu Chemical Co. Ltd. (Japan), and TDK Corp. (Japan). The players in this market need to compete with each other with respect to prices and offering wide product range to meet the market requirements.
 Exclusive indicates content/data unique to MarketsandMarkets and not available with any competitors.
Table of Contents
1 Introduction (Page No. - 14)
1.1 Objectives of the Study
1.2 Market Definition
1.3 Scope of the Study
1.3.1 Markets Covered
1.3.2 Years Considered for the Report
1.4 Currency
1.5 Package Size
1.6 Limitations
1.7 Stakeholders
2 Research Methodology (Page No. - 18)
2.1 Research Data
2.1.1 Secondary Data
2.1.1.1 Key Data From Secondary Sources
2.1.2 Primary Data
2.1.2.1 Key Data From Primary Sources
2.1.2.2 Key Industry Insights
2.1.2.3 Breakdown of Primary Interviews
2.2 Market Size Estimation
2.2.1 Bottom-Up Approach
2.2.2 Top-Down Approach
2.3 Market Breakdown and Data Triangulation
2.4 Research Assumptions
2.4.1 Assumptions
3 Executive Summary (Page No. - 26)
4 Premium Insights (Page No. - 30)
4.1 Significant Opportunities for Magnetic Materials
4.2 Magnetic Materials Market Growth, By Regions (2015-2020)
4.3 Magnetic Materials Market Share in Asia-Pacific, 2014
4.4 Magnetic Materials Market Attractiveness
4.5 Magnetic Materials Market, By Application
4.6 Magnetic Materials Market: Developed vs Developing Nations
4.7 Lifecycle Analysis, By Region, 2014
5 Market Overview (Page No. - 37)
5.1 Introduction
5.2 Market Segmentation
5.3 Market Dynamics
5.3.1 Drivers
5.3.1.1 Growing Automotive Industry
5.3.1.2 Growth in End-Use Industries
5.3.1.3 Development and Modernization of Infrastructure
5.3.2 Restraints
5.3.2.1 Volatile Raw Material Prices
5.3.2.2 Requirement of Huge Investment in R&D
5.3.3 Opportunities
5.3.3.1 Development of New Technologies
5.4 Value Chain Analysis
5.5 Porter�s Five Forces Analysis
5.5.1 Threat of New Entrants
5.5.2 Threat of Substitutes
5.5.3 Bargaining Power of Suppliers
5.5.4 Bargaining Power of Buyers
5.5.5 Intensity of Competitive Rivalry
6 Magnetic Materials Market, By Type (Page No. - 45)
6.1 Introduction
6.2 Market Size and Projection
6.2.1 Hard/Permanent Magnet
6.2.2 Semi-Hard Magnet
6.2.3 Soft Magnet
7 Magnetic Materials Market, By Application (Page No. - 52)
7.1 Introduction
7.1.1 Automotive
7.1.2 Electronics
7.1.3 Industrial
7.1.4 Power Generation
7.1.5 Others
8 Magnetic Materials Market, By Region (Page No. - 56)
8.1 Introduction
8.2 Asia-Pacific
8.2.1 China
8.2.2 Japan
8.2.3 India
8.2.4 Rest of Asia-Pacific
8.3 North America
8.3.1 U.S.
8.3.2 Canada
8.3.3 Mexico
8.4 Europe
8.4.1 Germany
8.4.2 France
8.4.3 U.K.
8.4.4 Italy
8.4.5 Rest of Europe
8.5 RoW
8.5.1 Middle East & Africa
8.5.2 Latin America
9 Competitive Landscape (Page No. - 86)
9.1 Overview
9.2 Expansions: the Most Adopted Growth Strategy
9.3 Maximum Developments in 2013
9.4 Competitive Situations and Trends
9.4.1 Expansions
9.4.2 New Product Launches
9.4.3 Partnerships
9.4.4 Joint Ventures
9.4.5 Acquisitions
9.4.6 Agreements
9.4.7 Investments
10 Company Profiles (Page No. - 94)
(Overview, Financial*, Products & Services, Strategy, and Developments)
10.1 Regional Revenue Mix of Major Market Players
10.2 Hitachi Metals, Ltd.
10.3 Daido Steel Co., Ltd.
10.4 Molycorp Magnequench
10.5 Shin-ETSU Chemical Co., Ltd.
10.6 TDK Corporation
10.7 Lynas Corporation Ltd.
10.8 Arnold Magnetic Technologies Corporation
10.9 Electron Energy Corporation
10.10 Tengam Engineering, Inc.
10.11 Adams Magnetic Products Co., Inc.
*Details Might Not Be Captured in Case of Unlisted Companies
11 Appendix (Page No. - 111)
11.1 Insights From Industry Experts
11.2 Discussion Guide
11.3 Introducing RT: Real Time Market Intelligence
11.4 Available Customizations
11.5 Related Reports
List of Tables (71 Tables)
Table 1 Magnetic Materials Market Size, By Type, 2013�2020 (Kiloton)
Table 2 Magnetic Materials Market Size, By Type, 2013�2020 (USD Million)
Table 3 Hard/Permanent Magnet Market Size, By Region, 2013�2020 (Kiloton)
Table 4 Hard/Permanent Magnet Market Size, By Region, 2013�2020 (USD Million)
Table 5 Semi-Hard Magnet Market Size, By Region, 2013�2020 (Kiloton)
Table 6 Semi-Hard Magnet Market Size, By Region, 2013�2020 (USD Million)
Table 7 Soft Magnet Market Size, By Region, 2013�2020 (Kiloton)
Table 8 Soft Magnet Market Size, By Region, 2013�2020 (USD Million)
Table 9 Magnetic Materials Market Size, By Application, 2013�2020 (Kiloton)
Table 10 Magnetic Materials Market Size, By Application, 2013�2020 (USD Million)
Table 11 Magnetic Materials Market Size, By Region, 2013�2020 (Kiloton)
Table 12 Magnetic Materials Market Size, By Region, 2013�2020 (USD Million)
Table 13 Asia-Pacific: By Market Size, By Country, 2013�2020 (Kiloton)
Table 14 Asia-Pacific: By Market Size, By Country, 2013�2020 (USD Million)
Table 15 Asia-Pacific: By Market Size, By Type, 2013�2020 (Kiloton)
Table 16 Asia-Pacific: By Market Size, By Type, 2013�2020 (USD Million)
Table 17 Asia-Pacific: By Market Size, By Application, 2013�2020 (Kiloton)
Table 18 Asia-Pacific: By Market Size, By Application, 2013�2020 (USD Million)
Table 19 China: Magnetic Materials Market Size, By Application, 2013�2020 (Kiloton)
Table 20 China: Magnetic Materials Market Size, By Application, 2013�2020 (USD Million)
Table 21 Japan: Magnetic Materials Market Size, By Application, 2013�2020 (Kiloton)
Table 22 Japan: Magnetic Materials Market Size, By Application, 2013�2020 (USD Million)
Table 23 India: Magnetic Materials Market Size, By Application, 2013�2020 (Kiloton)
Table 24 India: Magnetic Materials Market Size, By Application, 2013�2020 (USD Million)
Table 25 Rest of Asia-Pacific: Magnetic Materials Market Size, By Application, 2013�2020 (USD Million)
Table 26 Rest of Asia-Pacific: Magnetic Materials Market Size, By Application, 2013�2020 (USD Million)
Table 27 North America: By Market Size, By Country, 2013�2020 (Kiloton)
Table 28 North America: By Market Size, By Country, 2013�2020 (USD Million)
Table 29 North America: By Market Size, By Type, 2013�2020 (Kiloton)
Table 30 North America: By Market Size, By Type, 2013�2020 (USD Million)
Table 31 North America: By Market Size, By Application, 2013�2020 (Kiloton)
Table 32 North America: By Market Size, By Application, 2013�2020 (USD Million)
Table 33 U.S.: Magnetic Materials Market Size, By Application, 2013-2020 (Kiloton)
Table 34 U.S.: Magnetic Materials Market Size, By Application, 2013-2020 (USD Million)
Table 35 Canada: Magnetic Materials Market Size, By Application, 2013�2020 (Kiloton)
Table 36 Canada: Magnetic Materials Market Size, By Application, 2013�2020 (USD Million)
Table 37 Mexico: Magnetic Materials Market Size, By Application, 2013-2020 (Kiloton)
Table 38 Mexico: Magnetic Materials Market Size, By Application, 2013�2020 (USD Million)
Table 39 Europe: Magnetic Materials Market Size, By Country, 2013�2020 (Kiloton)
Table 40 Europe: By Market Size, By Country, 2013�2020 (USD Million)
Table 41 Europe: By Market Size, By Type, 2013�2020 (Kiloton)
Table 42 Europe: By Market Size, By Types, 2013�2020 (USD Million)
Table 43 Europe: By Market Size, By Application, 2013�2020 (Kiloton)
Table 44 Europe: By Market Size, By Application, 2013�2020 (USD Million)
Table 45 Germany: Magnetic Materials Market Size, By Application, 2013�2020 (Kiloton)
Table 46 Germany: Magnetic Materials Market Size, By Application, 2013�2020 (USD Million)
Table 47 France: Magnetic Materials Market Size, By Application, 2013�2020 (Kiloton)
Table 48 France: Magnetic Materials Market Size, By Application, 2013�2020 (USD Million)
Table 49 U.K.: By Market Size, By Application, 2013�2020 (Kiloton)
Table 50 U.K.: By Market Size, By Application, 2013�2020 (USD Million)
Table 51 Italy: By Market Size, By Application, 2013�2020 (Kiloton)
Table 52 Italy: By Market Size, By Application, 2013�2020 (USD Million)
Table 53 Rest of Europe: Magnetic Materials Market Size, By Application, 2013�2020 (Kiloton)
Table 54 Rest of Europe: Magnetic Materials Market Size, By Application, 2013�2020 (USD Million)
Table 55 RoW: Magnetic Materials Market Size, By Country, 2013�2020 (Kiloton)
Table 56 RoW: By Market Size, By Country, 2013�2020 (USD Million)
Table 57 RoW: By Market Size, By Type, 2013�2020 (Kiloton)
Table 58 RoW: By Market Size, By Type, 2013�2020 (USD Million)
Table 59 RoW: By Market Size, By Application, 2013�2020 (Kiloton)
Table 60 RoW: By Market Size, By Application, 2013�2020 (USD Million)
Table 61 Middle East & Africa: Magnetic Materials Market Size, By Type, 2013�2020 (Kiloton)
Table 62 Middle East: Magnetic Materials Market Size, By Application, 2013�2020 (USD Million)
Table 63 Latin America: Magnetic Materials Market Size, By Application, 2013�2020 (Kiloton)
Table 64 Latin America: Magnetic Materials Market Size, By Application, 2013�2020 (USD Million)
Table 65 Expansions, 2012�2015
Table 66 New Product Launches, 2012�2015
Table 67 Partnerships, 2012�2015
Table 68 Joint Ventures, 2012�2015
Table 69 Acquisitions, 2012�2015
Table 70 Agreements, 2012�2015
Table 71 Investments, 2012�2015
List of Figures (38 Figures)
Figure 1 Magnetic Materials Market: Research Design
Figure 2 Market Size Estimation: Bottom-Up Approach
Figure 3 Market Size Estimation: Top-Down Approach
Figure 4 Magnetic Materials Market: Data Triangulation
Figure 5 Semi-Hard Magnet to Dominate the Magnetic Materials Market Between 2015 and 2020
Figure 6 Automotive Segment to Register the Highest CAGR During the Forecast Period
Figure 7 Asia-Pacific to Witness the Highest Growth Rate During the Forecast Period
Figure 8 Asia-Pacific is Estimated to Be the Largest Market for Magnetic Materials (2015�2020)
Figure 9 Magnetic Materials Market to Witness Rapid Growth Between 2015 and 2020
Figure 10 Asia-Pacific to Witness the Highest Growth Rate Between 2015 and 2020
Figure 11 China Accounted for the Largest Share in the Asia-Pacific Region in 2014
Figure 12 Increasing Demand From End-Use Industries to Drive the Magnetic Materials Market in Asia-Pacific Between 2015 and 2020
Figure 13 Automotive Segment Dominated the Magnetic Materials Market in 2014
Figure 14 China to Emerge as A Lucrative Market Between 2015 and 2020
Figure 15 Asia-Pacific to Witness High Growth During the Forecast Period
Figure 16 Magnetic Materials Market, By Region
Figure 17 Overview of the Forces Governing the Magnetic Materials Market
Figure 18 Raw Material Accounts for the Major Value Addition
Figure 19 Porter�s Five Forces Analysis
Figure 20 Types of Magnetic Materials
Figure 21 Semi-Hard Magnets are the Most Preferred Magnetic Materials
Figure 22 Automotive Segment to Witness High Growth During the Forecast Period
Figure 23 Asia-Pacific to Drive the Automotive Market Between 2015 and 2020
Figure 24 Regional Snapshot (2015�2020): China and India are Emerging as New Hotspots
Figure 25 China and India to Be the Fastest-Growing Markets for Magnetic Materials Between 2015 and 2020
Figure 26 Asia-Pacific Market Snapshot: China to Continue to Dominate the Market
Figure 27 North American Market Snapshot: U.S. to Register Moderate Growth
Figure 28 European Market Snapshot: Automotive Segment to Dominate the Magnetic Materials Market
Figure 29 Middle East & Africa to Register Highest CAGR Between 2015 & 2020
Figure 30 Companies Adopted Expansions as the Key Growth Strategy Between 2012 and 2015
Figure 31 Maximum Developments Through Expansions Between 2012 and 2015
Figure 32 Asia-Pacific Witnessed Maximum Number of Developments Between 2012 and 2015
Figure 33 Hitachi Metals, Ltd.: Company Snapshot
Figure 34 Daido Steel Co., Ltd.: Company Snapshot
Figure 35 Molycorp Magnequench: Company Snapshot
Figure 36 Shin-ETSU Chemical Co., Ltd.: Company Snapshot
Figure 37 TDK Corporation: Company Snapshot
Figure 38 Lynas Corporation Ltd.: Company Snapshot


Growth opportunities and latent adjacency in Magnetic Materials Market