Marine Propeller Market by Type (Propellers, Thrusters), Application (Merchant Ships, Naval Ships, Boats), Material (Stainless Steel, Aluminium, Bronze, Nickel-Aluminium Bronze), End User, Propulsion, Number of Blades, Region - Global Forecast to 2022


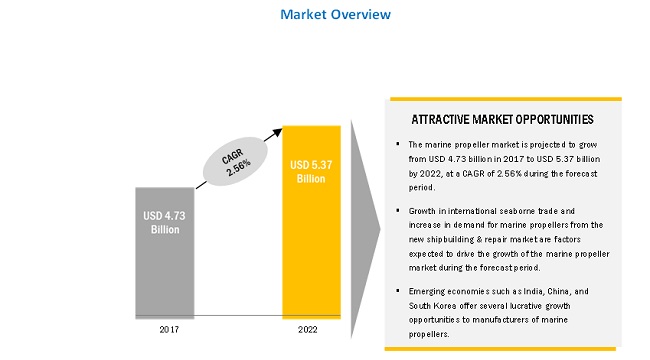
The marine propeller market size is estimated to be USD 4.73 billion in 2017 and is projected to reach USD 5.37 billion by 2022, at a CAGR of 2.56% from 2017 to 2022. The growth in international seaborne trade, increased demand for marine propellers from the new shipbuilding & repair market, and growth in maritime tourism are key factors anticipated to drive the market. Increased seaborne trade worldwide has pushed the demand for merchant Ships, subsequently marine propellers. The increase in shipbuilding capacity in countries, such as China, Japan, and South Korea, is anticipated to drive the growth of the market in the Asia Pacific region.
Based on type, the propellers segment is projected to grow at the highest CAGR during the forecast period
Based on type, the propellers segment of the marine propeller market is projected to grow at the highest CAGR from 2017 to 2022. The propeller is a fan-like structure that transmits power by converting rotational motion into thrust. Propellers are commonly used in naval vessels and are made of different alloys. Marine propellers help improve the efficiency of naval vessels, thereby resulting in minimal maintenance and reduced cavitation.
Based on number of blades, the 5-blade segment is anticipated to witness the highest growth during the forecast period
Based on number of blades, the 5-blade segment of the marine propeller market is projected to grow at the highest CAGR during the forecast period. 5-blade propellers offer improved propulsion efficiency and have less vibration as compared to 4-blade propellers.
The marine propeller market in Asia Pacific is expected to witness the highest market size during the forecast period
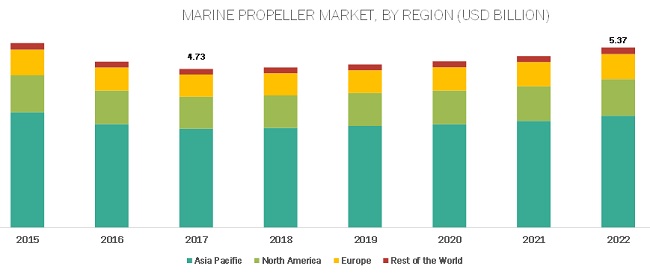
The marine propeller market in Asia Pacific is projected to be highest in market size during the forecast period. The Asia pacific shipbuilding industry is involved in the construction of complex naval vessels, such as cruise ships, ferries, mega yachts, submarines, and dredgers (offshore vessels). Moreover, the marine equipment industry in Asia Pacific offers a wide range of products that include propulsion systems, diesel engines, environmental safety systems, cargo handling systems, and related electronics. The demand for marine propellers in the defense sector, especially the navy, is projected to increase, owing to the ongoing territorial conflicts among countries, such as China, the Philippines, North Korea, Japan, India, Vietnam, Pakistan, and Afghanistan.
The market in Europe is projected to grow at the fastest rate during the forecast period. The rise in seaborne trade has subsequently led to an increase in demand for ships that are used to transport manufactured goods to various regions worldwide. Thus, the rise in the number of ships has contributed to the growing demand for propulsion systems and propellers in this region.
Market Dynamics : Marine Propeller Market
Driver: Growth in international seaborne trade
Maritime transport is considered the backbone of international trade. According to data published by the International Chamber of Shipping (UK), approximately 90% of the global volume of merchandise trade is being carried by sea as transport of goods and raw material through this channel is much cheaper than rail and road transport.
Countries in the Asia Pacific region have become leading providers of manufactured goods. The demand for container ships is significantly high in this region, owing to an increase in the export of goods. Most shipbuilding companies, including manufacturers of propulsion systems and propellers, are located in the Asia Pacific region. Thus, the demand for maritime transport services and the growth of the shipping industry in Asia Pacific have contributed to the increased demand for marine propellers in this region.
Restraint: Stringent environmental regulations worldwide
Numerous environmental regulations, policies, and subsidy schemes vary country-wise based on the intensity of emission caused by harmful gases, such as SOx, NOx, and CO2. For instance, MARPOL Annex VI guidelines released by the International Maritime Organization (UK) defined the limits for NOx emissions and mandated the use of fuels with low sulfur content in 2005. These guidelines are applicable to vessels and ships trading in US waters as well as within 200 nautical miles of the coast of North America, which is also known as the North American Emission Control Area (ECA). Manufacturers of ship components are focused on the development of marine propulsion systems that comply with various environmental regulations formulated by governments of countries worldwide.
Opportunity: Technological innovations in marine propulsion systems
Over the past decade, innovation in marine technology has resulted in the advent of highly advanced and energy-efficient marine propulsion systems that offer maximum output with minimum fuel consumption. Presently, shipping operations across the globe consume approximately 200 million tons of diesel and oil annually. Merchant vessels used for shipping operations emit the same percentage of sulfur oxide as compared to other transport vehicles, such as cars, trucks, and buses. The innovation of hybrid power marine engines and propulsion systems has resolved the issue associated with high fuel consumption and subsequently emissions. Reduction in fuel consumption will reduce the cost associated with seaborne trade which will further increase the seaborne trade and demand for new merchant ships.
Challenge: Shipping overcapacity
Shipping overcapacity refers to the oversupply of shipping vessels against their demand. The anticipation of continued expansion in trading activities, for which new vessels are ordered to cater to the expected demand, is one of the major factors that has led to shipping overcapacity. New energy-efficient vessels are being developed to replace old vessels. However, a few of the old vessels have not been scrapped, owing to their low scrapping value. These vessels are sold in the market, thereby adding more tonnage to the already oversupplied market. The overcapacity in the shipping industry has led to a decline in the number of new orders of vessels, despite growth in the international seaborne trade. Thus, reduction in new shipbuilding orders is anticipated to act as a key challenge to the growth of the marine propeller market.
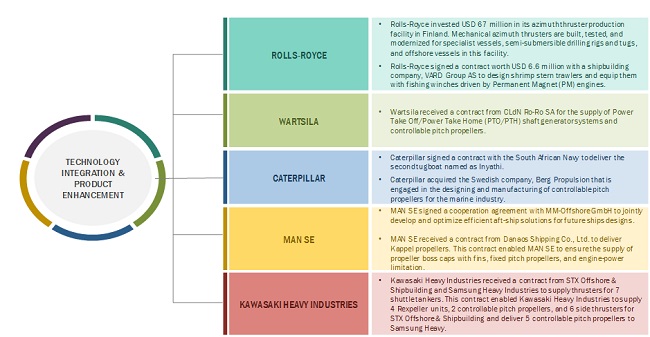
Technology integration & Product Enhancement of key players
Scope of the report
|
Report Metric |
Details |
|
Market size available for years |
2017-2022 |
|
Base year considered |
2016 |
|
Forecast period |
2017-2022 |
|
Forecast units |
Value (USD) |
|
Segments covered for Marine Propeller Market |
Propeller type, application, material, end user, propulsion, number of blades, and region |
|
Geographies covered |
North America, Europe, Asia Pacific, Middle East, Latin America, and Africa |
|
Companies covered |
Rolls-Royce (UK), Wartsila (Finland), Hyundai Heavy Industries (South Korea), MAN SE (Germany), and Caterpillar (US) |
Marine Propeller Market, By Type
- Propellers
- Thrusters
- Others
Marine Propeller Market, By Application
- Merchant Ships
- Naval Ships
- Recreational Boats
- Others
Marine Propeller Market, By Number of Blades
- 3-blade
- 4-blade
- 5-blade
- Others
Marine Propeller Market, By End User
- OEM
- Aftermarket
Marine Propeller Market, By Propulsion
- Inboard
- Outboard
- Sterndrive
- Others
Marine Propeller Market, By Material
- Stainless Steel
- Aluminium
- Bronze
- Nickel-Aluminium Bronze
- Others
Marine Propeller Market, By Region
- North America
- Europe
- Asia
- Rest of the World
Key market players
Rolls-Royce (UK), Wartsila (Finland), Hyundai Heavy Industries (South Korea), MAN SE (Germany), Caterpillar (US), Kawasaki Heavy Industries, Brunswick, Volvo, Nakashima Propeller, and Schottel.Recent Developments
- In March 2017, Wartsila received a contract from CLdN Ro-Ro SA for the supply of Power Take Off/Power Take Home (PTO/PTH) shaft generator systems and controllable pitch propellers.
- In May 2016, MAN SE received a contract from Danaos Shipping Co., Ltd. to deliver Kappel propellers. This contract enabled MAN SE to ensure the supply of propeller boss caps with fins, fixed pitch propellers, and engine-power limitation.
- In February 2016, MAN SE received a contract from United Ethane Carries (Singapore) to deliver 5 85,000m3 Very Large Ethane Carriers (VLECs). Each of the vessels is powered by MAN B&W 6G60ME-GI main engine. These carriers are fitted with MAN Diesel & Turbo�s Alpha controllable pitch propeller, with Kappel blades and a faring cone/rudder build system that increases the efficiency of ethane carriers.
- In February 2016, Caterpillar signed a contract with the South African Navy to deliver the second tugboat named as Inyathi. This tugboat is powered by Caterpillar 3512 C HD engines, with a total power output of 3,000 bkW.
- In December 2015, Caterpillar signed a contract with Mekers Offshore Company to supply diesel-electric propulsion package for 2 lifeboats. This contract enabled the company to offer 2 identical diesel-electric systems that feature 4 Cat Propulsion MTA-523 1500kW azimuth thrusters driven by electric motors and soft starters.
- In November 2015, Rolls-Royce signed a contract with Sanmar Shipyards (Turkey) to deliver 12 steerable propellers and azimuth thrusters. These new thrusters provided propulsion for 6 tugboats initially, which is anticipated to reach 21 tugboats in the near future.
Critical questions the report answers:
- Where will all these developments take the industry in the long term?
- What are the upcoming trends in the Marine propellers market?
- Which segment provides the most opportunity for growth?
- Who are the leading vendors operating in this market?
- What are the opportunities for new market entrants?
 Exclusive indicates content/data unique to MarketsandMarkets and not available with any competitors.
Table of Contents
1 Introduction (Page No. - 17)
1.1 Objectives of the Study
1.2 Market Definition
1.3 Study Scope
1.3.1 Markets Covered
1.3.2 Regional Scope
1.3.3 Years Considered for the Study
1.4 Currency & Pricing
1.5 Market Stakeholders
2 Research Methodology (Page No. - 21)
2.1 Research Data
2.1.1 Secondary Data
2.1.1.1 Secondary Sources
2.1.2 Primary Data
2.1.2.1 Primary Sources
2.1.2.2 Breakdown of Primaries
2.2 Market Size Estimation
2.2.1 Bottom-Up Approach
2.2.2 Top-Down Approach
2.3 Market Breakdown & Data Triangulation
2.4 Research Assumptions
2.5 Limitations
3 Executive Summary (Page No. - 30)
4 Premium Insights (Page No. - 34)
4.1 Attractive Opportunities in the Market
4.2 Marine Propeller Market, By Type
4.3 Asia Marine Propeller Market, By Application and Country
4.4 Market, By Propulsion
4.5 Market, By End User
5 Market Overview (Page No. - 37)
5.1 Introduction
5.2 Market Dynamics
5.2.1 Drivers
5.2.1.1 Growth in International Seaborne Trade
5.2.1.2 Increased Demand for Marine Propellers From the New Shipbuilding & Repair Market
5.2.1.3 Growth in Maritime Tourism
5.2.2 Restraints
5.2.2.1 Stringent Environmental Regulations Worldwide
5.2.2.2 Accidents Caused By Propellers
5.2.3 Opportunities
5.2.3.1 Increased Navy Budgets Worldwide
5.2.3.2 Technological Innovations in Marine Propulsion Systems
5.2.4 Challenges
5.2.4.1 Fluctuation in Oil & Gas Prices
5.2.4.2 Shipping Overcapacity
5.2.4.3 Low Freight Rates
6 Industry Trends (Page No. - 45)
6.1 Introduction
6.2 Ecosystem of the Marine Propellers Market
6.3 Technological Trends
6.3.1 Fuel Efficient Propulsion Systems
6.3.2 Advanced Materials
6.3.3 Rim Thrusters
6.3.4 Anti-Fouling Coatings
6.4 Strategic Benchmarking
6.5 Innovations & Patent Registrations
6.6 Regulatory Bodies Across Various Regions
7 Marine Propeller Market, By Type (Page No. - 50)
7.1 Introduction
7.2 Propellers
7.2.1 Fixed Pitch Propeller (FPP)
7.2.2 Controllable Pitch Propeller (CPP)
7.3 Thrusters
7.3.1 Azimuth
7.3.2 Tunnel
7.4 Others
8 Marine Propeller Market, By Material (Page No. - 57)
8.1 Introduction
8.2 Nickel-Aluminium Bronze
8.3 Bronze
8.4 Stainless Steel
8.5 Aluminium
8.6 Others
9 Marine Propeller Market, By Application (Page No. - 62)
9.1 Introduction
9.2 Merchant Ships
9.2.1 Merchant Ships Segment, By Type
9.2.2 Merchant Ships Segment, By Propellers
9.2.3 Merchant Ships Segment, By Material
9.3 Naval Ships
9.3.1 Naval Ships Segment, By Type
9.3.2 Naval Ships Segment, By Propellers
9.3.3 Naval Ships Segment, By Material
9.4 Recreational Boats
9.4.1 Recreational Boats Segment, By Type
9.4.2 Recreational Boats Segment, By Propellers
9.4.3 Recreational Boats Segment, By Material
9.5 Others
9.5.1 Other Applications Segment, By Type
9.5.2 Other Applications Segment, By Propellers
9.5.3 Other Applications Segment, By Material
10 Marine Propeller Market, By Number of Blades (Page No. - 72)
10.1 Introduction
10.2 3-Blade
10.2.1 3-Blade Marine Propellers Market, By Application
10.3 4-Blade
10.3.1 4-Blade Marine Propellers Market, By Application
10.4 5-Blade
10.4.1 5-Blade Marine Propellers Market, By Application
10.5 Others
10.5.1 Other Blades Marine Propellers Market, By Application
11 Marine Propeller Market, By End User (Page No. - 78)
11.1 Introduction
11.2 Original Equipment Manufacturer (OEM)
11.3 Aftermarket
12 Marine Propeller Market, By Propulsion (Page No. - 82)
12.1 Introduction
12.2 Inboard
12.3 Outboard
12.4 Sterndrive
12.5 Others
13 Regional Analysis (Page No. - 87)
13.1 Introduction
13.2 Asia
13.2.1 China
13.2.2 South Korea
13.2.3 Japan
13.2.4 Philippines
13.2.5 Vietnam
13.2.6 India
13.3 North America
13.3.1 Us
13.3.2 Canada
13.4 Europe
13.4.1 Germany
13.4.2 France
13.4.3 Turkey
13.4.4 Italy
13.4.5 Norway
13.4.6 Russia
13.4.7 Uk
13.5 Rest of the World
13.5.1 Brazil
13.5.2 Others
14 Competitive Landscape (Page No. - 131)
14.1 Introduction
14.2 Rank Analysis of Key Players in the Market
14.3 Competitive Situation and Trends
14.3.1 Contracts
14.3.2 New Product Launches
14.3.3 Agreements, Expansions, Acquisitions, and Investments
15 Company Profiles (Page No. - 140)
(Overview, Products and Services, Financials, Strategy & Development)*
15.1 Introduction
15.2 Financial Highlights
15.3 Rolls-Royce
15.4 Wartsila
15.5 Hyundai Heavy Industries
15.6 Man SE
15.7 Caterpillar
15.8 Kawasaki Heavy Industries
15.9 Brunswick
15.10 Volvo
15.11 Nakashima Propeller
15.12 Schottel
*Details on Overview, Products and Services, Financials, Strategy & Development Might Not Be Captured in Case of Unlisted Companies
16 Appendix (Page No. - 167)
16.1 Discussion Guide
16.2 Knowledge Store: Marketsandmarkets� Subscription Portal
16.3 Introducing RT: Real Time Market Intelligence
16.4 Available Customizations
16.5 Related Reports
16.6 Author Details
List of Tables (140 Tables)
Table 1 Recent Ship Repair Contracts
Table 2 Innovations & Patent Registrations, 2012-2017
Table 3 Market Size, By Type, 2015-2022 (USD Million)
Table 4 Propellers Segment, By Subtype, 2015�2022 (USD Million)
Table 5 Fixed Pitch Propeller (FPP) Subsegment, By Region, 2015�2022 (USD Million)
Table 6 Controllable Pitch Propeller (CPP) Subsegment, By Region, 2015�2022 (USD Million)
Table 7 Thrusters Segment, By Subtype, 2015�2022 (USD Million)
Table 8 Azimuth Subsegment, By Region, 2015�2022 (USD Million)
Table 9 Tunnel Subsegment, By Region, 2015�2022 (USD Million)
Table 10 Others Segment, By Region, 2015�2022 (USD Million)
Table 11 Market Size, By Material, 2015-2022 (USD Million)
Table 12 Nickel-Aluminium Bronze Market, By Region, 2015�2022 (USD Million)
Table 13 Bronze Market, By Region, 2015�2022 (USD Million)
Table 14 Stainless Steel Market, By Region, 2015�2022 (USD Million)
Table 15 Aluminium Market, By Region, 2015�2022 (USD Million)
Table 16 Others Market, By Region, 2015�2022 (USD Million)
Table 17 Market Size, By Application, 2015-2022 (USD Million)
Table 18 Merchant Ships Segment, By Region, 2015�2022 (USD Million)
Table 19 Merchant Ships Segment, By Type, 2015-2022 (USD Million)
Table 20 Merchant Ships Segment, By Propellers, 2015-2022 (USD Million)
Table 21 Merchant Ships Segment, By Material, 2015-2022 (USD Million)
Table 22 Naval Ships Segment, By Region, 2015�2022 (USD Million)
Table 23 Naval Ships Segment, By Type, 2015-2022 (USD Million)
Table 24 Naval Ships Segment, By Propellers, 2015-2022 (USD Million)
Table 25 Naval Ships Segment, By Material, 2015-2022 (USD Million)
Table 26 Recreational Boats Segment, By Region, 2015�2022 (USD Million)
Table 27 Recreational Boats Segment, By Type, 2015-2022 (USD Million)
Table 28 Recreational Boats Segment, By Propellers, 2015-2022 (USD Million)
Table 29 Recreational Boats Segment, By Material, 2015-2022 (USD Million)
Table 30 Others Segment, By Region, 2015�2022 (USD Million)
Table 31 Other Applications Segment, By Type, 2015-2022 (USD Million)
Table 32 Other Applications Segment, By Propellers, 2015-2022 (USD Million)
Table 33 Other Applications Segment, By Material, 2015-2022 (USD Million)
Table 34 Market Size, By Number of Blades, 2015-2022 (USD Million)
Table 35 3-Blade Market, By Region, 2015�2022 (USD Million)
Table 36 3-Blade Market, By Application, 2015�2022 (USD Million)
Table 37 4-Blade Market, By Region, 2015�2022 (USD Million)
Table 38 4-Blade Market, By Application, 2015�2022 (USD Million)
Table 39 5-Blade Market, By Region, 2015�2022 (USD Million)
Table 40 5-Blade Market, By Application, 2015�2022 (USD Million)
Table 41 Other Blades Market, By Region, 2015�2022 (USD Million)
Table 42 Other Blades Market, By Application, 2015�2022 (USD Million)
Table 43 Market Size, By End User, 2015-2022 (USD Million)
Table 44 OEM Segment, By Region, 2015-2022 (USD Million)
Table 45 Aftermarket Segment, By Region, 2015-2022 (USD Million)
Table 46 Aftermarket Segment, By Offering, 2015-2022 (USD Million)
Table 47 Aftermarket Sales, By Type, 2015-2022 (USD Million)
Table 48 Market Size, By Propulsion, 2015-2022 (USD Million)
Table 49 Inboard Segment, By Region, 2015�2022 (USD Million)
Table 50 Outboard Segment, By Region, 2015�2022 (USD Million)
Table 51 Sterndrive Segment, By Region, 2015�2022 (USD Million)
Table 52 Others Segment, By Region, 2015�2022 (USD Million)
Table 53 Market Size, By Region, 2015-2022 (USD Million)
Table 54 Asia: Market Size, By Type, 2015-2022 (USD Million)
Table 55 Asia: Market Size, By Propellers, 2015-2022 (USD Million)
Table 56 Asia: Market Size, By Thrusters, 2015-2022 (USD Million)
Table 57 Asia: Market Size, By Material, 2015-2022 (USD Million)
Table 58 Asia: Market Size, By Number of Blades, 2015-2022 (USD Million)
Table 59 Asia: Market Size, By Application, 2015-2022 (USD Million)
Table 60 Asia: Market Size, By End User, 2015-2022 (USD Million)
Table 61 Asia: Market Size, By Country, 2015-2022 (USD Million)
Table 62 China: Market Size, By Type, 2015-2022 (USD Million)
Table 63 China: Market Size, By Propellers, 2015-2022 (USD Million)
Table 64 China: Market Size, By Application, 2015-2022 (USD Million)
Table 65 South Korea: Market Size, By Type, 2015-2022 (USD Million)
Table 66 South Korea: Market Size, By Propellers, 2015-2022 (USD Million)
Table 67 South Korea: Market Size, By Application, 2015-2022 (USD Million)
Table 68 Japan: Market Size, By Type, 2015-2022 (USD Million)
Table 69 Japan: Market Size, By Propellers, 2015-2022 (USD Million)
Table 70 Japan: Market Size, By Application, 2015-2022 (USD Million)
Table 71 Philippines: Market Size, By Type, 2015-2022 (USD Million)
Table 72 Philippines: Marine Propeller Industry Size, By Propellers, 2015-2022 (USD Million)
Table 73 Philippines: Marine Propeller Industry Size, By Application, 2015-2022 (USD Million)
Table 74 Vietnam: Marine Propeller Industry Size, By Type, 2015-2022 (USD Million)
Table 75 Vietnam: Marine Propeller Industry Size, By Propellers, 2015-2022 (USD Million)
Table 76 Vietnam: Marine Propeller Industry Size, By Application, 2015-2022 (USD Million)
Table 77 India: Marine Propeller Industry Size, By Type, 2015-2022 (USD Million)
Table 78 India: Market Size, By Type, 2015-2022 (USD Million)
Table 79 India: Market Size, By Application, 2015-2022 (USD Million)
Table 80 North America: Market Size, By Type, 2015-2022 (USD Million)
Table 81 North America: Market Size, By Propellers, 2015-2022 (USD Million)
Table 82 North America: Market Size, By Thrusters, 2015-2022 (USD Million)
Table 83 North America: Market Size, By Material, 2015-2022 (USD Million)
Table 84 North America: Market Size, By Number of Blades, 2015-2022 (USD Million)
Table 85 North America: Market Size, By Application, 2015-2022 (USD Million)
Table 86 North America: Market Size, By End User, 2015-2022 (USD Million)
Table 87 North America: Market Size, By Country, 2015-2022 (USD Million)
Table 88 US: Market Size, By Type, 2015-2022 (USD Million)
Table 89 US: Market Size, By Propellers, 2015-2022 (USD Million)
Table 90 US: Market Size, By Application, 2015-2022 (USD Million)
Table 91 Canada: Market Size, By Type, 2015-2022 (USD Million)
Table 92 Canada: Market Size, By Propellers, 2015-2022 (USD Million)
Table 93 Canada: Market Size, By Application, 2015-2022 (USD Million)
Table 94 Europe: Market Size, By Type, 2015-2022 (USD Million)
Table 95 Europe: Market Size, By Propellers, 2015-2022 (USD Million)
Table 96 Europe: Marine Propeller Industry Size, By Thrusters, 2015-2022 (USD Million)
Table 97 Europe: Marine Propeller Industry Size, By Material, 2015-2022 (USD Million)
Table 98 Europe: Marine Propeller Industry Size, By Number of Blades, 2015-2022 (USD Million)
Table 99 Europe: Marine Propeller Industry Size, By Application, 2015-2022 (USD Million)
Table 100 Europe: Marine Propeller Industry Size, By End User, 2015-2022 (USD Million)
Table 101 Europe: Marine Propeller Industry Size, By Country, 2015-2022 (USD Million)
Table 102 Germany: Marine Propeller Industry Size, By Type, 2015-2022 (USD Million)
Table 103 Germany: Marine Propeller Industry Size, By Propellers, 2015-2022 (USD Million)
Table 104 Germany: Market Size, By Application, 2015-2022 (USD Million)
Table 105 France: Market Size, By Type, 2015-2022 (USD Million)
Table 106 France: Market Size, By Propellers, 2015-2022 (USD Million)
Table 107 France: Market Size, By Application, 2015-2022 (USD Million)
Table 108 Turkey: Market Size, By Type, 2015-2022 (USD Million)
Table 109 Turkey: Marine Propeller Market Size, By Propellers, 2015-2022 (USD Million)
Table 110 Turkey: Marine Propeller Market Size, By Application, 2015-2022 (USD Million)
Table 111 Italy: Market Size, By Type, 2015-2022 (USD Million)
Table 112 Italy: Market Size, By Propellers, 2015-2022 (USD Million)
Table 113 Italy: Market Size, By Application, 2015-2022 (USD Million)
Table 114 Norway: Marine Propeller Market Size, By Type, 2015-2022 (USD Million)
Table 115 Norway: Marine Propeller Market Size, By Propellers, 2015-2022 (USD Million)
Table 116 Norway: Market Size, By Application, 2015-2022 (USD Million)
Table 117 Russia: Marine Propeller Market Size, By Type, 2015-2022 (USD Million)
Table 118 Russia: Marine Propeller Market Size, By Propellers, 2015-2022 (USD Million)
Table 119 Russia: Market Size, By Application, 2015-2022 (USD Million)
Table 120 UK: Marine Propeller Market Size, By Type, 2015-2022 (USD Million)
Table 121 UK: Market Size, By Propellers, 2015-2022 (USD Million)
Table 122 UK: Marine Propeller Market Size, By Application, 2015-2022 (USD Million)
Table 123 Rest of the World: Marine Propeller Market Size, By Type, 2015-2022 (USD Million)
Table 124 Rest of the World: Marine Propeller Market Size, By Propellers, 2015-2022 (USD Million)
Table 125 Rest of the World: Marine Propeller Market Size, By Thrusters, 2015-2022 (USD Million)
Table 126 Rest of the World: Marine Propellers Market Size, By Material, 2015-2022 (USD Million)
Table 127 Rest of the World: Marine Propeller Market Size, By Number of Blades, 2015-2022 (USD Million)
Table 128 Rest of the World: Market Size, By Application, 2015-2022 (USD Million)
Table 129 Rest of the World: Market Size, By End User, 2015-2022 (USD Million)
Table 130 Rest of the World: Market Size, By Country, 2015-2022 (USD Million)
Table 131 Brazil: Market Size, By Type, 2015-2022 (USD Million)
Table 132 Brazil: Market Size, By Propellers, 2015-2022 (USD Million)
Table 133 Brazil: Market Size, By Application, 2015-2022 (USD Million)
Table 134 Others: Market Size, By Type, 2015-2022 (USD Million)
Table 135 Others: Marine Propellers Market Size, By Propellers, 2015-2022 (USD Million)
Table 136 Others: Marine Propellers Market Size, By Application, 2015-2022 (USD Million)
Table 137 Brand Analysis: Marine Propellers Market
Table 138 Contracts (2011-2017)
Table 139 New Product Launches (2014-2017)
Table 140 Agreements, Expansions, Acquisitions, and Investments (2013-2017)
List of Figures (55 Figures)
Figure 1 Report Flow
Figure 2 Marine Propellers Market: Research Design
Figure 3 Breakdown of Primary Interviews: By Company Type, Designation & Region
Figure 4 Bottom-Up Approach
Figure 5 Top-Down Approach
Figure 6 Data Triangulation
Figure 7 Based on Subtype, the Fixed Pitch Propeller Subsegment is Anticipated to Lead the Propeller Segment From 2017 to 2022
Figure 8 Based on Number of Blades, the 4-Blade Segment is Projected to Lead the Marine Propellers Market in 2017
Figure 9 Based on Material, the Nickel-Aluminium Bronze Segment is Anticipated to Lead the Marine Propellers Market From 2017 to 2022
Figure 10 Based on Application, the Merchant Ships Segment is Projected to Lead the Marine Propellers Market in 2017
Figure 11 The Asia Region is Anticipated to Lead the Marine Propellers Market From 2017 to 2022
Figure 12 Growth in International Seaborne Trade is Anticipated to Drive the Marine Propellers Market During the Forecast Period
Figure 13 The Propellers Segment is Anticipated to Lead the Marine Propellers Market During the Forecast Period
Figure 14 Based on Application, the Merchant Ships Segment is Estimated to Account for the Largest Share of the Asia Marine Propellers Market in 2017
Figure 15 The Inboard Propulsion Segment is Projected to Lead the Marine Propellers Market From 2017 to 2022
Figure 16 The OEM Segment is Projected to Lead the Marine Propellers Market From 2017 to 2022
Figure 17 Growth in International Seaborne Trade Expected to Drive the Marine Propellers Market
Figure 18 Global Seaborne Trade, 2008-2016 (Million Tons)
Figure 19 Merchant Ship Fleet Size, 2008-2016 (Units)
Figure 20 Global Ocean Cruise Passengers (Millions)
Figure 21 Emission Control Area (ECA)
Figure 22 Average Annual Deaths and Injuries Caused By Propellers in the US Between 2012 and 2016
Figure 23 Marine Propellers Market Ecosystem
Figure 24 Technological Trends in the Marine Propellers Market
Figure 25 Strategic Benchmarking: Caterpillar is the Key Player That has Adopted Organic and Inorganic Growth Strategies to Strengthen Its Position in the Marine Propellers Market
Figure 26 The Propellers Segment of the Marine Propellers Market is Projected to Grow at the Highest CAGR During the Forecast Period
Figure 27 The Nickel-Aluminium Bronze Segment of the Marine Propellers Market is Projected to Grow at the Highest CAGR During the Forecast Period
Figure 28 The Recreational Boats Segment of the Marine Propellers Market is Projected to Grow at the Highest CAGR During the Forecast Period
Figure 29 The 5-Blade Segment of the Marine Propellers Market is Projected to Grow at the Highest CAGR During the Forecast Period
Figure 30 The OEM Segment of the Marine Propellers Market is Projected to Grow at the Highest CAGR From 2017 to 2022
Figure 31 Sterndrive Segment of the Marine Propellers Market is Projected to Grow at the Highest CAGR During the Forecast Period
Figure 32 Asia is Estimated to Account for the Largest Share of the Marine Propellers Market in 2017
Figure 33 Asia Marine Propellers Market Snapshot
Figure 34 North America Marine Propellers Market Snapshot
Figure 35 Europe Marine Propellers Market Snapshot
Figure 36 Companies Adopted Contracts and New Product Launches as Key Growth Strategies From 2011 to 2017
Figure 37 Ranking of Key Players in the Marine Propellers Market in 2016
Figure 38 Key Developments Undertaken By Leading Market Players in the Marine Propellers Market (2013-2017)
Figure 39 Regional Presence of Leading Companies in the Marine Propellers Market
Figure 40 Contracts and New Product Launches Accounted for Major Shares of All Growth Strategies Adopted By Key Players Between November 2011 and October 2017
Figure 41 Regional Revenue Mix of Top 5 Market Players
Figure 42 Financial Highlights of Major Players in the Marine Propellers Market
Figure 43 Rolls-Royce: Company Snapshot
Figure 44 Rolls-Royce: SWOT Analysis
Figure 45 Wartsila: Company Snapshot
Figure 46 Wartsila: SWOT Analysis
Figure 47 Hyundai Heavy Industries: Company Snapshot
Figure 48 Hyundai Heavy Industries: SWOT Analysis
Figure 49 Man SE: Company Snapshot
Figure 50 Man SE: SWOT Analysis
Figure 51 Caterpillar: Company Snapshot
Figure 52 Caterpillar: SWOT Analysis
Figure 53 Kawasaki Heavy Industries: Company Snapshot
Figure 54 Brunswick: Company Snapshot
Figure 55 Volvo: Company Snapshot


Growth opportunities and latent adjacency in Marine Propeller Market
Relatively new patent is registered with Korea. We would appreciate a list of countries supplying marine propellers. We would like to know the top four or five countries in tonnage.