Microgrid as a Service (MaaS) Market by Grid Type (Grid Connected, and Remote or Islanded), Service Type (Engineering & Design, SAAS, Monitoring & Control, and Operation & Maintenance), Vertical, and Geography - Global Forecast to 2035


Microgrid as a Service (MaaS) Market Summary
The global Microgrid as a Service (MaaS) Market is gaining significant momentum as organizations seek reliable, flexible, and low-carbon energy infrastructure without assuming the full upfront capital burden of designing, financing, operating, and maintaining a microgrid. The market is estimated at approximately USD 2–3 billion in 2025 and is projected to reach around USD 8–9 billion by 2035, registering a CAGR of 14%–17% during the forecast period.
Microgrid as a Service enables customers to access distributed energy infrastructure through service-based commercial models rather than purchasing and managing every component independently. These solutions can include engineering and design, energy management software, monitoring and control, operation and maintenance, renewable generation, battery energy storage, and financing or performance-based arrangements. The model is increasingly attractive to commercial and industrial facilities, utilities, data centers, healthcare facilities, campuses, military installations, and remote communities seeking greater energy resilience and predictable operating costs.
The growth of the Microgrid as a Service (MaaS) Market is being accelerated by aging grid infrastructure, extreme weather events, rising electricity costs, renewable-energy integration, increasing electrification, and the need for uninterrupted power. AI, IoT, cloud computing, automation, advanced energy management systems, and digital twins are further transforming microgrids from relatively simple distributed-energy systems into intelligent, software-controlled energy platforms. Modern microgrid platforms can monitor distributed energy resources, forecast demand, optimize generation and storage, and automatically adjust operations according to energy prices and site requirements.
Key Market Trends & Insights
The Microgrid as a Service (MaaS) Market is moving toward integrated energy-as-a-service models in which customers pay for energy infrastructure availability, performance, resilience, or energy outcomes instead of making large upfront investments. This model is particularly compelling for organizations that need energy modernization but prefer to preserve capital for core business activities.
North America is expected to remain the leading regional market, supported by advanced energy infrastructure, grid-resilience requirements, commercial and industrial demand, and the presence of established microgrid developers and technology providers. Asia Pacific is anticipated to be the fastest-growing region, supported by rapid industrialization, urbanization, increasing electricity demand, renewable-energy deployment, and government efforts to improve energy access and grid resilience.
Software as a Service, monitoring and control, and operation and maintenance services are becoming increasingly important within the MaaS business model. AI-powered forecasting, automated energy optimization, IoT-enabled asset monitoring, and cloud-based energy management are enabling service providers to manage increasingly complex combinations of solar PV, batteries, generators, fuel cells, electric vehicles, and controllable loads.
Another important trend is the expansion of microgrids into data centers and other high-availability facilities. Growing digital infrastructure and AI workloads are increasing electricity requirements and making power reliability a strategic priority. MaaS providers can combine distributed generation, battery storage, intelligent controls, and energy optimization to support resilient power architectures.
Market Size & Forecast
-
Base year market size: Approximately USD 2–3 billion in 2025
-
Forecast value by 2035: Approximately USD 8–9 billion
-
CAGR: Approximately 14%–17% from 2025 to 2035
-
Growth factors: Grid modernization, renewable-energy integration, energy resilience, battery storage deployment, AI-enabled energy management, IoT connectivity, electrification, and increasing demand for capital-light energy infrastructure models.
The market's growth is supported by a fundamental change in how organizations procure energy infrastructure. Instead of purchasing individual generators, solar systems, batteries, controllers, and software, customers can increasingly contract with specialized providers to design, finance, operate, and optimize an integrated microgrid. This shifts technical and operational responsibility toward the service provider and creates recurring revenue opportunities across the MaaS value chain.
Microgrid as a Service (MaaS) Market Top 10 key takeaway
-
The global Microgrid as a Service (MaaS) Market is estimated at USD 2–3 billion in 2025.
-
The market is projected to reach approximately USD 8–9 billion by 2035.
-
The market is expected to expand at a 14%–17% CAGR during 2025–2035.
-
North America is expected to maintain its position as the leading regional market.
-
Asia Pacific is projected to register the fastest growth during the forecast period.
-
Software-based energy management and monitoring capabilities are becoming central to MaaS offerings.
-
AI and machine learning are improving energy forecasting, asset optimization, and automated control.
-
Battery energy storage is becoming an increasingly important component of microgrid service models.
-
Data centers, healthcare facilities, industrial sites, campuses, and critical infrastructure represent major growth opportunities.
-
Financing, operation, and performance-based service models are reducing barriers to microgrid adoption.
Product Insights
Within the Microgrid as a Service (MaaS) Market, service-oriented software and energy management platforms represent a strategically important product category because they provide the intelligence needed to coordinate distributed energy resources. While physical infrastructure such as solar PV systems, batteries, generators, power conversion equipment, and switchgear remains essential, the value of MaaS increasingly comes from the software and operational services that coordinate these assets.
Energy management software can collect information from solar generation, battery systems, utility connections, generators, smart meters, building-management systems, and controllable loads. This data can then be analyzed to determine when energy should be generated, stored, consumed, or exported. Schneider Electric, for example, describes its EcoStruxure Microgrid Advisor as a cloud-based software platform that collects information, forecasts conditions, and automatically optimizes distributed energy resources.
Monitoring and control services are another major product category. These services allow providers to remotely monitor voltage, frequency, battery state of charge, generation, consumption, equipment health, and other operational parameters. Advanced platforms can identify abnormal conditions and initiate automated responses, reducing the need for constant manual intervention.
Emerging MaaS product categories include AI-enabled optimization platforms, virtual power plant integration, EV charging microgrids, hydrogen-enabled microgrids, mobile microgrids, and hybrid renewable-energy systems. The integration of battery storage with solar PV and intelligent controls is particularly important because it enables customers to improve renewable-energy utilization while maintaining power availability during grid disruptions.
Technology / Component Insights
The technology landscape of the Microgrid as a Service (MaaS) Market is evolving rapidly through the convergence of AI, IoT, cloud computing, automation, energy storage, advanced power electronics, and distributed energy resource management systems. These technologies are enabling microgrids to operate as intelligent energy ecosystems rather than standalone backup-power installations.
IoT sensors provide continuous visibility into equipment and energy flows. Sensors installed on batteries, inverters, generators, transformers, switchgear, HVAC systems, and industrial equipment can provide real-time operational information. This information can be transmitted to cloud or edge platforms for analysis and automated decision-making.
AI and machine learning are becoming particularly valuable for forecasting electricity demand, renewable generation, equipment performance, and energy prices. AI algorithms can identify consumption patterns and recommend optimal charging and discharging schedules for battery storage. Over time, this capability can improve energy efficiency and reduce dependence on expensive grid electricity.
Cloud computing allows service providers to manage geographically distributed microgrids from centralized platforms, while edge computing supports applications requiring rapid local decisions. Automated controls can respond to outages, changes in demand, electricity-price fluctuations, and renewable-energy availability without requiring human intervention.
Future innovation is likely to include generative AI interfaces for energy management, autonomous microgrid controllers, digital twins, predictive maintenance, cybersecurity analytics, and advanced forecasting. The combination of AI with real-time IoT data could ultimately enable microgrids to continuously optimize themselves against cost, reliability, emissions, and resilience objectives.
Application Insights
Commercial and industrial facilities represent a leading application segment within the Microgrid as a Service (MaaS) Market. These facilities often have high electricity consumption and significant financial consequences associated with outages. Manufacturing plants, warehouses, logistics centers, data centers, hospitals, universities, airports, and commercial buildings can use MaaS to improve power reliability while integrating renewable-energy resources.
Data centers are emerging as an especially attractive application. The expansion of cloud computing, AI infrastructure, and digital services is increasing demand for reliable electricity. A microgrid can combine renewable generation, energy storage, backup generation, and intelligent controls to provide an additional layer of resilience.
Healthcare facilities also offer substantial opportunities because hospitals require continuous electricity for critical equipment and life-support systems. Military installations and emergency-response facilities similarly require resilient energy infrastructure capable of operating independently when the utility grid is unavailable.
Industrial applications are expected to expand as electrification increases and companies seek greater control over energy costs. Microgrids can support industrial processes by coordinating on-site generation and storage while maintaining critical loads during grid interruptions.
Future opportunities will extend to EV fleet charging, ports, airports, mining operations, remote communities, agricultural facilities, telecommunications infrastructure, and multi-site commercial networks. Schneider Electric notes that microgrids can serve applications ranging from municipal facilities and airports to military bases and remote areas.
Regional Insights
North America is expected to remain the dominant region in the Microgrid as a Service (MaaS) Market. The United States has a mature ecosystem of energy-service providers, technology companies, utilities, microgrid developers, and distributed-energy operators. The region's aging grid infrastructure, severe weather events, demand for energy resilience, and increasing deployment of distributed energy resources are creating strong demand for service-based microgrid models. Market research also identifies North America as the largest regional market.
Europe represents a technologically advanced market supported by renewable-energy targets, energy-security concerns, electrification, sustainability objectives, and distributed-generation investments. European customers are increasingly interested in integrating solar PV, batteries, demand response, and intelligent energy-management platforms.
Asia Pacific is projected to experience the fastest growth. China, Japan, India, South Korea, Australia, and Southeast Asian economies are expanding renewable generation, industrial capacity, data infrastructure, and distributed energy systems. Rising electricity demand and the need to improve energy access in remote locations create additional opportunities for MaaS providers.
-
North America: Leading market driven by resilience, distributed energy investment, and established service providers.
-
Europe: Strong adoption supported by renewable integration and energy-security priorities.
-
Asia Pacific: Fastest-growing region due to industrialization, urbanization, and expanding renewable infrastructure.
-
Latin America: Growing opportunities in remote power, commercial facilities, mining, and renewable integration.
-
Middle East & Africa: Increasing potential for solar-plus-storage microgrids and energy access applications.
Country-Specific Market Trends
China is expected to be one of the largest and fastest-expanding markets in Asia Pacific, supported by industrial modernization, renewable-energy deployment, distributed power systems, and smart-energy initiatives. The Chinese MaaS market could grow at approximately 17%–19% CAGR through 2035 as industrial facilities and infrastructure operators seek greater energy flexibility.
Japan is expected to grow at approximately 12%–14% CAGR, supported by resilience requirements, advanced energy-management technology, renewable integration, and the country's emphasis on distributed power systems. Microgrids are particularly relevant for critical facilities and communities seeking greater protection against natural disasters.
In North America, the United States is projected to expand at approximately 14%–16% CAGR, supported by grid modernization, resilience programs, commercial and industrial adoption, and increasing deployment of distributed energy resources. Canada could record approximately 12%–14% CAGR, driven by clean-energy investments, remote-community applications, and industrial demand. Mexico could register approximately 14%–16% CAGR, supported by manufacturing growth, nearshoring, renewable energy, and the need for reliable electricity in industrial zones.
In Europe, Germany is expected to grow at approximately 12%–14% CAGR, reflecting its industrial base, renewable-energy transition, and distributed-energy investments. France could expand at approximately 11%–13% CAGR, supported by energy modernization, commercial applications, industrial facilities, and increasing interest in resilient low-carbon power systems.
-
China: Approximately 17%–19% CAGR, supported by industrial and renewable-energy expansion.
-
Japan: Approximately 12%–14% CAGR, driven by resilience and advanced energy management.
-
United States: Approximately 14%–16% CAGR, supported by grid modernization and commercial adoption.
-
Germany: Approximately 12%–14% CAGR, driven by industrial digitalization and renewable integration.
-
France: Approximately 11%–13% CAGR, supported by energy transition and resilient infrastructure.
Key Microgrid as a Service (MaaS) Market Company Insights
The competitive landscape includes established electrical-equipment manufacturers, industrial automation companies, utilities, energy-service providers, and specialized microgrid developers. Key companies include Siemens, ABB, Eaton, GE Vernova, Schneider Electric, NRG Energy, Caterpillar, Duke Energy, NextEra Energy, and Aggreko. Industry sources consistently identify several of these companies among the leading MaaS participants.
Siemens focuses on intelligent microgrid controls, automation, distributed energy management, and digitalization. Schneider Electric combines microgrid hardware, energy management software, automation, and Energy as a Service models. Its EaaS offering can cover planning, design, construction, operation, and maintenance, helping customers shift capital and operational responsibilities to a service provider.
ABB emphasizes electrification, automation, digital control, and distributed energy technologies. Eaton combines power management, electrical infrastructure, distributed energy, and microgrid technologies. GE Vernova brings grid, power-generation, renewable-energy, and digital capabilities to the market.
Specialized providers and energy companies are also expanding the market by developing, owning, and operating microgrid assets. The service-provider model is particularly attractive because it can combine engineering, financing, operation, maintenance, and energy optimization under a single contractual framework. Recent market coverage identifies companies such as Scale Microgrids among participants in this evolving business model.
-
Companies are increasingly integrating AI and predictive analytics into energy-management platforms.
-
Hardware providers are expanding toward recurring software and service revenues.
-
Energy-as-a-Service models are reducing upfront capital requirements for customers.
-
Strategic partnerships are combining renewable generation, storage, software, and financing.
-
Vendors are targeting high-value applications such as data centers, hospitals, industry, and critical infrastructure.
Recent Developments
The MaaS market has seen increased investment and consolidation as providers seek to expand their distributed-energy asset portfolios. In January 2025, EQT acquired Scale Microgrids, with the transaction aimed at accelerating the company's growth and expanding its microgrid-as-a-service and distributed-energy platform. Scale Microgrids develops and operates systems incorporating solar, battery storage, fuel cells, and combined heat and power for commercial, industrial, data center, EV fleet, municipal, university, hospital, and agricultural customers.
Technology companies are also strengthening cloud-based microgrid management. Schneider Electric's EcoStruxure Microgrid Advisor, for example, provides cloud-based forecasting and automated optimization of distributed energy resources, demonstrating the broader transition toward software-defined microgrid operations.
Another important development is the expansion of microgrid applications into critical infrastructure and high-density digital facilities. Growing requirements for reliable power, combined with renewable-energy targets and battery-storage deployment, are encouraging service providers to develop integrated microgrid packages rather than standalone generation systems.
Market Segmentation
The Microgrid as a Service (MaaS) Market can be segmented by service type, grid type, application or vertical, technology/component, and region. By service type, the market includes engineering and design services, Software as a Service, monitoring and control services, and operation and maintenance services. Engineering and design services cover system planning, feasibility studies, and customization, while SaaS platforms provide energy management, analytics, forecasting, and integration capabilities. Monitoring and control services enable real-time visibility and remote operation, whereas O&M services support long-term asset performance.
By grid type, the market includes grid-connected and remote or islanded microgrids. Grid-connected systems are increasingly deployed by commercial and industrial customers seeking energy cost optimization and resilience, while islanded systems remain important for remote communities, military facilities, mining operations, and critical infrastructure.
By application, the market includes utilities, commercial and residential facilities, industrial facilities, military installations, healthcare, data centers, campuses, and other critical infrastructure. By region, the market spans North America, Europe, Asia Pacific, Latin America, and the Middle East & Africa. Current market research also uses service type, grid type, and vertical as core segmentation dimensions.
-
By Service Type: SaaS, monitoring and control, engineering and design, and O&M services.
-
By Grid Type: Grid-connected and remote/islanded microgrids.
-
By Application: Commercial, industrial, utilities, military, healthcare, data centers, and other critical facilities.
-
By Technology: Solar PV, battery storage, generators, fuel cells, power electronics, IoT, AI, and energy-management software.
-
By Region: North America, Europe, Asia Pacific, Latin America, and Middle East & Africa.
The Microgrid as a Service (MaaS) Market is transitioning from a specialized distributed-energy model into an important component of the modern energy ecosystem. The market is expected to expand from approximately USD 2–3 billion in 2025 to USD 8–9 billion by 2035, supported by a combination of grid resilience requirements, renewable-energy deployment, electrification, battery storage, energy-price pressures, and demand for flexible financing models.
AI will increasingly determine how MaaS platforms operate. Intelligent forecasting can anticipate energy demand and renewable generation, while machine learning can identify equipment abnormalities and optimize battery utilization. IoT connectivity will provide the real-time data required for these algorithms, while cloud and edge computing will allow service providers to coordinate assets across multiple locations.
The strategic importance of MaaS extends beyond electricity reliability. Businesses can use microgrids to manage energy costs, integrate renewable power, reduce emissions, protect critical operations, and improve resilience against grid disruptions. The service-based model also makes advanced energy infrastructure accessible to organizations that may not have the technical resources or capital required to design and operate a microgrid independently.
Through 2035, the strongest opportunities are expected in data centers, industrial facilities, healthcare, military installations, campuses, remote communities, EV charging infrastructure, and other energy-intensive or mission-critical applications. As AI, automation, storage, and distributed renewable energy become more deeply integrated, MaaS providers are likely to evolve from equipment suppliers into long-term energy optimization partners.
FAQs - Microgrid as a Service (MaaS) Market
1. What is the market size of the Microgrid as a Service (MaaS) Market?
The global Microgrid as a Service (MaaS) Market is estimated at approximately USD 2–3 billion in 2025 and is projected to reach around USD 8–9 billion by 2035. A recent 2025–2034 estimate places the market at USD 2.2 billion in 2025 and USD 8.5 billion by 2034.
2. What is the growth rate of the Microgrid as a Service (MaaS) Market?
The market is expected to grow at approximately 14%–17% CAGR from 2025 to 2035. Recent market estimates indicate a CAGR of approximately 16.1% for the 2025–2034 period.
3. What are the key drivers of the Microgrid as a Service (MaaS) Market?
Major drivers include grid reliability concerns, extreme weather events, aging electrical infrastructure, renewable-energy integration, battery-storage deployment, rising electricity costs, electrification, AI-enabled energy management, IoT connectivity, and demand for capital-light energy infrastructure.
4. Which region leads the Microgrid as a Service (MaaS) Market?
North America is expected to remain the leading regional market, supported by grid modernization, energy resilience requirements, advanced distributed-energy infrastructure, and established MaaS providers. Asia Pacific is expected to be the fastest-growing region.
5. Who are the key companies in the Microgrid as a Service (MaaS) Market?
Major companies include Siemens, ABB, Eaton, GE Vernova, Schneider Electric, NRG Energy, Caterpillar, Duke Energy, NextEra Energy, and Aggreko. These companies are expanding their portfolios through microgrid controls, distributed energy resources, energy management software, financing models, and operation and maintenance services.
 Exclusive indicates content/data unique to MarketsandMarkets and not available with any competitors.
Table of Contents
1 Introduction (Page No. - 14)
1.1 Objectives of the Study
1.2 Market Definition
1.3 Study Scope
1.3.1 Markets Covered
1.3.2 Years Considered for the Study
1.4 Currency
1.5 Limitations
1.6 Stakeholders
2 Research Methodology (Page No. - 18)
2.1 Research Data
2.1.1 Secondary Data
2.1.1.1 List of Major Secondary Sources
2.1.1.2 Key Data From Secondary Sources
2.1.2 Primary Data
2.1.2.1 Primary Interviews With Experts
2.1.2.2 Breakdown of Primaries
2.1.2.3 Key Data From Primary Sources
2.1.2.4 Key Industry Insights
2.2 Market Size Estimation
2.3 Market Breakdown & Data Triangulation
2.4 Research Assumptions
3 Executive Summary (Page No. - 27)
4 Premium Insights (Page No. - 33)
4.1 Attractive Opportunities for the Global Microgrid as a Service Market
4.2 Market, By Grid Type
4.3 Market, By Vertical
4.4 Market, By Service Type
4.5 Market, By Geography
4.6 Life Cycle Analysis, By Region
5 Market Overview (Page No. - 37)
5.1 Introduction
5.2 Market Segmentation
5.2.1 By Grid Type
5.2.2 By Service Type
5.2.3 By Vertical
5.2.4 By Geography
5.3 Market Dynamics
5.3.1 Drivers
5.3.1.1 Reduction in Operational Costs and Requirement of Negligible Upfront Investments By MaaS Users
5.3.1.2 Rising Demand for Msaas From Hospitals, Defense, and Remote Areas
5.3.1.3 Availability of Flexi-Pay Options Boosts the Adoption of MaaS Among Low-Income Residential End Users
5.3.1.4 High Investments By Governments in Microgrid Infrastructure
5.3.1.5 Levelized Cost of Electricity (LCoE) for Wind and Solar Pv Systems in the Last Few Years
5.3.2 Restraints
5.3.2.1 Dominance of Customer-Owned Microgrids
5.3.2.2 Policy, Regulations, and Standards
5.3.3 Opportunities
5.3.3.1 Increasing Use of Behind-The-Meter Microgrid Virtual Batteries for Energy Storage
5.3.3.2 Rural Electrification in APAC and Africa
5.3.4 Challenges
5.3.4.1 Lack of Awareness and Training Programs for End-Users
5.3.4.2 Complexities in Planning and Design of Large-Sized Microgrids
6 Industry Trends (Page No. - 46)
6.1 Value Chain Analysis
6.2 Porter’s Five Forces Analysis, 2016
6.2.1 Bargaining Power of Suppliers
6.2.2 Bargaining Power of Buyers
6.2.3 Threat of New Entrants
6.2.4 Threat of Substitutes
6.2.5 Intensity of Competitive Rivalry
7 Market, By Grid Type (Page No. - 54)
7.1 Introduction
7.2 Grid-Connected Type
7.3 Remote/Islanded Type
8 Market, By Vertical (Page No. - 61)
8.1 Introduction
8.2 Government & Education
8.3 Residential & Commercial
8.4 Industrial
8.5 Military
8.6 Utility
9 Market, By Service Type (Page No. - 74)
9.1 Introduction
9.2 Engineering & Design Service
9.3 Software as a Service
9.4 Monitoring & Control Service
9.5 Operation & Maintenance Service
10 Market, By Geography (Page No. - 85)
10.1 Introduction
10.2 Americas
10.2.1 North America
10.2.1.1 U.S.
10.2.1.2 Rest of North America
10.2.2 Latin America
10.2.3 Brazil
10.2.4 Rest of Latin America
10.3 Europe
10.3.1 Western Europe
10.3.1.1 Germany
10.3.1.2 France
10.3.1.3 U.K.
10.3.1.4 Rest of Western Europe
10.3.2 Eastern Europe
10.3.2.1 Russia
10.3.2.2 Rest of Eastern Europe
10.3.3 Rest of Europe
10.4 Asia-Pacific
10.4.1 China
10.4.2 India
10.4.3 Australia
10.4.4 Rest of APAC
10.5 Rest of the World
10.5.1 Middle East
10.5.2 Africa
11 Competitive Landscape (Page No. - 114)
11.1 Introduction
11.2 Ranking of Market Players, 2015
11.3 Competitive Situation and Trends
11.3.1 Partnerships/Collaborations/Agreements
11.3.2 New Product Launches
11.3.3 Expansions
12 Company Profiles (Page No. - 120)
(Company at A Glance, Recent Financials, Products & Services, Strategies & Insights, & Recent Developments)*
12.1 Introduction
12.2 ABB Ltd.
12.3 General Electric
12.4 Siemens AG
12.5 Eaton Corporation PLC
12.6 Exelon Corporation
12.7 NRG Energy, Inc.
12.8 Pareto Energy
12.9 Spirae, Inc.
12.10 Anbaric Transmission, LLC
12.11 Solarcity Corporation
12.12 Green Energy Corp.
*Details on Company at A Glance, Recent Financials, Products & Services, Strategies & Insights, & Recent Developments Might Not Be Captured in Case of Unlisted Companies.
13 Appendix (Page No. - 143)
13.1 Insights of Industry Experts
13.2 Discussion Guide
13.3 Knowledge Store: Marketsandmarkets’ Subscription Portal
13.4 Introducing RT: Real-Time Market Intelligence
13.5 Available Customizations
13.6 Related Reports
13.7 Author Details
List of Tables (76 Tables)
Table 1 Microgrid as a Service Market Segmentation, By Grid Type
Table 2 Market Segmentation, By Service Type
Table 3 Market Segmentation, By Vertical Type
Table 4 Functions & Stakeholders in MaaS Value Chain
Table 5 Market: Porter’s Five Forces Analysis
Table 6 Market, By Grid Type, 2013–2022 (USD Million)
Table 7 Market for Grid-Connected Microgrids, By Region, 2013–2022 (USD Million)
Table 8 Market in Americas for Grid-Connected Microgrids, By Region, 2013–2022 (USD Million)
Table 9 Market for Grid-Connected Microgrids, By Vertical, 2013–2022 (USD Million)
Table 10 Market for Remote/Islavded Microgrids, By Region, 2013–2022 (USD Million)
Table 11 Market in Americas for Remote/Islanded Microgrids, By Region, 2013–2022 (USD Million)
Table 12 Market for Remote/Islanded Microgrids, By Vertical, 2013–2022 (USD Million)
Table 13 Market, By Vertical, 2013–2022 (USD Million)
Table 14 Market for Government & Education Vertical, By Region, 2013–2022 (USD Million)
Table 15 Market in Americas for Government & Education Vertical, By Region, 2013–2022 (USD Million)
Table 16 Market for Government & Education Vertical, By Grid Type, 2013–2022 (USD Million)
Table 17 Market for Residential & Commercial Vertical, By Region, 2013–2022 (USD Million)
Table 18 Market in Americas for Residential & Commercial Vertical, By Region, 2013–2022 (USD Million)
Table 19 Marketfor Residential & Commercial Vertical, By Grid Type, 2013–2022 (USD Million)
Table 20 Market for Industrial Vertical, By Region, 2013–2022 (USD Million)
Table 21 Market in Americas for Industrial Vertical, By Region, 2013–2022 (USD Million)
Table 22 Market for Industrial Vertical, By Grid Type, 2013–2022 (USD Million)
Table 23 Market for Military Vertical, By Region, 2013–2022 (USD Million)
Table 24 Market in Americas for Military Vertical, By Region, 2013–2022 (USD Million)
Table 25 Market for Military Vertical, By Grid Type, 2013–2022 (USD Million)
Table 26 Market for Utility Vertical, By Region, 2013–2022 (USD Million)
Table 27 Market in Americas for Utility Vertical, By Region, 2013–2022 (USD Million)
Table 28 Market for Utility Vertical, By Grid Type, 2013–2022 (USD Million)
Table 29 Market, By Service Type, 2013–2022 (USD Million)
Table 30 Market for Engineering & Design Service Segment, By Region, 2013–2022 (USD Million)
Table 31 Market in Americas for Engineering & Design Service Segment, By Region, 2013–2022 (USD Million)
Table 32 Market in Europe for Engineering & Design Service Segment, By Region, 2013–2022 (USD Million)
Table 33 Market for Software as a Service Segment, By Region, 2013–2022 (USD Million)
Table 34 Market in Americas for Software as a Service Segment, By Region, 2013–2022 (USD Million)
Table 35 Market in Europe for Software as a Service Segment, By Region, 2013–2022 (USD Million)
Table 36 Microgrid as a Service (MaaS) Market for Monitoring & Control Service Segment, By Region, 2013–2022 (USD Million)
Table 37 Market in Americas for Monitoring & Control Service Segment, By Region, 2013–2022 (USD Million)
Table 38 Market in Europe for Monitoring & Control Service Segment, By Region, 2013–2022 (USD Million)
Table 39 Market for Operation & Maintenance Service Segment, By Region, 2013–2022 (USD Million)
Table 40 Market in Americas for Operation & Maintenance Service Segment, By Region, 2013–2022 (USD Million)
Table 41 Microgrid as a Service (MaaS) Market in Europe for Operation & Maintenance Service Segment, By Region, 2013–2022 (USD Million)
Table 42 Market, By Region, 2013–2022 (USD Million)
Table 43 Market in Americas, By Region, 2013–2022 (USD Million)
Table 44 Market in Americas, By Grid Type, 2013–2022 (USD Million)
Table 45 Grid-Connected Microgrid as a Service Market in Americas, By Region, 2013–2022 (USD Million)
Table 46 Remote/Islanded-Microgrid as a Service Market in Americas, By Region, 2013–2022 (USD Million)
Table 47 Market in Americas, By Vertical, 2013–2022 (USD Million)
Table 48 Market in Americas, By Service Type, 2013–2022 (USD Million)
Table 49 Market in North America, By Vertical, 2013–2022 (USD Million)
Table 50 Market in North America, By Service Type, 2013–2022 (USD Million)
Table 51 Market in North America, By Country, 2013–2022 (USD Million)
Table 52 Market in Latin America, By Vertical, 2013–2022 (USD Million)
Table 53 Market in Latin America, By Service Type, 2013–2022 (USD Million)
Table 54 Market in Latin America, By Country, 2013–2022 (USD Million)
Table 55 Market in Europe, By Region, 2013–2022 (USD Million)
Table 56 Market in Europe, By Grid Type, 2013–2022 (USD Million)
Table 57 Market in Europe, By Vertical, 2013–2022 (USD Million)
Table 58 Market in Europe, By Service Type, 2013–2022 (USD Million)
Table 59 Market in Western Europe, By Country, 2013–2022 (USD Million)
Table 60 Market in Western Europe, By Vertical, 2013–2022 (USD Million)
Table 61 Market in Eastern Europe, By Country, 2013–2022 (USD Million)
Table 62 Market in Eastern Europe, By Vertical, 2013–2022 (USD Million)
Table 63 Market in Rest of Europe, By Vertical, 2013–2022 (USD Million)
Table 64 Market in APAC, By Grid Type, 2013–2022 (USD Million)
Table 65 Market in APAC, By Vertical, 2013–2022 (USD Million)
Table 66 Market in APAC, By Service Type, 2013–2022 (USD Million)
Table 67 Market in APAC, By Country, 2013–2022 (USD Million)
Table 68 Market in RoW, By Region, 2013–2022 (USD Million)
Table 69 Market in RoW, By Grid Type, 2013–2022 (USD Million)
Table 70 Market in RoW, By Vertical, 2013–2022 (USD Million)
Table 71 Market in RoW, By Service Type, 2013–2022 (USD Million)
Table 72 Ranking in the MaaS Market, 2015
Table 73 Partnerships/Collaborations/Agreements, 2013–2016
Table 74 New Product Development in the MaaS Market, 2013–2016
Table 75 Expansions in the MaaS Market, 2013–2016
Table 76 Mergers & Acquisitions in the MaaS Market, 2013–2016
List of Figures (68 Figures)
Figure 1 Segmentation of the Microgrid as a Service Market
Figure 2 Market: Research Design
Figure 3 Market Size Estimation Methodology: Bottom-Up Approach
Figure 4 Market Size Estimation Methodology: Top-Down Approach
Figure 5 Data Triangulation
Figure 6 Reduction in Operational Costs and Negligible Upfront Investments Expected to Propel the Market Growth Between 2016 and 2022
Figure 7 Market for Remote/Islanded Microgrids Likely to Grow at A Higher Rate During the Forecast Period
Figure 8 Market for Software as a Service Segment Expected to Grow at the Highest Rate During the Forecast Period
Figure 9 Market for Industrial Vertical Expected to Grow at the Highest Rate During the Forecast Period
Figure 10 Americas Would Account for the Largest Market Share in 2016
Figure 11 Increasing Opportunities in Residential & Commercial Vertical Expected to Drive the Global Market During the Forecast Period
Figure 12 Market for Remote/Islandedmicrogrids to Grow at A Higher Rate During the Forecast Period
Figure 13 Residential & Commercial Vertical to Hold the Largest Size of the Global Market During the Forecast Period
Figure 14 Software as a Service Type Expected to Lead the Market During the Forecast Period
Figure 15 Americas to Lead the Market During the Forecast Period
Figure 16 China to Hold the Largest Share of the Market in APAC in 2016
Figure 17 Market in APAC to Be in Its Growth Phase During the Forecast Period
Figure 18 Market, By Geography
Figure 19 Market Dynamics
Figure 20 Microgrids Installed Over the Years By ABB Ltd.
Figure 21 Levelized Cost of Electricity (LCoE) for Wind & Solar Pv Systems (2009 — 2014)
Figure 22 Microgrid as a Service (MaaS) Market: Value Chain Analysis
Figure 23 Porter’s Five Forces Analysis for the Market, 2016
Figure 24 Market: Porter’s Five Forces Analysis
Figure 25 Medium Impact of the Bargaining Power of Suppliers on the MaaS Market, 2016
Figure 26 Medium Impact of the Bargaining Power of Buyers on the MaaS Market, 2016
Figure 27 Low Impact of the Threat of New Entrants on the MaaS Market, 2016
Figure 28 Medium Impact of the Threat of Substitutes on the MaaS Market, 2016
Figure 29 High Impact of the Intensity of Competitive Rivalry on the MaaS Market, 2016
Figure 30 Market, By Grid Type
Figure 31 Asia-Pacific Expected to Exhibit the Highest Growth for Grid-Connected Microgrids During the Forecast Period
Figure 32 Market for Remote/Islanded Microgrids in Latin America Expected to Grow at the Highest Rate During the Forecast Period
Figure 33 Market for Remote/Islanded Microgrids Expected to Grow at the Highest Rate Between During the Forecast Period
Figure 34 Market Segmentation: By Vertical
Figure 35 Market for Industrial Vertical Expected to Grow at the Highest Rate During the Forecast Period
Figure 36 Market in Asia-Pacific for Government & Education Vertical to Grow at the Highest Rate During the Forecast Period
Figure 37 Market for Remote/Islanded Microgrids for Residential & Commercial Vertical to Grow at the Highest Rate During the Forecast Period
Figure 38 Americas Expected to Hold the Largest Market Size Microgrid as a Service for Military Vertical By 2022
Figure 39 Market, By Service Type
Figure 40 Market for Software as a Service Segment Expected to Grow at the Highest Rate During the Forecast Period
Figure 41 Market for Software as a Service Segment in Western Europe Expected to Hold the Largest Market Size During the Forecast Period
Figure 42 Market in Asia-Pacific for Operation & Maintenance Service Segment Expected to Grow at the Highest Rate During the Forecast Period
Figure 43 Microgrid as a Service Market in Asia-Pacific is Expected to Grow at the Highestrate Microgrid as a Service during the Forecast Period
Figure 44 Market in India Estimated to Grow at the Highest Rate Between 2016 and 2022
Figure 45 Market: By Region
Figure 46 Segmentation: Americas
Figure 47 Snapshot of Market in Americas: Increasing Demand for Reliable and Secure Power Supply is Driving the Market
Figure 48 Segmentation: Europe
Figure 49 Market in Eastern Europe Expected to Grow at the Highest Rate During the Forecast Period
Figure 50 Segmentation: APAC
Figure 51 Snapshot of Market in APAC : Rural Electrification is the Main Factor Driving the Demand for Microgrids in This Region
Figure 52 Segmentation: Rest of the World
Figure 53 Middle East Expected to Hold the Largest Size of the Market in RoW During the Forecast Period
Figure 54 Key Growth Strategies Adopted By the Top Companies, 2013–2016
Figure 55 Market Evaluation Framework: Partnerships/Collaborations/Agreements Fuelled Growth and Innovation Between 2014 and 2016
Figure 56 Battle for Market Share: Partnerships/Collaborations/Agreements Were the Key Strategies
Figure 57 Geographic Revenue Mix of the Major Players in the Market, 2015
Figure 58 ABB Ltd.: Company Snapshot
Figure 59 ABB Ltd.: SWOT Analysis
Figure 60 General Electric: Company Snapshot
Figure 61 General Electric: SWOT Analysis
Figure 62 Siemens AG: Company Snapshot
Figure 63 Siemens AG: SWOT Analysis
Figure 64 Eaton Corporation PLC: Company Snapshot
Figure 65 Eaton Corporation PLC: SWOT Analysis
Figure 66 Exelon Corporation: SWOT Analysis
Figure 67 NRG Energy, Inc.: Company Snapshot
Figure 68 Solarcity Corporation: Company Snapshot
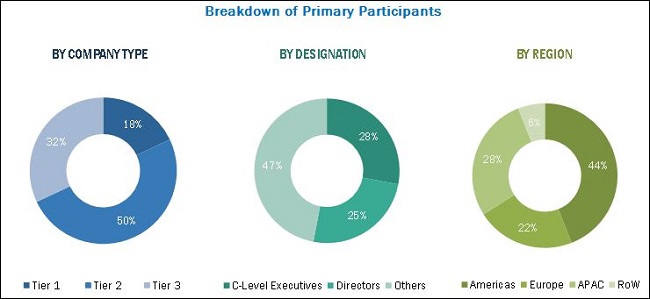
The research methodology used to estimate and forecast the microgrid as a service (MaaS) market begins with obtaining data on key vendor revenues through secondary research from sources such as Microgrid World Forum, Mission Critical Magazine, Microgrid Global Innovation Forum, Global Microgrid Institute, Microgrid Knowledge, government sources (World Bank), corporate filings (such as annual reports, investor presentations, and financial statements), and trade, business, and professional associations, microgrid-related journals, certified publications, articles from recognized authors, directories, and database, among others. The vendor offerings have been taken into consideration to determine the market segmentation. The top-down procedure has been employed to arrive at the overall market size of the global MaaS market. After arriving at the overall market size, the total market has been split into several segments and subsegments, which have then been verified through primary research by conducting extensive interviews with key people such as CEOs, VPs, directors, and executives. This data triangulation and market breakdown procedures have been employed to complete the overall market engineering process and arrive at the exact statistics for all segments and subsegments.
To know about the assumptions considered for the study, download the pdf brochure
The MaaS system ecosystem comprises microgrid hardware vendors such as General Electric (U.S.), and Eaton Corp. PLC (Ireland), among others; solution vendors such as Siemens AG (Germany), Pareto Energy (U.S.), Spirae, Inc. (U.S.), and Green Energy Corporation (U.S), among others; system integrators such as Northern Power Systems Corp. (U.S.), and ABB Ltd. (Switzerland), among others; and end users including residential and commercial, industrial, government and education, and utility.
Target Audience:
- Microgrid service providers
- Microgrid systems integrators and developers
- Transmission system operators
- Energy storage vendors
- Smart grid software vendors
- Solar PV companies
- Government agencies
- Utilities
- Investor community
- Research organizations
Scope of the Report:
The global microgrid as a service market, in this research report, has been segmented on the basis of grid type, vertical, service type, and geography.
Global Microgrid as a Service Market, by Grid Type
- Grid Connected
- Remote/Islanded
Global Microgrid as a Service Market, by Vertical
- Government & Education
- Residential & Commercial
- Industrial
- Military
- Utility
Global Microgrid as a Service Market, by Service Type
- Engineering & Design Service
- Software as a Service (SaaS)
- Monitoring & Control Service
- Operation & Maintenance Service
Global Microgrid as a Service Market, by Geography
- Americas
- Europe
- APAC
- RoW
Available Customizations:
With the given market data, MarketsandMarkets offers customizations according to a company’s specific needs. The following customization options are available for the report:
-
Company Information
- Detailed analysis and profiling of additional market players (up to five)













Growth opportunities and latent adjacency in Microgrid as a Service (MaaS) Market