Mobile Money Market by Transaction mode (Point of Sale, Mobile Apps, QR codes, Internet Payments, SMS, STK/USSD Payments, Direct Carrier Billing, Mobile Banking), Nature of Payment, Application, Type of Payments, Region - Global Forecast to 2024


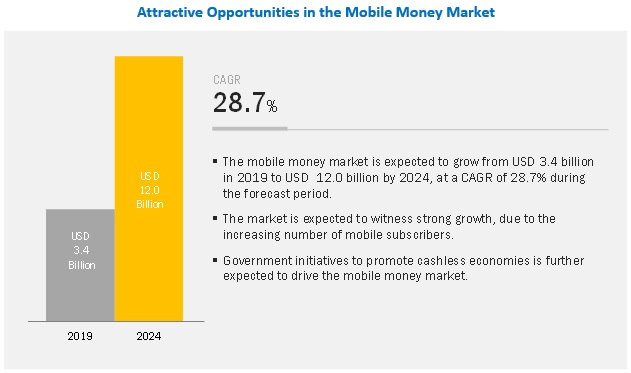
The global Mobile Money Market is projected to grow by 28.7% resulting in a market value of $12.0 billion by 2024. The size value was USD 3.4 billion in 2019. The increasing mobile subscriber base is fueling the growth of mobile money market. With the growing number of mobile phones and increased network coverage in developing countries, companies have come up with new innovative mobile oriented functionalities and solutions to bring the world at the customer’s fingertips. The growing number of mobile subscribers represent an increasing potential for monetary transactions using mobile phones. The number of mobile subscribers around the world is expected to grow significantly in upcoming years.
By application, the money transfers segment to account for the highest market share during the forecast period
By application, the mobile money transfers segment is expected to hold the highest market share during the forecast period. The money transfers segment includes international remittances, cash-in/cash-out, and off-net transfers. These transactions are often used by individuals living in foreign countries or individuals dealing in real estate. High real estate costs and large number of people from developing countries living abroad in developed countries are key reasons for high use of money transfer applications. Several banks and financial institutions have been historically offering money transfer services. As people are adopting to new technologies, many transitions are carried out using mobile phones.
By type of payment, the proximity payments segment to record a higher CAGR during the forecast period
In the mobile money market by type of payment, the proximity payment segment is expected to record a higher CAGR during the forecast period. Proximity payments are carried out using mobile phones and POS devices. Currently, several companies offer applications that enable proximity payments. It is further referred to as in-store payments in case of a retail store or in-location payments with regards to payment through a merchant’s POS terminal.
Proximity payments are specifically enabled for short distances and work when both the payer and payee are present in the same location. This payment system initiates the mobile money transaction through either barcodes or contactless interfaces. This is done through Near-field communication (NFC)-based technology present in an NFC-enabled phone, which has comprehensive details about the mobile wallet placed in the cloud or debit/credit card. This information of the payee is stored on the device which is read by the corresponding NFC reader in the POS terminal. Proximity payments are strikingly different from remote payments as it involves the presence of payment card details from one’s own bank account and does not require any tie-up with a payment processor to facilitate the transaction. The increasing adoption of mobile payment technologies by brick and mortar-based businesses further drives the demand for proximity payments.
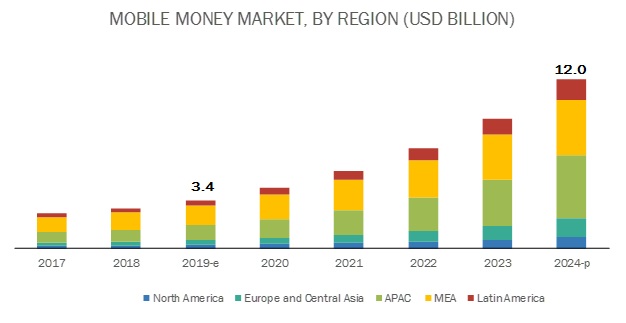
Asia Pacific to account for the largest market size during the forecast period
The global mobile money market by region covers 5 major geographic regions, namely North America, Asia Pacific (APAC), Europe and Central Asia, Middle East and Africa (MEA), and Latin America. APAC is expected to hold the largest market size during the forecast period. The region is at the forefront in the adoption of mobile money solutions, owing to the increased smartphone penetration in this region that provides operators with an opportunity to launch advanced mobile wallet services. The rapid eCommerce adoption further contributes to increased use of electronic payment mechanisms, including mobile money services.
The growth of mobile money solutions has helped bridge economic opportunities and drive financial inclusion in the region. Owing to its vast population and the developing nature of their economies, a large number of people in this region lack direct access to financial services. Traditional banking results in high operational costs and these banks are difficult to set up in rural and remote areas. However, mobile-based solutions help reduce operational costs and serve a diverse population, thereby promoting financial inclusion by bridging economic opportunities.
Key Players
Key market players profiled in the Mobile Money Market report are Vodafone (UK), Google (US), Orange (France), FIS (US), Paypal (US), Mastercard (US), Fiserve (US), Airtel (India), Gemalto (Netherlands), Alipay (China), MTN (South Africa), PAYTM (India), Samsung (South Korea), VISA (US), Tencent (China), Global Payments (US), Square (US), Amazon (US), Apple (US), Western Union Holdings (US), Comviva (India), and T- Mobile (US).
Orange (France) is a leading player in the mobile money market and the company launched Orange Money in December 2008. Orange Money is an innovative, mobile phone-based payment system, which allows customers to carry out simple financial transactions, securely. More than 46 million customers across 17 countries rely on the Orange Money application to carry out simple and secure financial services for making everyday life easier.
Scope of the Report
|
Report Metrics |
Details |
|
Market size value in 2019 |
USD 3.4 billion |
|
Revenue forecast for 2024 |
USD 12.0 billion |
|
Growth Rate |
28.7% CAGR |
|
Market size available for years |
2017–2024 |
|
Base year considered |
2018 |
|
Forecast period |
2019–2024 |
|
Forecast units |
Billion (USD) |
|
Segments covered |
Transaction mode ( Point of sale, mobile apps, QR Codes, internet payments, SMS, SIM Tool Kit [STK]/Unstructured Supplementary Service Data [USSD] payments, direct carrier billing, and mobile banking), nature of payment (P2P, P2B, B2P, and B2B), application (money transfers, bill payments, airtime transfer and top-ups, travel and ticketing, and merchandise and coupons), by type of payment (remote payments, proximity payments), and region |
|
Key Market Drivers |
|
|
Key Market Opportunities |
|
|
Geographies covered |
North America, Europe and Central Asia, APAC, MEA, and Latin America |
|
Companies covered |
Vodafone (UK), Google (US), Orange (France), FIS (US), Paypal (US), Mastercard (US), Fiserve (US), Airtel (India), Gemalto (Netherlands), Alipay (China), MTN (South Africa), PAYTM (India) Samsung (South Korea), VISA (US), Tencent (China), Global Payments (US), Square (US), Amazon (US), Apple (US), Western Union Holdings, (US), Comviva (India), and T- Mobile (US) |
The research report categorizes the mobile money market to forecast the revenues and analyze trends in each of the following subsegments:
Transaction Mode
- Point of Sale (PoS)
- Mobile Apps
- QR codes
Nature of Payment
- Person to Person (P2P)
- Person to Business (P2B)
- Business to Person (B2P)
- Business to Business (B2B)
Application
- Money transfers
- Bill Payments
- Airtime Transfer and Top-Ups
- Travel and Ticketing
- Merchandise and Coupons
Type of Payments
- Remote Payments
- Proximity Payments
Mobile Money Market By Region
- North America
- Europe and Central Asia
- APAC
- MEA
- Latin America
Recent Developments
- In November 2019, Google, a digital payments provider, launched Google Pay for business apps, targeting small and medium size businesses, helping them transfer each rupee earned by the merchant directly into their Unified Payment Interface (UPI)-linked bank account.
- In November 2019, Paypal partnered with Paykii, a leading bill platform provider to launch Xoom, PayPal’s international money transfer service in Jamaica. Customers in the US, UK, Canada, and 37 markets across Europe can use Xoom’s fast and easy money transfer service to securely pay electricity, telephone, internet, cable, mobile network, water, loan, and insurance bills in Jamaica.
- In October 2019, Airtel Africa collaborated with Mastercard to offer mobile money services across 14 African countries. The Mastercard virtual card enables Airtel Money customers without a bank account, to make payments local and global online merchants accepting Mastercard cards.
- In August 2019, Orange Romania's Orange Money launched the ‘My Reserve’ lending platform, a financing solution for phones, tablets, and accessories that can be purchased from Orange stores. The solution helps customers benefit from a simple and transparent lending tool, with no commissions and additional fees, and an annual interest rate of 14% and fixed rates.
- In May 2019, Kenya’s Safaricom partnered with Vodacom to acquire intellectual property rights to Vodafone’s M-Pesa mobile financial services platform. The acquisition allows the partners to develop local products, such as Fuliza, an M-Pesa overdraft facility launched in Kenya earlier this year that currently has 8.8 million users.
Frequently Asked Questions (FAQ):
How big is the Mobile Money Market?
What is the estimated growth rate (CAGR) of the global Mobile Money Market?
Who are the key players in Mobile Money Market?
What are the major revenue pockets in the global Mobile Money Market currently?
To speak to our analyst for a discussion on the above findings, click Speak to Analyst
 Exclusive indicates content/data unique to MarketsandMarkets and not available with any competitors.
TABLE OF CONTENTS
1 INTRODUCTION (Page No. - 22)
1.1 OBJECTIVES OF THE STUDY
1.2 MARKET DEFINITION
1.2.1 INCLUSIONS AND EXCLUSIONS
1.3 MARKET SCOPE
1.3.1 MARKET SEGMENTATION
1.3.2 REGIONS COVERED
1.3.3 YEARS CONSIDERED FOR THE STUDY
1.4 CURRENCY CONSIDERED
TABLE 1 UNITED STATES DOLLAR EXCHANGE RATE, 2016–2018
1.5 STAKEHOLDERS
2 RESEARCH METHODOLOGY (Page No. - 26)
2.1 RESEARCH DATA
FIGURE 1 GLOBAL MOBILE MONEY MARKET: RESEARCH DESIGN
2.1.1 SECONDARY DATA
2.1.2 PRIMARY DATA
2.1.2.1 Breakup of primary profiles
2.1.2.2 Key industry insights
2.2 MARKET BREAKUP AND DATA TRIANGULATION
2.3 MARKET SIZE ESTIMATION
FIGURE 2 METHOD 1: BASED ON COMPANIES’ REVENUE FROM MOBILE MONEY SOLUTIONS (TOP-DOWN)
FIGURE 3 METHOD 2: VERTICAL LEVEL (BOTTOM-UP)
2.4 MARKET FORECAST
TABLE 2 FACTOR ANALYSIS
2.5 ASSUMPTIONS FOR THE STUDY
2.6 LIMITATIONS OF THE STUDY
3 EXECUTIVE SUMMARY (Page No. - 33)
FIGURE 4 MOBILE MONEY MARKET TO WITNESS SIGNIFICANT GROWTH DURING THE FORECAST PERIOD
FIGURE 5 POINT-OF-SALE SEGMENT TO HOLD THE LARGEST MARKET SIZE DURING THE FORECAST PERIOD
FIGURE 6 LATIN AMERICA TO WITNESS THE HIGHEST GROWTH RATE DURING THE FORECAST PERIOD
4 PREMIUM INSIGHTS (Page No. - 36)
4.1 ATTRACTIVE OPPORTUNITIES IN THE GLOBAL MOBILE MONEY MARKET
FIGURE 7 GROWING NUMBER OF MOBILE SUBSCRIBERS TO SUPPORT THE MARKET GROWTH
4.2 MOBILE MONEY MARKET, BY TYPE OF PAYMENT, 2019
FIGURE 8 REMOTE PAYMENTS SEGMENT TO ACCOUNT FOR A HIGHER MARKET SHARE IN 2019
4.3 MARKET, BY NATURE OF PAYMENT, 2019 VS. 2024
FIGURE 9 PERSON TO PERSON SEGMENT TO HOLD THE HIGHEST MARKET SHARE DURING THE FORECAST PERIOD
4.4 MARKET, BY APPLICATION, 2019
FIGURE 10 MERCHANDISE AND COUPONS SEGMENT TO HOLD THE HIGHEST CAGR DURING THE FORECAST PERIOD
5 MARKET OVERVIEW (Page No. - 38)
5.1 INTRODUCTION
5.2 MARKET DYNAMICS
FIGURE 11 MOBILE MONEY MARKET: DRIVERS, RESTRAINTS, OPPORTUNITIES, AND CHALLENGES
5.2.1 DRIVERS
5.2.1.1 Increase in the number of mobile subscribers
5.2.1.2 Government initiatives to promote cashless economy driving the growth of the market
5.2.1.3 Rise in the use of digital payment-based business models by organizations driving the global market growth
5.2.2 RESTRAINTS
5.2.2.1 Concerns over data security
5.2.3 OPPORTUNITIES
5.2.3.1 Increased flexibility by using mobile money to attract more business
5.2.3.2 Rising number of NFC-enabled handset to boost the mobile money market in coming years
5.2.4 CHALLENGES
5.2.4.1 Diversified regulations and policies across regions
5.2.4.2 Limited network coverage in developing regions
5.3 REGULATORY LANDSCAPE
5.3.1 ANTI-MONEY LAUNDERING/COMBATING FINANCING OF TERRORISM
5.3.2 PAYMENT SERVICE DIRECTIVES
5.3.3 SINGLE EURO PAYMENTS AREA
5.3.4 CONSULTATIVE GROUP TO ASSIST THE POOR
5.3.5 KNOW YOUR CUSTOMER
5.3.6 CREDIT CARD ACCOUNTABILITY RESPONSIBILITY AND DISCLOSURE ACT
5.4 USE CASES
5.4.1 USE CASE 1: VODAFONE
5.4.2 USE CASE 2: GOOGLE
5.4.3 USE CASE 3: GEMALTO
5.4.4 USE CASE 4: FISERV
5.4.5 USE CASE 5: FIS
6 MOBILE MONEY MARKET, BY TRANSACTION MODE (Page No. - 46)
6.1 INTRODUCTION
FIGURE 12 MOBILE APPS SEGMENT TO GROW AT THE HIGHEST CAGR DURING THE FORECAST PERIOD
TABLE 3 MARKET SIZE, BY TRANSACTION MODE, 2017–2024 (USD MILLION)
6.2 POINT OF SALE
6.2.1 INCREASING ADOPTION OF MOBILE PAYMENT METHODS BY BRICK AND MORTAR BUSINESSES TO DRIVE THE DEMAND FOR POINT OF SALE TRANSACTION MODE
TABLE 4 POINT OF SALE: MARKET SIZE, BY REGION, 2017–2024 (USD MILLION)
6.3 MOBILE APPS
6.3.1 MULTIPLE FUNCTIONALITIES PROVIDED BY MOBILE APPS TO DRIVE THE GROWTH OF THE MOBILE APPS SEGMENT
TABLE 5 MOBILE APPS: MARKET SIZE, BY REGION, 2017–2024 (USD MILLION)
6.4 QR CODES
6.4.1 EASY-TO-USE USER INTERFACE OF QR-BASED APPLICATION TO ATTRACT MORE USERS TO THE QR-BASED PAYMENT SYSTEM
TABLE 6 QR CODES: MOBILE MONEY MARKET SIZE, BY REGION, 2017–2024 (USD MILLION)
6.5 INTERNET PAYMENTS
6.5.1 INCREASING PROMOTION OF NET BANKING BY BANKS TO DRIVE THE GLOBAL INTERNET PAYMENTS MARKET
TABLE 7 INTERNET PAYMENTS: MARKET SIZE, BY REGION, 2017–2024 (USD MILLION)
6.6 SMS AND STK/USSD PAYMENTS
6.6.1 INCREASING TRACTION OF SMS-BASED PAYMENT SYSTEM AMONG BUSINESSES TO BOOST THE MARKET OF SMS AND STK/USSD PAYMENTS
TABLE 8 SMS AND STK/USSD PAYMENTS: MARKET SIZE, BY REGION, 2017–2024 (USD MILLION)
6.7 DIRECT CARRIER BILLING
6.7.1 DEMAND FOR DIRECT CARRIER BILLING TO GROW OWING TO THE INCREASING DEMAND FOR DIGITAL CONTENT FROM MOBILE USERS
TABLE 9 DIRECT CARRIER BILLING: MARKET SIZE, BY REGION, 2017–2024 (USD MILLION)
6.8 MOBILE BANKING
6.8.1 ACCESS TO VARIOUS BANKING FACILITIES USING MOBILE BANKING TO BOOST THE MOBILE BANKING SEGMENT IN UPCOMING YEARS
TABLE 10 MOBILE BANKING: MARKET SIZE, BY REGION, 2017–2024 (USD MILLION)
7 MOBILE MONEY MARKET, BY NATURE OF PAYMENT (Page No. - 55)
7.1 INTRODUCTION
FIGURE 13 PERSON TO BUSINESS SEGMENT TO GROW AT THE HIGHEST CAGR DURING THE FORECAST PERIOD
TABLE 11 MARKET SIZE, BY NATURE OF PAYMENT, 2017–2024 (USD MILLION)
7.2 PERSON TO PERSON
7.2.1 HEALTHY COMPETITION BETWEEN PERSON-TO-PERSON PAYMENT SERVICE PROVIDERS TO BOOST THE GLOBAL MARKET IN UPCOMING YEARS
TABLE 12 PERSON TO PERSON: MARKET SIZE, BY REGION, 2017–2024 (USD MILLION)
7.3 PERSON TO BUSINESS
7.3.1 ADOPTION OF DIGITAL PAYMENT-BASED BUSINESS MODELS BY VENDORS TO DRIVE THE GROWTH OF PERSON-TO-BUSINESS MOBILE PAYMENT SEGMENT
TABLE 13 PERSON TO BUSINESS: MARKET SIZE, BY REGION, 2017–2024 (USD MILLION)
7.4 BUSINESS TO PERSON
7.4.1 USE OF FOR BUSINESS-TO-PERSON PAYMENTS FOR SALARY DISBURSEMENTS, INCENTIVES, AND COMMISSION PAYMENTS TO BOOST ITS DEMAND
TABLE 14 BUSINESS TO PERSON: MARKET SIZE, BY REGION, 2017–2024 (USD MILLION)
7.5 BUSINESS TO BUSINESS
7.5.1 RELIANCE OF BUSINESSES ON THIRD PARTIES FOR VARIOUS RESOURCES AND FUNCTIONALITIES TO DRIVE THE GROWTH OF BUSINESS-TO-BUSINESS MOBILE PAYMENTS
TABLE 15 BUSINESS TO BUSINESS: MARKET SIZE, BY REGION, 2017–2024 (USD MILLION)
8 MOBILE MONEY MARKET, BY APPLICATION (Page No. - 61)
8.1 INTRODUCTION
FIGURE 14 MERCHANDISE AND COUPONS SEGMENT TO GROW AT THE HIGHEST CAGR DURING THE FORECAST PERIOD
TABLE 16 MARKET SIZE, BY APPLICATION, 2017–2024 (USD MILLION)
8.2 MONEY TRANSFERS
8.2.1 HIGH REAL-ESTATE COSTS AND LARGE-SCALE MIGRATIONS FOR WORK FROM DEVELOPING TO DEVELOPED COUNTRIES TO DRIVE THE TO DRIVE THE DEMAND FOR MONEY TRANSFERS
TABLE 17 MONEY TRANSFERS: MARKET SIZE, BY REGION, 2017–2024 (USD MILLION)
8.3 BILL PAYMENTS
8.3.1 EASE OF E-BILLING PAYMENTS TO FUEL THE DEMAND FOR MOBILE BILL PAYMENTS
TABLE 18 BILL PAYMENTS: MARKET SIZE, BY REGION, 2017–2024 (USD MILLION)
8.4 AIRTIME TRANSFERS AND TOP-UPS
8.4.1 INCREASING NUMBER OF SERVICES OFFERED BY TELECOM PLAYERS TO DRIVE THE AIRTIME TRANSFERS AND TOP-UPS PAYMENTS
TABLE 19 AIRTIME TRANSFERS AND TOP-UPS: MARKET SIZE, BY REGION, 2017–2024 (USD MILLION)
8.5 TRAVEL AND TICKETING
8.5.1 DEVELOPING NEW TRANSPORTATION INFRASTRUCTURE IN MANY COUNTRIES TO DRIVE THE DEMAND FOR TRAVEL AND TICKETING MOBILE PAYMENTS
TABLE 20 TRAVEL AND TICKETING: MARKET SIZE, BY REGION, 2017–2024 (USD MILLION)
8.6 MERCHANDISE AND COUPONS
8.6.1 RISE OF ECOMMERCE TO DRIVE THE GROWTH OF THE MERCHANDISE AND COUPONS SEGMENT
TABLE 21 MERCHANDISE AND COUPONS: MARKET SIZE, BY REGION, 2017–2024 (USD MILLION)
9 MOBILE MONEY MARKET, BY TYPE OF PAYMENT (Page No. - 68)
9.1 INTRODUCTION
FIGURE 15 PROXIMITY PAYMENTS SEGMENT TO GROW AT A HIGHER CAGR DURING THE FORECAST PERIOD
TABLE 22 MARKET SIZE, BY TYPE OF PAYMENT, 2017–2024 (USD MILLION)
9.2 REMOTE PAYMENTS
9.2.1 RISE OF ECOMMERCE AND THIRD-PARTY DIGITAL PAYMENT SERVICES TO DRIVE THE DEMAND FOR REMOTE PAYMENTS
TABLE 23 REMOTE PAYMENTS: MARKET SIZE, BY REGION, 2017–2024 (USD MILLION)
9.3 PROXIMITY PAYMENTS
9.3.1 INCREASING ADOPTION OF MOBILE PAYMENT TECHNOLOGIES BY BRICK AND MORTAR-BASED BUSINESSES TO DRIVE THE DEMAND FOR PROXIMITY PAYMENTS
TABLE 24 PROXIMITY PAYMENTS: MARKET SIZE, BY REGION, 2017–2024 (USD MILLION)
10 MOBILE MONEY MARKET, BY REGION (Page No. - 72)
10.1 INTRODUCTION
FIGURE 16 ASIA PACIFIC TO HOLD THE HIGHEST MARKET SIZE DURING THE FORECAST PERIOD
TABLE 25 TRANSACTION VALUE, BY REGION, 2017–2024 (USD BILLION)
TABLE 26 MARKET SIZE, BY REGION, 2017–2024 (USD MILLION)
FIGURE 17 LATIN AMERICA TO GROW AT THE HIGHEST CAGR DURING THE FORECAST PERIOD
10.2 NORTH AMERICA
TABLE 27 NORTH AMERICA: MOBILE MONEY MARKET SIZE, BY TRANSACTION MODE, 2017–2024 (USD MILLION)
TABLE 28 NORTH AMERICA: MARKET SIZE, BY NATURE OF PAYMENT, 2017–2024 (USD MILLION)
TABLE 29 NORTH AMERICA: MARKET SIZE, BY APPLICATION, 2017–2024 (USD MILLION)
TABLE 30 NORTH AMERICA: MARKET SIZE, BY TYPE OF PAYMENT, 2017–2024 (USD MILLION)
TABLE 31 NORTH AMERICA: MARKET SIZE, BY COUNTRY, 2017–2024 (USD MILLION)
10.2.1 UNITED STATES
10.2.1.1 Business expansion strategies adopted by major mobile money providers contribute to the growth of the market in United States
10.2.2 CANADA
10.2.2.1 Lucrative mobile money service offerings from various mobile network operators to drive the growth of the market in Canada
10.3 EUROPE AND CENTRAL ASIA
TABLE 32 EUROPE AND CENTRAL ASIA: MOBILE MONEY MARKET SIZE, BY TRANSACTION MODE, 2017–2024 (USD MILLION)
TABLE 33 EUROPE AND CENTRAL ASIA: MARKET SIZE, BY NATURE OF PAYMENT, 2017–2024 (USD MILLION)
TABLE 34 EUROPE AND CENTRAL ASIA: MARKET SIZE, BY APPLICATION, 2017–2024 (USD MILLION)
TABLE 35 EUROPE AND CENTRAL ASIA: MARKET SIZE, BY TYPE OF PAYMENT, 2017–2024 (USD MILLION)
TABLE 36 EUROPE AND CENTRAL ASIA: MARKET SIZE, BY COUNTRY, 2017–2024 (USD MILLION)
10.3.1 UNITED KINGDOM
10.3.1.1 Various initiatives by government to promote security and ease of payments to boost the adoption of the market in the United Kingdom
10.3.2 GERMANY
10.3.2.1 Large presence of mobile payment solution providers in Germany to drive the growth of the market
10.3.3 REST OF EUROPE AND CENTRAL ASIA
10.4 ASIA PACIFIC
FIGURE 18 ASIA PACIFIC: MARKET SNAPSHOT
TABLE 37 ASIA PACIFIC: MOBILE MONEY MARKET SIZE, BY TRANSACTION MODE, 2017–2024 (USD MILLION)
TABLE 38 ASIA PACIFIC: MARKET SIZE, BY NATURE OF PAYMENT, 2017–2024 (USD MILLION)
TABLE 39 ASIA PACIFIC: MARKET SIZE, BY APPLICATION, 2017–2024 (USD MILLION)
TABLE 40 ASIA PACIFIC: MARKET SIZE, BY TYPE OF PAYMENT, 2017–2024 (USD MILLION)
TABLE 41 ASIA PACIFIC: MARKET SIZE, BY COUNTRY, 2017–2024 (USD MILLION)
10.4.1 CHINA
10.4.1.1 Increasing eCommerce industry and the adoption of mobile payment to fuel the growth of mobile money in China
TABLE 42 CHINA: MOBILE MONEY MARKET SIZE, BY TRANSACTION MODE, 2017–2024 (USD MILLION)
TABLE 43 CHINA: MARKET SIZE, BY NATURE OF PAYMENT, 2017–2024 (USD MILLION)
TABLE 44 CHINA: MARKET SIZE, BY APPLICATION, 2017–2024 (USD MILLION)
TABLE 45 CHINA: MARKET SIZE, BY TYPE OF PAYMENT, 2017–2024 (USD MILLION)
10.4.2 INDIA
10.4.2.1 Increasing adoption of smartphones, along with a favorable regulatory environment, to boost the adoption of mobile money in India
TABLE 46 INDIA: MOBILE MONEY MARKET SIZE, BY TRANSACTION MODE, 2017–2024 (USD MILLION)
TABLE 47 INDIA: MARKET SIZE, BY NATURE OF PAYMENT, 2017–2024 (USD MILLION)
TABLE 48 INDIA: MARKET SIZE, BY APPLICATION, 2017–2024 (USD MILLION)
TABLE 49 INDIA: MARKET SIZE, BY TYPE OF PAYMENT, 2017–2024 (USD MILLION)
10.4.3 REST OF ASIA PACIFIC
10.5 MIDDLE EAST AND AFRICA
TABLE 50 MIDDLE EAST AND AFRICA: MOBILE MONEY MARKET SIZE, BY TRANSACTION MODE, 2017–2024 (USD MILLION)
TABLE 51 MIDDLE EAST AND AFRICA: MARKET SIZE, BY NATURE OF PAYMENT, 2017–2024 (USD MILLION)
TABLE 52 MIDDLE EAST AND AFRICA: MARKET SIZE, BY APPLICATION, 2017–2024 (USD MILLION)
TABLE 53 MIDDLE EAST AND AFRICA: MARKET SIZE, BY TYPE OF PAYMENT, 2017–2024 (USD MILLION)
TABLE 54 MIDDLE EAST AND AFRICA: MARKET SIZE, BY SUB-REGION, 2017–2024 (USD MILLION)
10.5.1 MIDDLE EAST AND NORTH AFRICA
10.5.1.1 Increasing government initiatives for digitalizing society to fuel the growth of the mobile money market in the country
TABLE 55 MIDDLE EAST AND NORTH AFRICA: MARKET SIZE, BY TRANSACTION MODE, 2017–2024 (USD MILLION)
TABLE 56 MIDDLE EAST AND NORTH AFRICA: MARKET SIZE, BY NATURE OF PAYMENT, 2017–2024 (USD MILLION)
TABLE 57 MIDDLE EAST AND NORTH AFRICA: ONEY MARKET SIZE, BY APPLICATION, 2017–2024 (USD MILLION)
TABLE 58 MIDDLE EAST AND NORTH AFRICA: MARKET SIZE, BY TYPE OF PAYMENT, 2017–2024 (USD MILLION)
10.5.2 SUB-SAHARAN AFRICA
TABLE 59 SUB-SAHARAN AFRICA: MOBILE MONEY MARKET SIZE, BY TRANSACTION MODE, 2017–2024 (USD MILLION)
TABLE 60 SUB-SAHARAN AFRICA: MARKET SIZE, BY NATURE OF PAYMENT, 2017–2024 (USD MILLION)
TABLE 61 SUB-SAHARAN AFRICA: MARKET SIZE, BY APPLICATION, 2017–2024 (USD MILLION)
TABLE 62 SUB-SAHARAN AFRICA: MARKET SIZE, BY TYPE OF PAYMENT, 2017–2024 (USD MILLION)
TABLE 63 SUB-SAHARAN AFRICA: MARKET SIZE, BY COUNTRY, 2017–2024 (USD MILLION)
10.5.2.1 South Africa
10.5.2.1.1 Government initiatives triggering the growth of the mobile money market in the country
TABLE 64 SOUTH AFRICA: MARKET SIZE, BY TRANSACTION MODE, 2017–2024 (USD MILLION)
TABLE 65 SOUTH AFRICA: MARKET SIZE, BY NATURE OF PAYMENT, 2017–2024 (USD MILLION)
TABLE 66 SOUTH AFRICA: MARKET SIZE, BY APPLICATION, 2017–2024 (USD MILLION)
TABLE 67 SOUTH AFRICA: MARKET SIZE, BY TYPE OF PAYMENT, 2017–2024 (USD MILLION)
10.5.2.2 Kenya
10.5.2.2.1 Increasing partnership between banks, mobile network operators, governments, and businesses to digitalize payments in Kenya to boost the adoption of mobile money
TABLE 68 KENYA: MOBILE MONEY MARKET SIZE, BY TRANSACTION MODE, 2017–2024 (USD MILLION)
TABLE 69 KENYA: MARKET SIZE, BY NATURE OF PAYMENT, 2017–2024 (USD MILLION)
TABLE 70 KENYA: MARKET SIZE, BY APPLICATION, 2017–2024 (USD MILLION)
TABLE 71 KENYA: MARKET SIZE, BY TYPE OF PAYMENT, 2017–2024 (USD MILLION)
10.5.2.3 Tanzania
10.5.2.3.1 Interoperability between mobile money service providers to enhance the growth of mobile money market in Tanzania
TABLE 72 TANZANIA: MARKET SIZE, BY TRANSACTION MODE, 2017–2024 (USD MILLION)
TABLE 73 TANZANIA: MARKET SIZE, BY NATURE OF PAYMENT, 2017–2024 (USD MILLION)
TABLE 74 TANZANIA: MARKET SIZE, BY APPLICATION, 2017–2024 (USD MILLION)
TABLE 75 TANZANIA: MARKET SIZE, BY TYPE OF PAYMENT, 2017–2024 (USD MILLION)
10.5.2.4 Uganda
10.5.2.4.1 High mobile subscription penetration to drive the growth of mobile money market in Uganda
TABLE 76 UGANDA: MARKET SIZE, BY TRANSACTION MODE, 2017–2024 (USD MILLION)
TABLE 77 UGANDA: MARKET SIZE, BY NATURE OF PAYMENT, 2017–2024 (USD MILLION)
TABLE 78 UGANDA: MARKET SIZE, BY APPLICATION, 2017–2024 (USD MILLION)
TABLE 79 UGANDA: MARKET SIZE, BY TYPE OF PAYMENT, 2017–2024 (USD MILLION)
10.5.2.5 Ghana
10.5.2.5.1 Various partnerships between mobile network operators and banks to boost the growth of the mobile money market in the country
TABLE 80 GHANA: MARKET SIZE, BY TRANSACTION MODE, 2017–2024 (USD MILLION)
TABLE 81 GHANA: MARKET SIZE, BY NATURE OF PAYMENT, 2017–2024 (USD MILLION)
TABLE 82 GHANA: MARKET SIZE, BY APPLICATION, 2017–2024 (USD MILLION)
TABLE 83 GHANA: MARKET SIZE, BY TYPE OF PAYMENT, 2017–2024 (USD MILLION)
10.5.2.6 Zimbabwe
10.5.2.6.1 High mobile penetration rate and a high percentage of unbanked population to drive the adoption of mobile money in Zimbabwe
TABLE 84 ZIMBABWE: MOBILE MONEY MARKET SIZE, BY TRANSACTION MODE, 2017–2024 (USD MILLION)
TABLE 85 ZIMBABWE: MARKET SIZE, BY NATURE OF PAYMENT, 2017–2024 (USD MILLION)
TABLE 86 ZIMBABWE: MARKET SIZE, BY APPLICATION, 2017–2024 (USD MILLION)
TABLE 87 ZIMBABWE: MARKET SIZE, BY TYPE OF PAYMENT, 2017–2024 (USD MILLION)
10.5.2.7 Nigeria
10.5.2.7.1 Low penetration of financial services to fuel the adoption of mobile money in Nigeria
TABLE 88 NIGERIA: MOBILE MONEY MARKET SIZE, BY TRANSACTION MODE, 2017–2024 (USD MILLION)
TABLE 89 NIGERIA: MARKET SIZE, BY NATURE OF PAYMENT, 2017–2024 (USD MILLION)
TABLE 90 NIGERIA: MARKET SIZE, BY APPLICATION, 2017–2024 (USD MILLION)
TABLE 91 NIGERIA: MARKET SIZE, BY TYPE OF PAYMENT, 2017–2024 (USD MILLION)
10.5.2.8 Ivory Coast
10.5.2.8.1 Interoperability between mobile money providers to play an important role in the growth of the mobile money market in Ivory Coast
TABLE 92 IVORY COAST: MOBILE MONEY MARKET SIZE, BY TRANSACTION MODE, 2017–2024 (USD MILLION)
TABLE 93 IVORY COAST: MARKET SIZE, BY NATURE OF PAYMENT, 2017–2024 (USD MILLION)
TABLE 94 IVORY COAST: MARKET SIZE, BY APPLICATION, 2017–2024 (USD MILLION)
TABLE 95 IVORY COAST: MARKET SIZE, BY TYPE OF PAYMENT, 2017–2024 (USD MILLION)
10.5.2.9 Rest of Sub-Saharan Africa
10.6 LATIN AMERICA
FIGURE 19 LATIN AMERICA: MARKET SNAPSHOT
TABLE 96 LATIN AMERICA: MOBILE MONEY MARKET SIZE, BY TRANSACTION MODE, 2017–2024 (USD MILLION)
TABLE 97 LATIN AMERICA: MARKET SIZE, BY NATURE OF PAYMENT, 2017–2024 (USD MILLION)
TABLE 98 LATIN AMERICA: MARKET SIZE, BY APPLICATION, 2017–2024 (USD MILLION)
TABLE 99 LATIN AMERICA: MARKET SIZE, BY TYPE OF PAYMENT, 2017–2024 (USD MILLION)
TABLE 100 LATIN AMERICA: MARKET SIZE, BY COUNTRY, 2017–2024 (USD MILLION)
10.6.1 BRAZIL
10.6.1.1 Strong government initiatives for digital payments to fuel the growth of mobile money in Brazil
10.6.2 MEXICO
10.6.2.1 Recent government initiatives to drive the growth of the mobile money market in the country
10.6.3 REST OF LATIN AMERICA
11 COMPLETIVE LANDSCAPE (Page No. - 119)
11.1 INTRODUCTION
FIGURE 20 KEY DEVELOPMENTS IN THE MOBILE MONEY MARKET DURING 2016–2019
11.2 COMPETITIVE SCENARIO
FIGURE 21 MARKET EVALUATION FRAMEWORK, 2017–2019
11.2.1 PARTNERSHIPS
TABLE 101 PARTNERSHIPS, 2018–2019
11.2.2 NEW PRODUCT LAUNCHES
TABLE 102 NEW PRODUCT/SERVICE LAUNCHES AND PRODUCT ENHANCEMENTS, 2018–2019
11.2.3 ACQUISITIONS
TABLE 103 ACQUISITIONS, 2018–2019
12 COMPANY PROFILES (Page No. - 123)
12.1 INTRODUCTION
(Business Overview, Solutions Offered, Recent Developments, and MNM View)*
12.2 VODAFONE GROUP
FIGURE 22 VODAFONE: COMPANY SNAPSHOT
12.3 GOOGLE
FIGURE 23 GOOGLE: COMPANY SNAPSHOT
12.4 ORANGE
FIGURE 24 ORANGE: COMPANY SNAPSHOT
12.5 FIDELITY NATIONAL INFORMATION SERVICES
FIGURE 25 FIS: COMPANY SNAPSHOT
12.6 PAYPAL
FIGURE 26 PAYPAL: COMPANY SNAPSHOT
12.7 MASTERCARD
FIGURE 27 MASTERCARD: COMPANY SNAPSHOT
12.8 FISERV
FIGURE 28 FISERV: COMPANY SNAPSHOT
12.9 AIRTEL
FIGURE 29 AIRTEL: COMPANY SNAPSHOT
12.10 GEMALTO
FIGURE 30 GEMALTO: COMPANY SNAPSHOT
12.11 ALIPAY
12.12 MTN
12.13 PAYTM
12.14 SAMSUNG ELECTRONICS
12.15 VISA
12.16 TENCENT
12.17 GLOBAL PAYMENTS
12.18 SQUARE
12.19 AMAZON
12.20 APPLE
12.21 WESTERN UNION
12.22 COMVIVA
12.23 T- MOBILE
*Details on Business Overview, Solutions Offered, Recent Developments, and MNM View might not be captured in case of unlisted companies.
13 APPENDIX (Page No. - 152)
13.1 DISCUSSION GUIDE
13.2 KNOWLEDGE STORE: MARKETSANDMARKETS’ SUBSCRIPTION PORTAL
13.3 AVAILABLE CUSTOMIZATIONS
13.4 RELATED REPORTS
13.5 AUTHOR DETAILS
The study involved 4 major activities in estimating the current size of the mobile money market. An extensive secondary research was done to collect information on the market, the peer market, and the parent market. The next step was to validate these findings, assumptions, and sizing with industry experts across the value chain through primary research. Both top-down and bottom-up approaches were employed to estimate the total market size. After that, the market breakup and data triangulation procedures were used to estimate the market size of segments and subsegments of the market.
Secondary Research
In the secondary research process, various secondary sources, such as D&B Hoovers, Bloomberg BusinessWeek, and Factiva, have been referred, to identify and collect information for this study. These secondary sources included annual reports; press releases and investor presentations of companies; whitepapers, GSMA publications, and World Bank data.
Primary Research
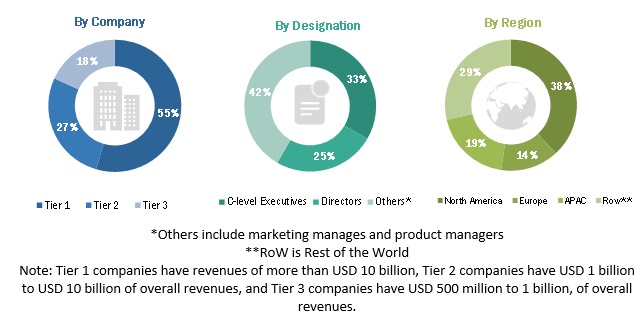
Various primary sources from both the supply and demand sides of the mobile money market ecosystem were interviewed to obtain qualitative and quantitative information for this study. The primary sources from the supply side included industry experts, such as Chief Executive Officers (CEOs), Vice Presidents (VPs), marketing directors, technology and innovation directors, and related key executives from various vendors providing mobile money solutions in the targeted regions. All possible parameters that affect the market covered in this research study have been accounted for, viewed in extensive detail, verified through primary research, and analyzed to get the final quantitative and qualitative data. The following is the breakup of the primary respondents’ profiles:
To know about the assumptions considered for the study, download the pdf brochure
Mobile Money Market Size Estimation
To make market estimations and forecast the mobile money market and other dependent submarkets, the top-down and bottom-up approaches were used. The bottom-up procedure was used to arrive at the overall size of the global mobile money market using the revenues and offerings of the key companies in the market. The research methodology used to estimate the market size includes the following:
- The key players in the market were identified through extensive secondary research.
- The market size, in terms of value, was determined through primary and secondary research processes.
- All percentage shares, splits, and breakups were determined using secondary sources and verified through primary sources.
Data Triangulation
With data triangulation and validation through primary interviews, the exact value of the overall parent market size was determined and confirmed using this study. The overall market size was then used in the top-down procedure to estimate the size of other individual markets via percentage splits of the market segmentation.
Report Objectives
- To determine and forecast the global mobile money market based on transaction mode (Point of Sale [PoS], mobile apps, Quick Response [QR] codes), nature of payment (Person to Person [P2P], Person to Business [P2B], Business to Person [B2P], and Business to Business [B2B]), application (money transfers, bill payments, airtime transfer and top-ups, travel and ticketing, and merchandise and coupons), by type of payment (remote payments and proximity payments), and region from 2019 to 2024, and analyze the various macro and microeconomic factors that affect the market growth
- To forecast the size of the market segments based on 4 regions, namely, North America, Europe and Central Asia, Asia Pacific (APAC), Middle East and Africa (MEA), and Latin America
- To provide detailed information regarding the major factors (drivers, opportunities, and challenges) influencing the growth of the mobile money market
- To analyze each submarket for individual growth trends, prospects, and contributions to the total market
- To analyze opportunities in the market for stakeholders by identifying high-growth segments of the market
- To profile the key market players comprising top vendors and startups, provide comparative analysis based on business overviews, regional presence, product offerings, business strategies, and key financials, and to illustrate the market’s competitive landscape
- To track and analyze competitive developments, such as mergers and acquisitions, product developments, partnerships and collaborations, and Research and Development (R&D) activities, in the market
Available Customizations
With the given market data, MarketsandMarkets offers customizations as per the company’s specific requirements. The following customization options are available for the report:
Product Analysis
- Product matrix provides detailed product information and comparisons
Geographic Analysis
- Further breakup of the North American mobile money market
- Further breakup of the European market
- Further breakup of the APAC market
- Further breakup of the Latin America market
Company Information
- Detailed analysis and profiling of additional market players


Growth opportunities and latent adjacency in Mobile Money Market
Interested in knowing more about the role of infrastructure providers in mobile money ecosystem
Interested in knowing more about mobile money effect on customer retention facts, churn reduction rates, service provider customer life cycle, and overall impacts from loyalty perspectives.
Interested in insights on how banks can leverage mobile money to tap unbanked community in Zambia
Interested in insights for LAOS market