Monochloroacetic Acid Market by Product Form (Crystalline, Liquid, And Flakes), Application (CMC, Agrochemicals, Surfactants, TGA), and Region (North America, APAC, Europe, Middle East & Africa, and South America) - Global Forecast to 2022
Monochloroacetic Acid Market Size And Forecast
[105 Pages Report] MCA, also known as chloroacetic acid, is a strong acid, mainly used as an intermediate in industrial processes for the production of CMC, herbicides, and surfactants. MCA is produced through catalytic chlorination of acetic acid with acetic anhydride as the catalyst. It is colorless, hygroscopic, and crystalline. Major applications include CMC, herbicides & pesticides such as 2-methyl-4-chlorophenoxyacetic acid (MCPA), surfactants, TGA, and others. It is available in three forms, namely, crystalline, liquid, and flakes
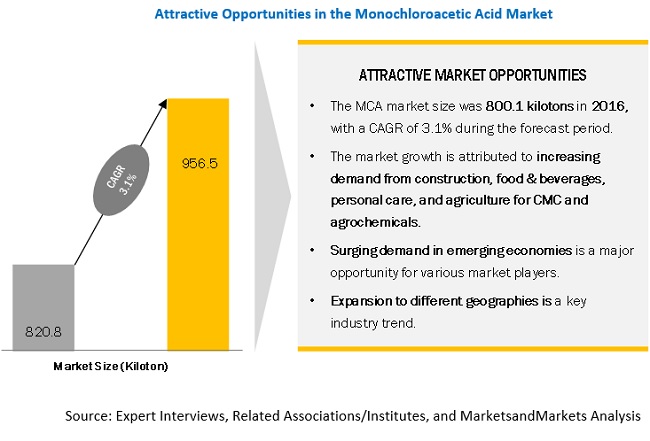
The market size of MCA in 2016 was USD 733.4 million and is projected to reach USD 908.9 million by 2022, at a CAGR of 3.6%. CMC is the largest application of MCA that accounted for a share of 49.3%, in terms of value, in 2016. The MCA market size was 800.1 kilotons in 2016, with a CAGR of 3.1% during the forecast period. The market in this segment is projected to register a CAGR of 3.3% between 2017 and 2022. Surfactants are the fastest-growing application segment of MCA, which is projected to register a CAGR of 3.5% during the forecast period.

”CMC application to lead the MCA market between 2017 and 2022”
Surfactants are the fastest-growing application of MCA owing to its increasing use in detergents, wetting agents, emulsifiers, foaming agents, and dispersants, which are used in several personal care products. The increasing disposable income and a better standard of living of consumers in emerging economies play a pivotal role in the growth of the personal care industry, which, in turn, drives the demand for surfactants. CMC is the largest application of MCA owing to its use in various end-use industries such as oil & gas, construction, textile, paints & coatings, food & beverage, and several others.
Crystalline form to lead the MARKET between 2017 and 2022”
Crystalline product form accounted for the largest market share in 2016, in terms of value. The high market size is attributed to the low cost and easy production process of a crystalline form. The demand for liquid product form is increasing globally, owing to its easy miscibility as an intermediate and efficient operation.
“APAC to be the largest and fastest-growing market DURING the forecast period”
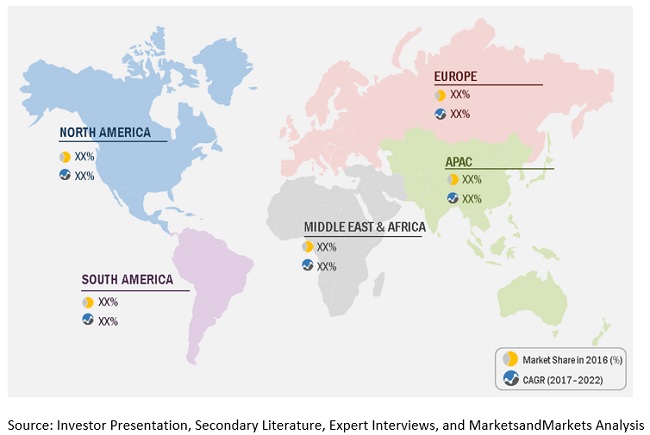
APAC is the largest market, which accounted for a share of 29.7% in 2016, in terms of value. The market growth is primarily attributed to the growth in population, increasing demand for MCA in the formulation of CMC, agrochemicals, and surfactants, which are used in the industries such as building & construction, and agriculture. The market growth in this region is also attributed to higher growth prospects in the personal care applications. According to the World Bank, Eastern Asia and Pacific regions together witnessed approximately two-fifths of the personal care product consumption, in 2015, which was more than twice the combined contribution by other developing regions. This has indicated the growth potential in this region. Globally, China is expected to have the largest share in the market during the forecast period.

Market Dynamics
Driver: Growing Demand for agrochemicals
The demand for agrochemicals is increasing due to the growing population. As per the United Nations, the amount of food required by 2050 will be 70% more than the current requirement. In emerging economies such as China and India, growing population and greater economic prosperity will further drive food production. In India, the population is projected to rise to 9.3 billion by 2050 which will lead to increased food demand and hence will increase the use of crop protection chemicals such as herbicides and pesticides. Crop protection chemicals safeguard crops and ensure higher yield. The demand for crop protection chemicals is high in APAC and Latin American countries. In addition, the development of environment-friendly crop protection chemicals due to the environment-related restrictions issued by various agencies such as EPA and European Environment Agency in developed countries such as the US and the UK will also drive the market for MCA.
Opportunity: High Demand from the construction industry of emerging economies
Emerging economies such as China, India, Malaysia, Indonesia, Brazil, Mexico, Argentina, and others are some of the major markets for MCA. The growing infrastructural development and rapid urbanization in emerging economies are encouraging the rise in demand for CMC and surfactants, thus, boosting the demand for MCA.
China among other emerging economies is the largest construction market. In 2016, China’s construction industry grew at 17%, a 5% increase from 2015. This growth was augmented by policy changes such as strong fiscal stimulus for infrastructure investments and easing of real estate regulations, purchase criteria, and credit availability which resulted in the growth of the domestic real estate market. Infrastructure investment will further improve, driven by mandates to meet regional development plans, initiatives such as “Belt and Road” and development of smart cities which will include optimization of urban space through public transport, high-capacity infrastructure, mixed-use development, and green city planning. In India, the constant economic growth of around 7.5% driven by government initiatives such as FDI allowance, improved policy framework, and low commodity prices have provided a strong stimulus to the construction industry. Recent deregulations for the ease of doing business are attracting foreign investments. In addition, modernization of the construction industry also drives the MCA market.
Challenge: Harmful effects of MCA exposure
MCA is an acid and can cause eye and skin irritation upon contact. Diluted MCA causes skin irritation while concentrated MCA may cause skin corrosion and conjunctival burns. The toxicity by MCA causes inhibition of enzymes of the glycolytic pathway and tricarboxylic acid cycle. This causes a metabolic blockage that damages organs with high energy demand such as heart, central nervous systems, kidneys, muscles, and also leads to the accumulation of lactic and citric acid in the body. Liquid and flakes forms of MCA are more corrosive than crystalline form. Proper handling and operation techniques are mandated while working with MCA.
Scope of the Report
|
Report Metric |
Details |
|
Market size available for years |
2015 – 2022 |
|
Base year considered |
2016 |
|
Forecast period |
2017 - 2022 |
|
Forecast units |
Million/Billion (USD), Kilotons |
|
Segments covered |
Form, Application, and Region |
|
Geographies covered |
North America, Europe, APAC, RoW (South America, Middle East, and Africa) |
|
Companies covered |
Key market players, including |
The research report categorizes the Monochloroacetic Acid market to forecast the revenues and analyze the trends in each of the following sub-segments:
Monochloroacetic Acid Market, By Form
- Crystalline
- Liquid
- Flakes
Monochloroacetic Acid Market, By Application
- Carboxymethylcellulose (CMC)
- Agrochemicals
- Surfactants
- Thioglycolic Acid (TGA)
- Others
Monochloroacetic Acid Market, By Region
- North America
- Europe
- Asia Pacific (APAC)
- MiddleEast & Africa
- South America
Key Market Players
AkzoNobel (Netherlands), CABB (Germany), Daicel Corporation (Japan), PCC SE (Germany), Niacet Corporation (U.S.), Shandong Minji Chemical (China), Denak Co. (Japan), Kaifeng Dongda Chemical Company (China), and Meridian Chem-Bond (India).
Recent Developments

Critical questions the report answers:
- What are the upcoming trends for the Monochloroacetic Acid Market?
- Which segment provides the most opportunity for growth?
- Who are the leading vendors operating in this market?
- What are the opportunities for new market entrants?
To speak to our analyst for a discussion on the above findings, click Speak to Analyst

Table of Contents
1 Introduction (Page No. - 12)
1.1 Objectives of the Study
1.2 Market Definition
1.3 Market Scope
1.3.1 Years Considered for the Study
1.4 Currency
1.5 Units Considered
1.6 Stakeholders
2 Research Methodology (Page No. - 15)
2.1 Research Data
2.1.1 Secondary Data
2.1.1.1 Key Data From Secondary Sources
2.1.2 Primary Data
2.1.2.1 Key Data From Primary Sources
2.1.2.2 Key Industry Insights
2.1.2.3 Breakdown of Primary Interviews
2.2 Market Size Estimation
2.3 Data Triangulation
2.4 Assumptions and Limitations
2.4.1 Assumptions
2.4.2 Limitations
3 Executive Summary (Page No. - 23)
4 Premium Insights (Page No. - 26)
4.1 Significant Opportunities in the MCA Market
4.2 MCA Market, By Application
4.3 MCA Market, By Product Form
4.4 APAC: MCA Market, By Application and Country
4.5 MCA Market Share, By Region
5 Market Overview (Page No. - 29)
5.1 Introduction
5.1.1 Drivers
5.1.1.1 Increasing Demand for Carboxymethylcellulose (CMC)
5.1.1.2 Growing Demand for Agrochemicals
5.1.2 Opportunities
5.1.2.1 High Demand From the Construction Industry of Emerging Economies
5.1.3 Challenges
5.1.3.1 Harmful Effects of MCA Exposure
5.2 Porter’s Five Forces Analysis
5.2.1 Bargaining Power of Suppliers
5.2.2 Bargaining Power of Buyers
5.2.3 Threat of New Entrants
5.2.4 Threat of Substitutes
5.2.5 Intensity of Competitive Rivalry
6 Macroeconomic Indicators (Page No. - 34)
6.1 Introduction
6.2 Trends and Forecast of the GDP Growth Rate of Major Economies
6.3 Construction Industry
6.3.1 Construction Industry in North America
6.3.2 Construction Industry in Europe
6.3.3 Trends and Forecast of the Construction Industry in APAC
7 MCA Market, By Product Form (Page No. - 36)
7.1 Introduction
7.2 Crystalline
7.3 Liquid
7.4 Flakes
8 MCA Market, By Application (Page No. - 39)
8.1 Introduction
8.2 Carboxymethylcellulose (CMC)
8.3 Agrochemicals
8.4 Surfactants
8.5 Thioglycolic Acid (TGA)
8.6 Others
9 MCA Market, By Region (Page No. - 43)
9.1 Introduction
9.2 APAC
9.2.1 China
9.2.2 India
9.2.3 Japan
9.2.4 South Korea
9.2.5 Indonesia
9.2.6 Rest of APAC
9.3 North America
9.3.1 US
9.3.2 Canada
9.3.3 Mexico
9.4 Europe
9.4.1 Germany
9.4.2 France
9.4.3 UK
9.4.4 Italy
9.4.5 Spain
9.4.6 Rest of Europe
9.5 Middle East & Africa
9.5.1 Saudi Arabia
9.5.2 Turkey
9.5.3 UAE
9.5.4 South Africa
9.5.5 Rest of Mea
9.6 South America
9.6.1 Brazil
9.6.2 Argentina
9.6.3 Rest of South America
10 Competitive Landscape (Page No. - 80)
10.1 Introduction
10.2 Competitive Scenario
10.2.1 Joint Venture
10.2.2 Acquisition
10.3 Market Ranking Analysis
11 Company Profiles (Page No. - 83)
(Overview, Financial*, Products & Services, Strategy, and Developments)
11.1 Akzonobel
11.2 CABB
11.3 Daicel
11.4 Shandong Minji Chemical
11.5 PCC
11.6 Archit Organosys
11.7 Denak
11.8 Kaifeng Dongda Chemical Company
11.9 Meridian Chem-Bond
11.10 Niacet
11.11 Other Players
11.11.1 S R Drugs and Intermediates
11.11.2 Henan HDF Chemical Company
11.11.3 Anugrah In-Org
11.11.4 Puyang Tiancheng Chemical Co., Ltd.
*Details Might Not Be Captured in Case of Unlisted Companies
12 Appendix (Page No. - 97)
12.1 Insights From Industry Experts
12.2 Discussion Guide
12.3 Knowledge Store: Marketsandmarkets Subscription Portal
12.4 Introducing RT: Real-Time Market Intelligence
12.5 Available Customizations
12.6 Related Reports
12.7 Author Details
List of Tables (78 Tables)
Table 1 Trends and Forecast of GDP Growth Rate, By Key Country, 2016–2021
Table 2 Contribution of the Construction Industry to GDP in North America, 2014– 2016 (USD Billion)
Table 3 Contribution of the Construction Industry to GDP in Europe (USD Billion)
Table 4 Contribution of the Construction Industry to GDP in APAC (USD Billion)
Table 5 Monochloroacetic Acid Market Size, By Product Form, 2015–2022 (Kiloton)
Table 6 MCA Market Size, By Product Form, 2015–2022 (USD Million)
Table 7 Monochloroacetic Acid Market Size, By Application, 2015–2022 (Kiloton)
Table 8 MCA Market Size, By Application, 2015–2022 (USD Million)
Table 9 Monochloroacetic Acid Market Size, By Region, 2015—2022 (Kiloton)
Table 10 MCA Market Size, By Region, 2015—2022 (USD Million)
Table 11 APAC: Monochloroacetic Acid Market Size, By Country, 2015—2022 (Kiloton)
Table 12 APAC: MCA Market Size, By Country, 2015—2022 (USD Million)
Table 13 APAC: Monochloroacetic Acid Market Size, By Application, 2015—2022 (Kiloton)
Table 14 APAC: MCA Market Size, By Application, 2015—2022 (USD Million)
Table 15 China: Monochloroacetic Acid Market Size, By Application, 2015—2022 (Kiloton)
Table 16 China: MCA Market Size, By Application, 2015—2022 (USD Million)
Table 17 India: Monochloroacetic Acid Market Size, By Application, 2015—2022 (Kiloton)
Table 18 India: MCA Market Size, By Application, 2015—2022 (USD Million)
Table 19 Japan: Monochloroacetic Acid Market Size, By Application, 2015—2022 (Kiloton)
Table 20 Japan: MCA Market Size, By Application, 2015—2022 (USD Million)
Table 21 South Korea: Monochloroacetic Acid Market Size, By Application, 2015—2022 (Kiloton)
Table 22 South Korea: MCA Market Size, By Application, 2015—2022 (USD Million)
Table 23 Indonesia: Monochloroacetic Acid Market Size, By Application, 2015—2022 (Kiloton)
Table 24 Indonesia: MCA Market Size, By Application, 2015—2022 (USD Million)
Table 25 Rest of APAC: Monochloroacetic Acid Market Size, By Application, 2015—2022 (Kiloton)
Table 26 Rest of APAC: MCA Market Size, By Application, 2015—2022 (USD Million)
Table 27 North America: Monochloroacetic Acid Market Size, By Country, 2015–2022 (Kiloton)
Table 28 North America: MCA Market Size, By Country, 2015–2022 (USD Million)
Table 29 North America: Monochloroacetic Acid Market Size, By Application, 2015–2022 (Kiloton)
Table 30 North America: MCA Market Size, By Application, 2015–2022 (USD Million)
Table 31 US: Monochloroacetic Acid Market Size, By Application, 2015–2022 (Kiloton)
Table 32 US: MCA Market Size, By Application, 2015–2022 (USD Million)
Table 33 Canada: Monochloroacetic Acid Market Size, By Application, 2015–2022 (Kiloton)
Table 34 Canada: MCA Market Size, By Application, 2015–2022 (USD Million)
Table 35 Mexico: Monochloroacetic Acid Market Size, By Application, 2015–2022 (Kiloton)
Table 36 Mexico: MCA Market Size, By Application, 2015–2022 (USD Million)
Table 37 Europe: Monochloroacetic Acid Market Size, By Country, 2015—2022 (Kiloton)
Table 38 Europe: MCA Market Size, By Country, 2015—2022 (USD Million)
Table 39 Europe: Monochloroacetic Acid Market Size, By Application, 2015—2022 (Kiloton)
Table 40 Europe: MCA Market Size, By Application, 2015—2022 (USD Million)
Table 41 Germany: Monochloroacetic Acid Market Size, By Application, 2015—2022 (Kiloton)
Table 42 Germany: MCA Market Size, By Application, 2015—2022 (USD Million)
Table 43 France: Monochloroacetic Acid Market Size, By Application, 2015—2022 (Kiloton)
Table 44 France: MCA Market Size, By Application, 2015—2022 (USD Million)
Table 45 UK: Monochloroacetic Acid Market Size, By Application, 2015—2022 (Kiloton)
Table 46 UK: MCA Market Size, By Application, 2015—2022 (USD Million)
Table 47 Italy: Monochloroacetic Acid Market Size, By Application, 2015—2022 (Kiloton)
Table 48 Italy: MCA Market Size, By Application, 2015—2022 (USD Million)
Table 49 Spain: Monochloroacetic Acid Market Size, By Application, 2015—2022 (Kiloton)
Table 50 Spain: MCA Market Size, By Application, 2015—2022 (USD Million)
Table 51 Rest of Europe: Monochloroacetic Acid Market Size, By Application, 2015—2022 (Kiloton)
Table 52 Rest of Europe: MCA Market Size, By Application, 2015—2022 (USD Million)
Table 53 MEA: Monochloroacetic Acid Market Size, By Country, 2015–2022 (Kiloton)
Table 54 MEA: MCA Market Size, By Country, 2015–2022 (USD Million)
Table 55 MEA: Monochloroacetic Acid Market Size, By Application, 2015–2022 (Kiloton)
Table 56 MEA: MCA Market Size, By Application, 2015–2022 (USD Million)
Table 57 Saudi Arabia: Monochloroacetic Acid Market Size, By Application, 2015–2022 (Kiloton)
Table 58 Saudi Arabia: MCA Market Size, By Application, 2015–2022 (USD Million)
Table 59 Turkey: Monochloroacetic Acid Market Size, By Application, 2015–2022 (Kiloton)
Table 60 Turkey: MCA Market Size, By Application, 2015–2022 (USD Million)
Table 61 UAE: Monochloroacetic Acid Market Size, By Application, 2015–2022 (Kiloton)
Table 62 UAE: MCA Market Size, By Application, 2015–2022 (USD Million)
Table 63 South Africa: Monochloroacetic Acid Market Size, By Application, 2015–2022 (Kiloton)
Table 64 South Africa: MCA Market Size, By Application, 2015–2022 (USD Million)
Table 65 Rest of MEA: Monochloroacetic Acid Market Size, By Application, 2015–2022 (Kiloton)
Table 66 Rest of MEA: MCA Market Size, By Application, 2015–2022 (USD Million)
Table 67 South America: Monochloroacetic Acid Market Size, By Country, 2015–2022 (Kiloton)
Table 68 South America: MCA Market Size, By Country, 2015–2022 (USD Million)
Table 69 South America: Monochloroacetic Acid Market Size, By Application, 2015–2022 (Kiloton)
Table 70 South America: MCA Market Size, By Application, 2015–2022 (USD Million)
Table 71 Brazil: Monochloroacetic Acid Market Size, By Application, 2015–2022 (Kiloton)
Table 72 Brazil: MCA Market Size, By Application, 2015–2022 (USD Million)
Table 73 Argentina: Monochloroacetic Acid Market Size, By Application, 2015–2022 (Kiloton)
Table 74 Argentina: MCA Market Size, By Application, 2015–2022 (USD Million)
Table 75 Rest of South America: Monochloroacetic Acid Market Size, By Application, 2015–2022 (Kiloton)
Table 76 Rest of South America: MCA Market Size, By Application, 2015–2022 (USD Million)
Table 77 Joint Venture, 2013–2017
Table 78 Acquisition, 2013–2017
List of Figures (29 Figures)
Figure 1 MCA Market Segmentation
Figure 2 MCA Market: Research Design
Figure 3 Market Size Estimation: Bottom-Up Approach
Figure 4 Market Size Estimation: Top-Down Approach
Figure 5 MCA Market: Data Triangulation
Figure 6 CMC Application to Lead the MCA Market Between 2017 and 2022
Figure 7 Crystalline Form to Lead the Market Between 2017 and 2022
Figure 8 APAC to Be the Largest and Fastest-Growing Market During the Forecast Period
Figure 9 Attractive Opportunities in the MCA Market Between 2017 and 2022
Figure 10 CMC Application to Account for the Largest Market Share, 2017–2022 (Kiloton)
Figure 11 Crystalline Form to Lead the Market Between 2017 and 2022 (Kiloton)
Figure 12 CMC Was the Largest Application Segment of the APAC MCA Market in 2016
Figure 13 APAC Accounted for the Largest Market Share in 2016
Figure 14 Overview of Factors Governing the MCA Market
Figure 15 MCA Market: Porter’s Five Forces Analysis
Figure 16 Crystalline to Be the Largest Product Form Between 2017 and 2022
Figure 17 CMC to Be the Largest Application Between 2017 and 2022
Figure 18 India to Be the Fastest-Growing MCA Market
Figure 19 APAC: MCA Market Snapshot
Figure 20 North America: MCA Market Snapshot
Figure 21 Germany to Be the Leading European MCA Market
Figure 22 Akzonobel Led the MCA Market in 2016
Figure 23 Akzonobel: Company Snapshot
Figure 24 Akzonobel: SWOT Analysis
Figure 25 Daicel: Company Snapshot
Figure 26 Daicel: SWOT Analysis
Figure 27 PCC: Company Snapshot
Figure 28 PCC: SWOT Analysis
Figure 29 Archit Organosys: Company Snapshot


Growth opportunities and latent adjacency in Monochloroacetic Acid Market