Food Thickeners Market by Type (Hydrocolloids, Protein, Starch), Source (Plant, Animal, Microbial), Application (Bakery, Confectionery, Sauces, Marinades & Gravies, Beverages, Dairy, Convenience Foods), and Region - Global Forecast to 2022


[171 Pages Report] The food thickeners market, by value, is projected to reach 15.80 Billion by 2022, at a CAGR of 5.95% from 2016 to 2022. Growth in demand for convenience foods, consumer awareness toward healthy diet, and multiple functionalities and advantages associated with the use of food thickeners are the factors driving global market.
The years considered for the study are as follows:
- Base year – 2015
- Estimated year – 2016
- Projected year – 2022
- Forecast period – 2016 to 2022
The objectives of the report
- To define, segment, and forecast the size of the food thickeners market on the basis of type, application, source, and region
- To project the market size, in terms of value, for each of the segments
- To forecast the size of the global market and its various submarkets with respect to the four main regions, namely, North America, Asia-Pacific, Europe, and the Rest of the World (RoW)
- To provide detailed information about crucial factors that are influencing the growth of the market (drivers, restraints, opportunities, and industry-specific challenges)
- To strategically analyze micromarkets with respect to individual growth trends, future prospects, and their contribution to the total market
- To analyze opportunities in the market for stakeholders and provide details of the competitive landscape for market leaders
- To strategically profile key players and comprehensively analyze their market share and core competencies
- To analyze competitive developments such as expansions & investments, acquisitions, joint ventures & agreements, and new product launches in the food thickeners market
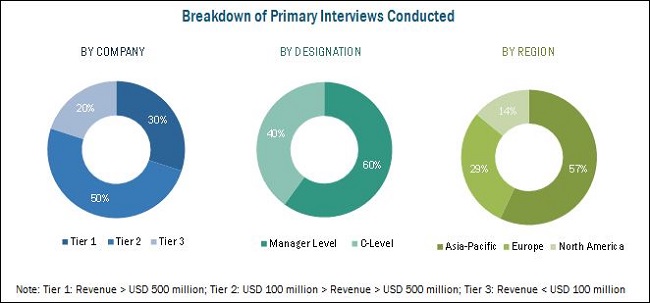
Research Methodology:
- Major regions were identified, along with countries contributing the maximum share
- Secondary research was conducted to find the value of food thickeners for regions such as North America, Europe, Asia-Pacific, and RoW
- The key players have been identified through secondary sources such as the Food & Drug Administration (FDA), the United States Department of Agriculture (USDA), and the Canadian Food Inspection Agency (CFIA), while their market shares in respective regions have been determined through both, primary and secondary research. The research methodology includes the study of annual and financial reports of top market players, as well as interviews with industry experts (such as CEOs, VPs, directors, and marketing executives) for key insights (both quantitative and qualitative) for the food thickeners market.
To know about the assumptions considered for the study, download the pdf brochure
The various contributors involved in the value chain of food thickeners market include raw material suppliers, R&D institutes, food thickeners manufacturing companies such as Cargill (U.S.), Archer Daniels Midland Company (U.S.), E. I. Du Pont De Nemours and Company (U.S.), and government bodies & regulatory associations such as the United States Department of Agriculture (USDA), the Food and Drug Administration (FDA), and the European Food Safety Authority (EFSA).
Target Audience
The stakeholders for the report are as follows:
- Raw material suppliers
- Traders, distributors, and manufacturers & suppliers of food thickeners
- Food processors & food manufacturers
- Government and research organizations
- Trade associations and industry bodies
- Regulatory bodies such as the Food and Drugs Organization (FDA), the European Commission (EU), the European Food Safety Authority (EFSA), Health Canada, and Food Standards Australia New Zealand (FSANZ)
Scope of the Report:
This research report categorizes the food thickeners market based on type, source, application, and region.
Based on Type, the market has been segmented as follows:
- Hydrocolloids
- Protein
- Starch
Based on Source, the market has been segmented as follows:
- Plant
- Animal
- Microbial
Based on Application, the market has been segmented as follows:
- Bakery
- Confectionery
- Sauces, dressings, marinades, and gravies
- Beverages
- Dairy & frozen deserts
- Convenience & processed foods
Based on Region, the market has been segmented as follows:
- North America
- Europe
- Asia-Pacific
- RoW (Latin America, Africa, and the Middle East)
Available Customizations
With the given market data, MarketsandMarkets offers customizations according to client-specific scientific needs.
The following customization options are available for the report:
Product Analysis
- Product matrix, which gives a detailed comparison of the product portfolio of each company
Company Information
- Detailed analysis and profiling of additional market players (up to five)
Multifunctionality, compatibility with other ingredients, low cost, and abundant supply of food thickeners to drive the consumption growth of food thickeners, which, in turn, would drive the global market close to USD 15.80 billion by 2022
Food thickeners are food additives that increase the viscosity of a substance or a mixture while keeping its other properties unchanged. The most widely used food thickeners in the market are starches, followed by hydrocolloids, and proteins. Food thickeners are used in food applications such as bakery products, confectionery products, sauces, dressings, marinades & gravies, beverages, dairy & frozen desserts, and convenience & processed food.
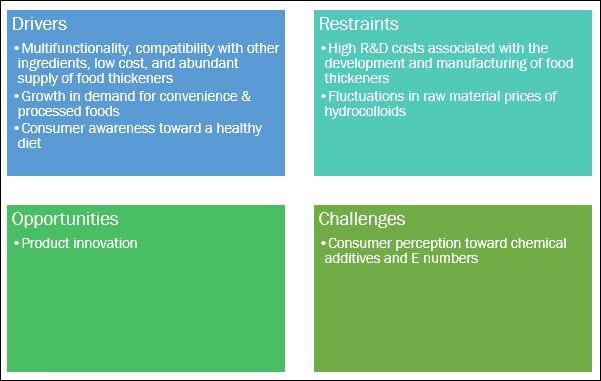
The growth of the market is driven by multifunctionality, compatibility with other ingredients, low cost, and abundant supply of food thickeners. The other key drivers for the market growth are rising demand for convenience & processed foods, and an increase in awareness toward a healthy diet.
High R&D costs associated with the development & manufacturing of food thickeners and fluctuations in raw material prices of hydrocolloids are the major restraints for the market.
Each food thickener works differently, depending upon the application. Hence, food thickener manufacturing companies should have a strong and dedicated R&D facility to develop food thickeners that are innovative and suitable to demanding product formulations. High R&D costs associated with the extraction and manufacture of vegetable gum and starch derivatives are restraining this market’s small and medium manufacturers. The extraction of thickening agent derivatives from new natural sources for physical and chemical applications in food & beverages has become a challenge for manufacturers. Several specific and technological factors such as crushing, sifting, centrifuging, and hydrolysis, need consideration and add to the manufacturing cost.
The price of hydrocolloid raw materials affects the price of food thickeners, which, in turn, impacts the price of the end food products. Hydrocolloids are mainly obtained from natural sources. Many thickening agent manufacturers increased the price of hydrocolloids in the last five to six years. For instance, in October 2011, Danisco announced that the global hydrocolloid price increased by 5% to 15% due to rise in raw material, energy, and logistic costs. The price of guar gum is fluctuating due to the poor harvesting of crops in Asian countries such as India and Pakistan. Consequently, many end-user companies have shifted to xanthan, an alternative of guar gum. Also, xanthan gum manufactured in China is facing anti-dumping tax, owing to their import and sales in the US market at a fairly low price. Thus, to protect the domestic manufacturing units (of xanthan gum), anti-dumping tax was imposed by the International Trade Administration, and the US Department of Commerce on xanthan gum imported from the People's Republic of China (PRC) for the period of July 19, 2013 through June 30, 2014. Thus, given the tremendous increase in the raw material prices, manufacturers are bound to increase the prices of hydrocolloids.
New and advanced innovations in thickening agents add more revenue to the global food thickeners market. For instance, in June 2015, scientists at Oregon State University discovered and commercialized a new type of dairy thickener, namely, Ropy 352. Ropy 352 may add probiotic characteristics to some of the products in which it is used. As per Oregon State University, it is estimated that the US spends up to USD 120 billion a year on probiotic products such as yogurt, sour cream, and buttermilk. There are many potential natural thickeners that are under examination or in the process of approval. For instance, cress seed gum is one of the potential food thickeners.
Market Dynamics
Leading Food Thickener Manufacturers are Offering Innovative Solutions for Existing and New Applications to Drive the Industry Forward.
Bakery products
Food thickeners are used in a variety of bakery products, a few of which include cakes, brownies, cookies, breads, and pizzas. Hydrocolloid-based food thickeners are generally used in bakery food applications followed by flour-based food thickeners. Hydrocolloids such as agars, guar gums, alginates, gellan gum, and gelatin are some of the most preferred thickening agents by bakery product manufacturers. Agars are partly sulfated polysaccharides that dissolve in water through gelation process and are used to make custard desserts, pies, tarts, and cookies. Further, guar gums and alginates are used in bakery applications such as bakery fillings, pies, cakes, and tarts.
Confectionery products
Hydrocolloids are usually used in confectionery products which mainly include jam, jelly, marmalade, chewing gum, and low sugar/calorie gels. Pectin is widely used as a food thickener in marmalades, jams, and jellies. Technologies such as anhydrous gum formulation are used to make chewing gums and to enhance the shelf life of the product. Ingredients such as clean label gelatin and clean label native starch are increasingly finding their usage in confectionery products as thickening agents. Though the market for these clean label ingredients is currently estimated to be very niche, increasing health awareness among consumers has resulted in significant demand and is an evolving trend in some of the developed countries such as the US, the UK, Germany, and France.
Sauces, dressings, marinades & gravies
Hydrocolloids are widely used as thickening agents in sauces, dressings, marinades & gravies. Alginates, locust bean gum, and starches are often used as replacements of synthetic wax such as sorbitan monostearate and polyoxyethylene. Alginates, locust bean gum, and xanthan gum function as thickeners in dressings, whereas starch performs best in sauces. Other thickeners such as gum arabic are also used as per availability of thickeners in sauces & dressing. Multifunctional flours are used as thickening agents for industrial sauce applications.
Beverages
Hydrocolloids such as xanthan gum, pectin, alginate, and CMC are widely used as food thickeners in various beverage applications. Apart from these, other thickeners such as gum arabic and arabino-galactan (bio-polymer) are also used by some beverage manufacturers. The mechanisms involved in the thickening process for beverages are suspension, cling, mouthfeel, pouring, pumping, and spraying. Around the world, food thickeners are generally used in fruit-based beverages. Artificial thickeners for fruit-based beverages are used minimally in developed countries; use of such artificial thickeners is a common practice in developing countries such as China, India, and other Southeast Asian countries.
Dairy & frozen desserts
Among hydrocolloids, guar gums from guar beans and carrageenans from red seaweed are widely used as food thickeners for dairy products. Carrageenans are used in ice creams and milk shakes, whereas guar gums are used in manufacturing yogurt and other milk products. Apart from these, agar, locust bean gum, and gellan gum are also used as thickening agents for beverages. Starches such as corn starch are highly preferred for thickening dairy-based sauces. Proteins such as sucrose esters of fatty acids are also used as food thickeners in dairy applications.
Convenience & processed foods
Convenience and processed food includes processed meat products, prepared meals, ready-to-eat products, ready-to-cook products, snacks, fruit preparations, and baby food. Food thickeners such as hydrocolloids are widely used in convenience foods to make the products more appealing and attractive. Agar, alginate, carrageenan, and guar gums are widely used as food thickeners in ready-to-eat and ready-to-cook food due to their multiple functionalities other than thickening, such as gelling, emulsifying, stabilization, and coating. Pectin is widely used in canned fruits, whereas starch finds usage in canned products. Starches are also used in convenience foods for their multiple benefits such as process stability, enhanced mouthfeel & appearance, and shelf life extension.
Key Questions
- The clean label food trend seems to be the way forward. With organic food ingredients gaining more traction, will the suppliers continue to explore new avenues for food thickeners? What could be the adjacencies?
- Most of the suppliers have opted expansions & investments as key strategies from the recent developments. Where will it take the industry in the mid to long term?
- Which are the substitute products and how big is the threat from them?
- What will be the prominent revenue-generating pockets for the market in the next five years?
The food thickeners market is driven by the growth in demand for convenience foods, consumer awareness toward healthy diet, and multiple functionalities and advantages associated with the use of food thickeners.
The global market, based on type, has been segmented into hydrocolloids, proteins, and starch. The market for starch dominated this market in 2015 and is also projected to be fastest-growing segment during the forecast period. The large consumption of starch as food thickeners is due to their easy availability and abundant supply across regions, and relatively lower price in comparison to other food thickeners, and optimum functionality. Furthermore, they do not to have any negative impact on the organoleptic properties of food products due to which they are preferred over other food thickeners.
The global food thickeners market, based on source, has been segmented into plant, animal, and microbial. The plant sourced food thickeners dominated the market in 2015, and is also the fastest-growing market during the forecast period. The dominance of this source of food thickeners is due to their cost effectiveness, abundant supply & ready availability with large number of suppliers, equal nutritional value at par with other sources, and greater acceptability by both vegan and non-vegan populations.
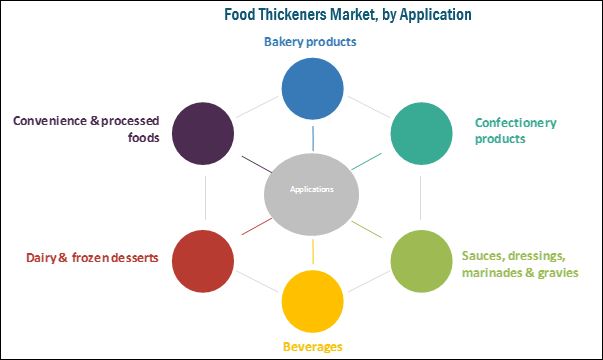
Food thickeners, by application, has been segmented into bakery, confectionery, sauces, dressings, marinades & gravies, beverages, dairy & frozen desserts, and convenience & processed foods. The dairy & frozen desserts application segment dominated the food thickeners market in 2015. This is due to the wide usage of food thickeners such as hydrocolloids, starch, and proteins, not only for thickening but also for other functional purposes such as flavor and texture enhancement in products. The beverages segment is projected to be the fastest-growing during the forecast period. A number of innovations in the beverage sector, coupled with additional properties of food thickeners such as fat replacement, water binding, emulsifying, and texturizing, are driving their use in the various beverage applications.
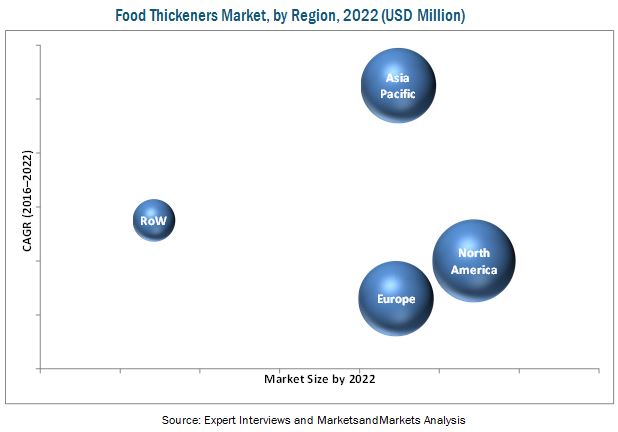
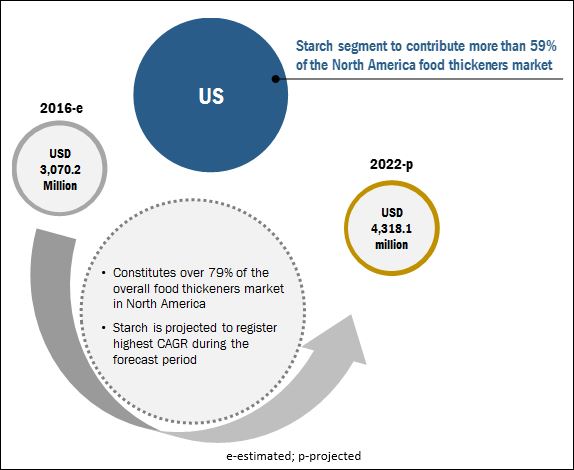
North America accounted for the largest market share in the food thickeners market. The dominant share of the North American region is attributed to its high consumption of hydrocolloids, proteins, and starch & starch derivatives in a diverse range of food & beverage applications. Asia-Pacific is projected to be the fastest-growing region. This is attributed to the growing volume consumption of various types of food thickeners in Asia-Pacific, as food & beverage manufacturers focus on product innovation, health aspects, and improving the functional characteristics such as texture, flavor, and other organoleptic properties of their products.
High R&D costs associated with the development and manufacturing of food thickeners and fluctuations in raw material prices of hydrocolloids are the major restraints for the market.
Some key players in the global food thickeners market include Cargill (U.S.), Archer Daniels Midland Company (U.S.), E. I. Du Pont De Nemours and Company (U.S.), Ingredion Incorporated (U.S.), and Kerry Group Plc (Ireland). Other companies such as Darling ingredients (U.S.), Tate & Lyle PLC (U.K.), Ashland Specialty Ingredients (U.S.), CP Kelco (U.S.), TIC Gums (U.S.), and Fuerst Day Lawson (U.K.) also have a significant market share in the food thickeners market. In 2016, Cargill set up a new innovation center in China named Cargill ONE. This would help the company to expand its expertise in taste, flavors, food ingredients, and menus that appeal to changing consumer demand in Asia.
To speak to our analyst for a discussion on the above findings, click Speak to Analyst
 Exclusive indicates content/data unique to MarketsandMarkets and not available with any competitors.
Table of Contents
1 Introduction (Page No. - 14)
1.1 Objectives of the Study
1.2 Market Definition
1.3 Markets Covered
1.4 Periodization Considered
1.5 Currency Considered
1.6 Stakeholders
1.7 Research Study Limitations
2 Research Methodology (Page No. - 18)
2.1 Research Data
2.1.1 Secondary Data
2.1.1.1 Key Data From Secondary Sources
2.1.2 Primary Data
2.1.2.1 Key Data From Primary Sources
2.2 Market Size Estimation
2.3 Market Breakdown & Data Triangulation
2.4 Research Assumptions
3 Executive Summary (Page No. - 26)
4 Premium Insights (Page No. - 30)
4.1 Attractive Opportunities in this Market
4.2 Food Thickeners Market: Major Countries
4.3 Developed vs Emerging Markets in Food Thickeners
4.4 Food Thickeners Market, By Application
4.5 Food Thickeners Market, By Type
4.6 Food Thickeners Market, By Source
4.7 Food Thickeners Market, By Type & Region
5 Food Thickeners Market Overview (Page No. - 37)
5.1 Introduction
5.2 Market Segmentation
5.2.1 Type
5.2.2 Source
5.2.3 Application
5.2.4 Region
5.3 Market Dynamics
5.3.1 Drivers
5.3.1.1 Multifunctionality, Compatibility With Other Ingredients, Low Cost, and Abundant Supply of Food Thickeners to Drive the Consumption Growth of Food Thickeners
5.3.1.2 Growth in the Demand for Convenience & Processed Foods
5.3.1.3 Consumer Awareness Toward A Healthy Diet
5.3.2 Restraints
5.3.2.1 High R&D Costs Associated With the Development and Manufacturing of Food Thickeners
5.3.2.2 Fluctuations in Raw Material Prices of Hydrocolloids
5.3.3 Opportunities
5.3.3.1 New Product Innovation
5.3.4 Challenges
5.3.4.1 Consumer Perception Toward Chemical Additives and E Numbers
6 Industry Trends (Page No. - 47)
6.1 Introduction
6.2 Supply Chain Analysis
6.3 Regulatory Environment
6.4 U.S.
6.5 Canada
6.6 Europe
6.7 Japan
7 Food Thickeners Market, By Type (Page No. - 62)
7.1 Introduction
7.2 Hydrocolloids
7.2.1 Gelatin
7.2.2 Xanthan Gum
7.2.3 Carrageenan
7.2.4 Alginate
7.2.5 Agar
7.2.6 Pectin
7.2.7 Guar Gum
7.2.8 Carboxymethyl Cellulose (CMC)
7.2.9 Other Types
7.3 Protein
7.4 Starch
8 Food Thickeners Market, By Source (Page No. - 80)
8.1 Introduction
8.2 Plant
8.3 Animal
8.4 Microbial
9 Food Thickeners Market, By Application (Page No. - 85)
9.1 Introduction
9.2 Bakery
9.3 Confectionery
9.4 Sauces, Dressings, Marinades & Gravies
9.5 Beverages
9.6 Dairy & Frozen Desserts
9.7 Convenience & Processed Foods
10 Food Thickeners Market, By Region (Page No. - 92)
10.1 Introduction
10.2 North America
10.2.1 U.S.
10.2.2 Canada
10.2.3 Mexico
10.3 Europe
10.3.1 Germany
10.3.2 France
10.3.3 U.K.
10.3.4 Italy
10.3.5 Spain
10.3.6 Rest of Europe
10.4 Asia-Pacific
10.4.1 China
10.4.2 Japan
10.4.3 India
10.4.4 Australia
10.4.5 Rest of Asia-Pacific
10.5 Rest of the World (RoW)
10.5.1 Latin America
10.5.2 Africa
10.5.3 Middle East
11 Competitive Landscape (Page No. - 121)
11.1 Overview
11.2 Food Thickners Market Share Analysis (Value), By Key Player, 2015
11.3 Competitive Situations & Trends
11.4 Expansions & Investments
11.5 Acquisitions
11.6 Joint Ventures & Agrrements
11.7 New Product Launches
12 Company Profiles (Page No. - 130)
(Company at A Glance, Recent Financials, Products & Services, Strategies & Insights, & Recent Developments)*
12.1 Introduction
12.2 Cargill
12.3 Archer Daniels Midland Company
12.4 E. I. Du Pont De Nemours and Company
12.5 Ingredion Incorporated
12.6 Tate & Lyle PLC
12.7 Darling Ingredients Inc.
12.8 Kerry Group PLC
12.9 Ashland Specialty Ingredients
12.10 CP Kelco
12.11 TIC Gums, Inc.
12.12 Fuerst Day Lawson Ltd.
*Details on Company at A Glance, Recent Financials, Products & Services, Strategies & Insights, & Recent Developments Might Not Be Captured in Case of Unlisted Companies.
13 Appendix (Page No. - 161)
13.1 Discussion Guide
13.2 Knowledge Store: Marketsandmarkets’ Subscription Portal
13.3 Recent Developments
13.4 Introducing RT: Real-Time Market Intelligence
13.5 Available Customizations
13.6 Related Reports
13.7 Author Details
List of Tables (91 Tables)
Table 1 Global Market Snapshot, By Value
Table 2 Food Thickeners: an Overview of Their Basic Properties
Table 3 Food Thickeners Market Size, By Type, 2014–2022 (USD Million)
Table 4 Hydrocolloids Market Size, By Type, 2014–2022 (USD Million)
Table 5 Other Hydrocolloids Market Size, By Type, 2014–2022 (USD Million)
Table 6 Hydrocolloids Market Size, By Region, 2014–2022 (USD Million)
Table 7 North America: Hydrocolloids Market Size, By Country, 2014–2022 (USD Million)
Table 8 Europe: Hydrocolloids Market Size, By Country, 2014–2022 (USD Million)
Table 9 Asia-Pacific: Hydrocolloids Market Size, By Country, 2014–2022 (USD Million)
Table 10 RoW: Hyrdocolloids Market Size, By Region, 2014–2022 (USD Million)
Table 11 Gelatin Market Size, By Region, 2014–2022 (USD Million)
Table 12 Xanthan Gum Market Size, By Region, 2014–2022 (USD Million)
Table 13 Carrageenan Market Size, By Region, 2014–2022 (USD Million)
Table 14 Alginate Market Size, By Region, 2014–2022 (USD Million)
Table 15 Agar Market Size, By Region, 2014–2022 (USD Million)
Table 16 Pectin Market Size, By Region, 2014–2022 (USD Million)
Table 17 Guar Gum Market Size, By Region, 2014–2022 (USD Million)
Table 18 Carboxymethyl Cellulose Market Size, By Region, 2014–2022 (USD Million)
Table 19 Other Types Market Size, By Region, 2014–2022 (USD Million)
Table 20 Protein Market Size, By Region, 2014–2022 (USD Million)
Table 21 North America: Protein Market Size, By Country, 2014–2022 (USD Million)
Table 22 Europe: Protein Market Size, By Country, 2014–2022 (USD Million)
Table 23 Asia-Pacific: Protein Market Size, By Country, 2014–2022 (USD Million)
Table 24 RoW: Protein Market Size, By Region, 2014–2022 (USD Million)
Table 25 Starch Market Size, By Region, 2014–2022 (USD Million)
Table 26 North America: Starch Market Size, By Country, 2014–2022 (USD Million)
Table 27 Europe: Starch Market Size, By Country, 2014–2022 (USD Million)
Table 28 Asia-Pacific: Starch Market Size, By Country, 2014–2022 (USD Million)
Table 29 RoW: Starch Market Size, By Region, 2014–2022 (USD Million)
Table 30 Food Thickeners Market Size, By Source, 2014–2022 (USD Million)
Table 31 Plant-Based Food Thickeners Market Size, By Region, 2014–2022 (USD Million)
Table 32 Animal-Based Food Thickeners Market Size, By Region, 2014–2022 (USD Million)
Table 33 Microbe-Based Food Thickeners Market Size, By Region, 2014–2022 (USD Million)
Table 34 Food Thickeners Market Size, By Application, 2014–2022 (USD Million)
Table 35 Market Size for Bakery Products, By Region, 2014–2022 (USD Million)
Table 36 Market Size for Confectionery Products, By Region, 2014–2022 (USD Million)
Table 37 Food Thickeners Market Size for Sauces, Dressings, Marinades & Gravies, By Region, 2014–2022 (USD Billion)
Table 38 Food Thickeners Market Size for Beverages, By Region, 2014–2022 (USD Million)
Table 39 Market Size for Dairy & Frozen Desserts, By Region, 2014–2022 (USD Million)
Table 40 Market Size for Convenience & Processed Foods, By Region, 2014–2022 (USD Million)
Table 41 Food Thickeners Market Size, By Region, 2014–2022 (USD Million)
Table 42 North America: Food Thickeners Market Size, By Country, 2014-2022, (USD Million)
Table 43 North America: Food Thickeners Market Size, By Type, 2014–2022 (USD Million)
Table 44 Hydrocolloids Market Size, By Type, 2014–2022 (USD Million)
Table 45 Other Hydrocolloids Market Size, By Type, 2014–2022 (USD Million)
Table 46 North America: Food Thickeners Market Size, By Source, 2014–2022 (USD Million)
Table 47 North America: Food Thickeners Market Size, By Application, 2014–2022 (USD Million)
Table 48 U.S.: Food Thickeners Market Size, By Type, 2014-2022, (USD Million)
Table 49 Canada: Food Thickeners Market Size, By Type, 2014-2022, (USD Million)
Table 50 Mexico: Food Thickeners Market Size, By Type, 2014-2022, (USD Million)
Table 51 Europe: Food Thickeners Market Size, By Country, 2014–2022 (USD Million)
Table 52 Europe: Food Thickeners Market Size, By Type, 2014–2022 (USD Million)
Table 53 Europe: Hydrocolloids Market Size, By Type, 2014–2022 (USD Million)
Table 54 Europe: Other Hydrocolloids Market Size, By Type, 2014–2022 (USD Million)
Table 55 Europe: Food Thickeners Market Size, By Source, 2014–2022 (USD Million)
Table 56 Europe: Food Thickeners Market Size, By Application, 2014–2022 (USD Million)
Table 57 Germany: Food Thickeners Market Size, By Type, 2014–2022 (USD Million)
Table 58 France: Food Thickeners Market Size, By Type, 2014–2022 (USD Million)
Table 59 U.K.: Food Thickeners Market Size, By Type, 2014–2022 (USD Million)
Table 60 Italy: Food Thickeners Market Size, By Type, 2014–2022 (USD Million)
Table 61 Spain: Food Thickeners Market Size, By Type, 2014–2022 (USD Million)
Table 62 Rest of Europe: Food Thickeners Market Size, By Type, 2014–2022 (USD Million)
Table 63 Asia-Pacific: Food Thickeners Market Size, By Country, 2014–2022 (USD Million)
Table 64 Asia-Pacific: Food Thickeners Market Size, By Type, 2014–2022 (USD Million)
Table 65 Asia-Pacific: Hydrocolloids Market Size, By Type, 2014–2022 (USD Million)
Table 66 Asia-Pacific: Other Hydrocolloids Market Size, By Type, 2014–2022 (USD Million)
Table 67 Asia-Pacific: Food Thickeners Market Size, By Source, 2014–2022 (USD Million)
Table 68 Asia-Pacific: Food Thickeners Market Size, By Application, 2014–2022 (USD Million)
Table 69 China: Food Thickeners Market Size, By Type, 2014–2022 (USD Million)
Table 70 Japan: Food Thickeners Market Size, By Type, 2014–2022 (USD Million)
Table 71 India: Food Thickeners Market Size, By Type, 2014–2022 (USD Million)
Table 72 Australia: Food Thickeners Market Size, By Type, 2014–2022 (USD Million)
Table 73 Rest of Asia-Pacific: Food Thickeners Market Size, By Type, 2014–2022 (USD Million)
Table 74 RoW: Food Thickeners Markets Size, By Region, 2014-2022 (USD Million)
Table 75 RoW: Food Thickeners Market Size, By Type, 2014–2022 (USD Million)
Table 76 Hydrocolloids: RoW Food Thickeners Market Size, By Type, 2014–2022 (USD Million)
Table 77 Other Hydrocolloids: RoW Food Thickeners Market Size, By Type, 2014–2022 (USD Million)
Table 78 RoW: Food Thickeners Market Size, By Form, 2014–2022 (USD Million)
Table 79 RoW: Food Thickeners Market Size, By Application, 2014–2022 (USD Million)
Table 80 Latin America: RoW Food Thickeners Market Size, By Type, 2014-2022 (USD Million)
Table 81 Africa: RoW Food Thickeners Markets Size, By Type, 2014-2022 (USD Million)
Table 82 Middle East: RoW Food Thickeners Market Size, By Type, 2014-2022 (USD Million)
Table 83 Expansion & Investments, 2011–2016
Table 84 Acquisitions, 2011–2016
Table 85 Joint Ventures & Agreements, 2011–2016
Table 86 New Product Launches, 2011–2016
Table 87 Cargill: Products Offered
Table 88 Archer Daniels Midland Company: Products Offered
Table 89 Ingredion Incorporated: Products Offered
Table 90 Ashland Specialty Ingredients: Products Offered
Table 91 TIC Gums, Inc.: Products Offered
List of Figures (48 Figures)
Figure 1 Food Thickeners Market Segmentation
Figure 2 Geographic Scope
Figure 3 Food Thickeners: Research Design
Figure 4 Food Thickeners Market Size Estimation Methodology: Bottom-Up Approach
Figure 5 Market Size Estimation Methodology: Top-Down Approach
Figure 6 Data Triangulation
Figure 7 Food Thickeners Market Size, By Application, 2016–2022 (USD Million)
Figure 8 Market Size, By Type, 2016–2022 (USD Million)
Figure 9 Market Size, By Source, 2016–2022 (USD Million)
Figure 10 Asia-Pacific Projected to Be the Fastest-Growing Market Through 2022
Figure 11 An Emerging Market With Promising Growth Potential, 2016–2022 (USD Million)
Figure 12 India and China are Projected to Be the Fastest-Growing Markets
Figure 13 China and India are Projected to Be Emerging Markets
Figure 14 Dairy & Frozen Desserts Projected to Be the Largest Segment Throughout the Forecast Period, 2016 to 2022
Figure 15 Starch Segment Would Be the Largest Market During the Forecast Period, 2016 to 2022
Figure 16 Plant Segment Would Be the Largest Market During the Forecast Period, 2016 to 2022
Figure 17 Starch Segment is Projected to Be Largest and Fastest Growing Market, 2016–2022
Figure 18 Food Thickeners Market, By Type
Figure 19 Market, By Source
Figure 20 Market, By Application
Figure 21 Food Thickeners Market, By Region
Figure 22 Market Dynamics: Food Thickeners
Figure 23 Food Consumption Data, By Type, 2016
Figure 24 Food Thickeners: Supply Chain
Figure 25 Food Thickeners Market Share (Value), By Type, 2016–2022
Figure 26 Market Share (Value), By Source, 2016–2022
Figure 27 Market Share, By Application, 2016–2022
Figure 28 U.S. Accounted for the Largest Share in the Global Market in 2015
Figure 29 North American Food Thickeners Market: U.S. is Estimated to Lead the Market in 2016
Figure 30 Asia-Pacific Food Thickeners Market Snapshot: China is Expected to Hold the Largest Share in 2016
Figure 31 Expansions & Investments: Leading Approaches of Key Companies, 2011–2016
Figure 32 Food Thickners Market, 2015
Figure 33 Expanding Revenue Base Through New Product Launches, 2014–2016
Figure 34 Expansions & Investments: the Key Strategy, 2011–2016
Figure 35 Geographic Revenue Mix of Top Market Players
Figure 36 Cargill: Company Snapshot
Figure 37 Cargill: SWOT Analysis
Figure 38 Archer Daniels Midland Company: Company Snapshot
Figure 39 Archer Daniels Midland Company: SWOT Analysis
Figure 40 E. I. Du Pont De Nemours and Company : Company Snapshot
Figure 41 E.I. Dupont De Nemours and Company: SWOT Analysis
Figure 42 Ingredion Incorporated: Company Snapshot
Figure 43 Ingredion Incorporated: SWOT Analysis
Figure 44 Tate & Lyle PLC: Company Snapshot
Figure 45 Tate& Lyle PLC: SWOT Analysis
Figure 46 Darling Ingredients Inc.: Company Snapshot
Figure 47 Kerry Group PLC : Company Snapshot
Figure 48 Ashland Specialty Ingredients: Company Snapshot


Growth opportunities and latent adjacency in Food Thickeners Market