Multiplex Assays Market by Product & Service (Consumables, Instruments, Software & Services), Type (Nucleic Acid, Protein), Technology (Flow Cytometry, Luminescence), Application (R&D, Diagnosis), End User (Pharma, Hospitals) - Global Forecast to 2027
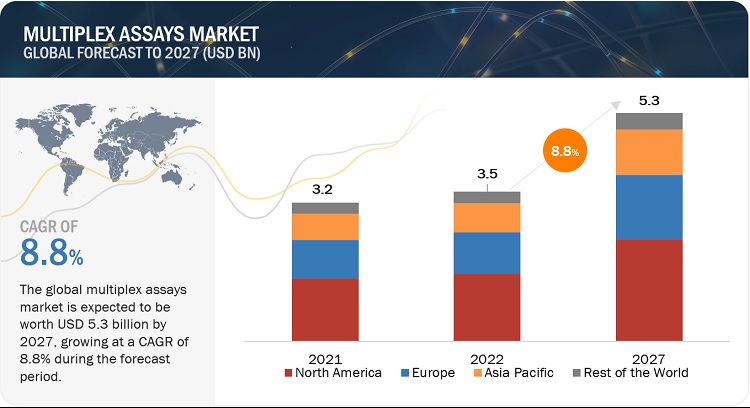
The global multiplex assays market, valued at US$3.2 billion in 2021, stood at US$3.5 billion in 2022 and is projected to advance at a resilient CAGR of 8.8% from 2022 to 2027, culminating in a forecasted valuation of US$5.3 billion by the end of the period. The new research study consists of an industry trend analysis of the market. The new research study consists of industry trends, pricing analysis, patent analysis, conference and webinar materials, key stakeholders, and buying behaviour in the market. The need for automated and efficient systems in laboratories has grown, as conventional methods for testing are inadequate. This provides opportunities for the adoption of multiplex assays, with their potential for automation, convenience, accuracy, and reproducibility. Bead-based microplate assays provide a greater surface area for binding with lower background signals than traditional ELISA, while the beads can be coded and used in multiplex assays, which measure multiple analytes in a single-microplate well to reduce the overall cost and time per assay.
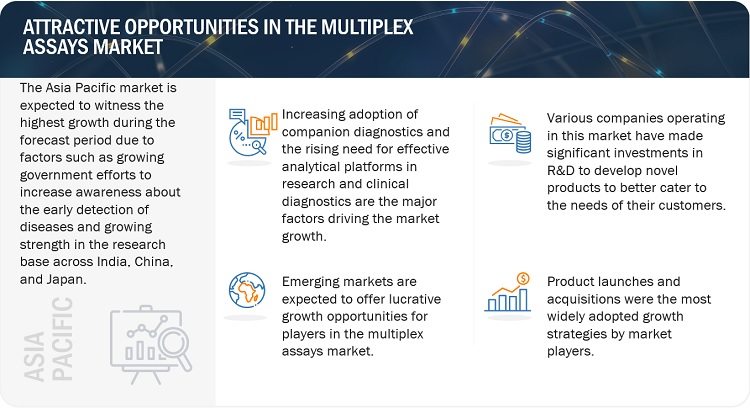
Attractive Opportunities in the Multiplex Assays Market
To know about the assumptions considered for the study, Request for Free Sample Report
Multiplex Assays Market Dynamics
DRIVER: Increasing advantages of multiplex assays over singleplex and traditional assays
As the name suggests, singleplex assays can only handle a single test at a time and require a higher sample volume. In multi-analyte studies, they need to be repeated for each analyte using new reagents and fresh samples, which increases the time taken and the costs incurred, and this also renders the process inefficient. In contrast, multiplex assays can handle several analytes simultaneously. The speed and efficacy of multiplex assays make them more adaptable for automation. In addition, their high throughput, accuracy, and reproducibility have also driven their adoption.
OPPORTUNITY: Increased focus on the need for high-throughput and automated systems
Of the various economic and regulatory impacts on the global healthcare industry, a major impact felt by the industry is the rising pressure for healthcare cost reduction. The Clinical Laboratory Fee Schedule (CLFS) was reformed under the Protecting Access to Medicare Act of 2014 (PAMA), which led to stringent inspection over test fees charged by laboratories and the actual cost of the test incurred by laboratories. This resulted in a reduction in clinical lab fees, affecting the fund flow of laboratories. In turn, laboratories need to maintain this fund flow by increasing the volume of tests but not compromising on the quality of tests. Moreover, laboratories are unable to serve the rapidly growing patient population owing to inadequate human resources.
Due to these challenges, the need for automated and efficient systems in laboratories has grown, as conventional methods for testing are inadequate.
RESTRAINT: Rising costs of equipment
While multiplex technology substantially saves operational costs and time, the initial investment in multiplex assay equipment is high. Despite long-term savings and advantages, the initial investment costs may restrain the small-scale use of multiplex assays to a certain extent. The variable costs of the reagents needed, and those fixed by the suppliers thereof, add to the overall expenditure. Furthermore, maintenance and insurance, laboratory supervision, and overhead costs (including utilities, space, and administration) are also additional expenses. As a result, high instrument cost is a major factor limiting the wider adoption of multiplex assays.
CHALLENGE: Increasing dearth of skilled professionals
The increase in the dearth of a skilled workforce has been a challenge for several decades, resulting in the rise of an aging workforce and declining enrolment in training programs. It takes almost five to ten years of continuous practice in clinical laboratory work for technicians to gain expertise. Europe and the UK have already reported low numbers of clinical technicians.
Consumables segment accounted for the largest share of the multiplex assays market, by product & service
The market is segmented into consumables, instruments, and software & services based on product & service. The consumables segment accounted for the largest share of the market in 2022, mainly due to the recurrent purchase of consumables for increasing research & clinical diagnostic applications.
In 2022, protein multiplex assays segment accounted for the largest share in the multiplex assays market, by type
The market is segmented into protein, nucleic acid, and cell-based multiplex assays by type. In 2022, the protein multiplex assays segment accounted for largest share of the market, mainly due to the increased usage of protein-based assays for biomarker research and clinical diagnostics.
In 2022, pharmaceutical & biotechnology companies segment accounted for the largest share in the multiplex assays market, by end user
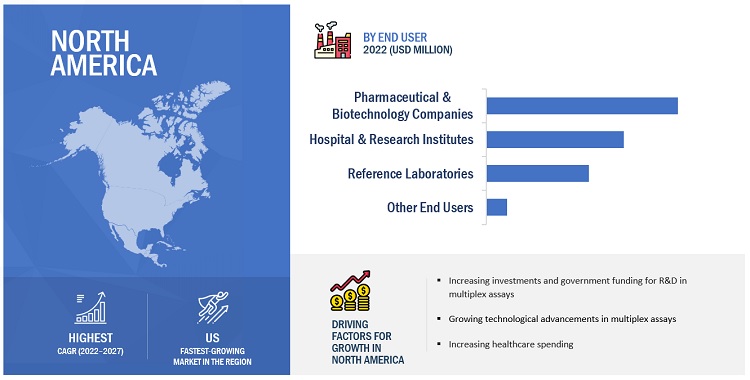
The market is segmented into pharmaceutical & biotechnology companies, hospitals & research institutes, reference laboratories, and other end users. In 2022, the pharmaceutical & biotechnology segment accounted for the largest share of the market. Multiplex assays are widely used in the pharmaceutical industry for clinical pharmacokinetics and bioequivalence studies in drug discovery. This can be attributed to the inherent specificity, high throughput, and high sensitivity offered by immunoassays for a wide range of analytes in biological samples.
North America is the largest regional market for multiplex assays market in 2022
The global market has been segmented into four major regions—North America, Europe, the Asia Pacific, and the Rest of the World (RoW). In 2022, North America accounted for the largest share of 45.1% of the global market, followed by Europe with a share of 27.8%. The high burden of infections and cancers on regional healthcare systems is another major driver for market growth. Furthermore, the presence of a well-developed healthcare infrastructure and the growing adoption of advanced technologies for cancer testing and infectious disease testing are other factors anticipated to support the growth of the market in the region. Over the years, healthcare spending in North America has increased at a significant rate. National health spending is projected to grow at an average annual rate of 5.4% during 2019–2028 and reach USD 6.2 trillion by 2028 (Source: Centers for Medicare & Medicaid Services). The growing healthcare expenditure is also one of the major drivers for the biotechnology sector.
To know about the assumptions considered for the study, download the pdf brochure
The major players in this market are Illumina, Inc. (US), Thermo Fisher Scientific, Inc. (US), Bio-Rad Laboratories, Inc. (US), Becton, Dickinson and Company (US), and DiaSorin S.p.A. (Italy). These players lead the market because of their extensive product portfolios and wide geographic presence. These dominant market players also have numerous advantages, such as more robust marketing and distribution networks, larger budgets for R&D, and better brand recognition.
Multiplex Assays Market Report Scope
|
Report Metrics |
Details |
|
Market Revenue in 2022 |
$3.5 billion |
|
Projected Revenue in 2027 |
$5.3 billion |
|
Revenue Rate |
Poised to grow at a CAGR of 8.8% |
|
Market Driver |
Increasing advantages of multiplex assays over singleplex and traditional assays |
|
Market Opportunity |
Increased focus on the need for high-throughput and automated systems |
This report categorizes the advanced wound care market to forecast revenue and analyze trends in each of the following submarkets:
By Product & Service
- Consumables
- Instruments
- Software & Services
By Type
-
Protein Multiplex Assays
- Planar Protein Assays
- Bead-based Protein Assays
- Other Protein Assays
-
Nucleic Acid Multiplex Assays
- Planar Nucleic Acid Assays
- Bead-based Nucleic Acid Assays
- Other Nucleic Acid Assays
- Cell-based Multiplex Assays
By Technology
- Flow Cytometry
- Fluorescence Detection
- Luminescence
- Multiplex Real-time PCR
- Other Technologies
By Application
-
Research & Development
- Drug Discovery & Development
- Biomarker Discovery & Validation
-
Clinical Diagnostics
- Infectious Diseases
- Cancer
- Cardiovascular Diseases
- Autoimmune Diseases
- Nervous System Disorders
- Metabolism & Endocrinology Disorders
- Other Diseases
By End User
- Pharmaceutical & Biotechnology Companies
- Hospitals & Research Institutes
- Reference Laboratories
- Other End Users
By Region
- North America
- US
- Canada
- Europe
- Asia Pacific
- Rest of the World
Recent Developments
- In September 2021, Bio-Rad Laboratories launched its Bio-Plex Pro Human IgA and IgM SARS-CoV-2 panels to detect IgA and IgM antibodies against four SARS-CoV-2 antigens. The panels are for research use only (RUO).
- In September, DiaSorin S.p.A. received the CE mark approval for its Simplexa COVID-19 & Flu A/B Direct kit, a multiplex test for the in vitro qualitative detection and differentiation of nucleic acid from severe acute respiratory syndrome coronavirus 2 (SARS-CoV-2), influenza A virus, and influenza B virus from the same patient sample in one reaction well. The assay is designed for use on the LIAISON MDX and is run directly from nasopharyngeal swabs (NPS) without the need for offboard extraction.
- In August 2021, Becton, Dickinson and Company launched its new and fully automated high-throughput diagnostic system, BD COR System. The system uses robotics and sample management software algorithms to set a new standard in automation for infectious disease molecular testing in core laboratories and other centralized laboratories in the US.
- In July 2021, DiaSorin S.p.A. acquired the leading company of multiplex assays, Luminex Corporation, for a price of USD 37.00 per share, that corresponds to a total equity value of approximately USD 1.8 billion.
- In February 2021, Thermo Fisher Scientific acquired Mesa Biotech, a privately-held point-of-care molecular diagnostic company. This acquisition strengthened Thermo Fisher's operational excellence, access to raw materials, and existing distribution & sales channels with Mesa's innovative platform with a diverse array of diagnostic products, such as Accula System by Mesa Biotech that is dedicated to COVID-19 testing.
Frequently Asked Questions (FAQ):
What is the projected market revenue value of the multiplex assays market?
The multiplex assays market boasts a total revenue value of $5.3 billion by 2027.
What is the estimated growth rate (CAGR) of the multiplex assays market?
The global market for multiplex assays has an estimated compound annual growth rate (CAGR) of 8.8% and a revenue size in the region of $3.5 billion in 2022.
To speak to our analyst for a discussion on the above findings, click Speak to Analyst


- 5.1 INTRODUCTION
-
5.2 MARKET DYNAMICSDRIVERS- Increasing use of multiplex assays in companion diagnostics- Increasing advantages over singleplex and traditional assays- Increasing incidence of chronic and infectious diseases and growing awareness about early disease diagnosisRESTRAINTS- Rising costs of equipment- Growing number of stringent regulations and standardsOPPORTUNITIES- Increasing validation of biomarkers in molecular and protein diagnostics- Rising need for high-throughput and automated systemsCHALLENGES- Increasing dearth of skilled professionals
- 5.3 CUSTOMIZATION DATA
- 6.1 INTRODUCTION
-
6.2 PRIMARY NOTESKEY INDUSTRY INSIGHTS
-
6.3 CONSUMABLESRECURRENT REQUIREMENTS AND PURCHASES OF CONSUMABLES TO DRIVE MARKET
-
6.4 INSTRUMENTSLAUNCH OF TECHNOLOGICALLY ADVANCED INSTRUMENTS TO SUPPORT MARKET GROWTH
-
6.5 SOFTWARE & SERVICESINCREASING NEED FOR EFFECTIVE DATA MANAGEMENT WITHIN LABORATORIES TO FUEL UPTAKE OF ADVANCED SOFTWARE
- 7.1 INTRODUCTION
-
7.2 PROTEIN MULTIPLEX ASSAYSPLANAR PROTEIN ASSAYS- Pivotal role in drug discovery to support uptakeBEAD-BASED PROTEIN ASSAYS- Best suited to study protein-protein interactionsOTHER PROTEIN ASSAYS
-
7.3 NUCLEIC ACID MULTIPLEX ASSAYSPLANAR NUCLEIC ACID ASSAYS- Planar multiplex assays preferred in gene expression analysis, SNP genotyping, and transcriptome analysisBEAD-BASED NUCLEIC ACID ASSAYS- Increasing infectious diseases and genetic screening tests to drive marketOTHER NUCLEIC ACID ASSAYS
-
7.4 CELL-BASED MULTIPLEX ASSAYSBETTER VARIABILITY THAN BIOCHEMICAL-BASED ASSAYS TO DRIVE MARKET
- 8.1 INTRODUCTION
-
8.2 FLOW CYTOMETRYWIDE APPLICATIONS IN PROTEIN EXPRESSION, RNA, AND CELL HEALTH STATUS TO MAKE THIS MARKET SEGMENT LARGEST
-
8.3 FLUORESCENCE DETECTIONINCREASING USE OF MICROARRAY SCANNERS AND FLUORESCENCE MICROSCOPES TO FUEL GROWTH
-
8.4 LUMINESCENCERAPID AND EASY-TO-USE BENEFITS OF LUMINESCENCE TECHNOLOGY TO DRIVE MARKET
-
8.5 MULTIPLEX REAL-TIME PCRHIGH SPECIFICITY AND SENSITIVITY OF MULTIPLEX REAL-TIME PCR TO DRIVE ADOPTION OF MULTIPLEX ASSAYS
- 8.6 OTHER TECHNOLOGIES
- 9.1 INTRODUCTION
-
9.2 RESEARCH & DEVELOPMENTDRUG DISCOVERY & DEVELOPMENT- Multiplex assays massively employed in preclinical and clinical phasesBIOMARKER DISCOVERY & VALIDATION- Multiplex assays aid in quantitative measurement of protein biomarkers in large samples
-
9.3 CLINICAL DIAGNOSTICSINFECTIOUS DISEASES- Growing prevalence of infectious diseases to drive uptake of multiplex assaysCANCER- Rising burden of cancer to drive marketCARDIOVASCULAR DISEASES- High burden of cardiovascular diseases to support market growthAUTOIMMUNE DISEASES- High incidence and prevalence of autoimmune diseases to drive demand for measures promoting early diagnosisNERVOUS SYSTEM DISORDERS- Growing prevalence of nervous system disorders to fuel uptake of multiplex assays for early diagnosis and treatmentMETABOLISM & ENDOCRINOLOGY DISORDERS- Multiplex assays used to measure endocrine and metabolic biomarkers that help in timely diagnosis of such conditionsOTHER DISEASES
- 10.1 INTRODUCTION
-
10.2 PHARMACEUTICAL & BIOTECHNOLOGY COMPANIESGROWING DEMAND FOR MULTIPLEX ASSAYS IN DRUG DISCOVERY & CLINICAL STUDIES TO DRIVE ITS UPTAKE
-
10.3 HOSPITALS & RESEARCH INSTITUTESINCREASING NUMBER OF HOSPITALS TO DRIVE MARKET
-
10.4 REFERENCE LABORATORIESGROWING NUMBER OF CLINICAL TESTS PERFORMED IN REFERENCE LABORATORIES AND INCREASING NUMBER OF ACCREDITED LABORATORIES TO SUPPORT MARKET GROWTH
- 10.5 OTHER END USERS
- 11.1 INTRODUCTION
-
11.2 NORTH AMERICARECESSION IMPACT ON NORTH AMERICAUS- Increasing prevalence of infectious diseases and cancer to drive marketCANADA- Increased funding activities by government in life sciences research & drug development to support market growth
-
11.3 EUROPERECESSION IMPACT ON EUROPE
-
11.4 ASIA PACIFICRECESSION IMPACT ON ASIA PACIFIC
-
11.5 REST OF THE WORLDRECESSION IMPACT ON REST OF THE WORLD

- 12.1 OVERVIEW
-
12.2 STRATEGIES ADOPTED BY KEY PLAYERSOVERVIEW OF STRATEGIES ADOPTED BY PLAYERS
- 12.3 REVENUE SHARE ANALYSIS OF TOP MARKET PLAYERS
-
12.4 MARKET SHARE ANALYSISMULTIPLEX ASSAYS MARKET
-
12.5 COMPANY EVALUATION QUADRANTLIST OF EVALUATED VENDORSSTARSEMERGING LEADERSPERVASIVE PLAYERSPARTICIPANTS
-
12.6 COMPETITIVE LEADERSHIP MAPPING FOR START-UPS/SMES (2021)PROGRESSIVE COMPANIESSTARTING BLOCKSRESPONSIVE COMPANIESDYNAMIC COMPANIES
-
12.7 COMPETITIVE SCENARIOPRODUCT LAUNCHES & REGULATORY APPROVALSDEALS
-
13.1 KEY PLAYERSILLUMINA, INC.- Business overview- Products offered- Recent developments- MnM viewBIO-RAD LABORATORIES, INC.- Business overview- Products offered- Recent developments- MnM viewTHERMO FISHER SCIENTIFIC, INC.- Business overview- Products offered- Recent developments- MnM viewBECTON, DICKINSON AND COMPANY- Business overview- Products offered- Recent developments- MnM viewDIASORIN S.P.A.- Business overview- Products offered- Recent developments- MnM viewQIAGEN N.V.- Business overview- Products offered- Recent developmentsABCAM PLC- Business overview- Products offered- Recent developmentsMERCK KGAA- Business overview- Products offered- Recent developmentsAGILENT TECHNOLOGIES, INC.- Business overview- Products offered- Recent developmentQUANTERIX- Business overview- Products offered- Recent developmentsBIO-TECHNE- Business overview- Products offered- Recent developmentsMESO SCALE DIAGNOSTICS, LLC- Business overview- Products offered- Recent developmentsRANDOX LABORATORIES LTD.- Business overview- Products offered- Recent developments
-
13.2 OTHER PLAYERSOLINKSEEGENE INC.SIEMENS HEALTHINEERS AGPERKINELMER INC.SHIMADZU CORPORATIONPROMEGA CORPORATIONENZO BIOCHEM INC.CAYMAN CHEMICALBOSTER BIOLOGICAL TECHNOLOGYANTIGENIX AMERICA, INC.QUANSYS BIOSCIENCES INC.RAYBIOTECH LIFE, INC.
- 14.1 DISCUSSION GUIDE
- 14.2 KNOWLEDGESTORE: MARKETSANDMARKETS’ SUBSCRIPTION PORTAL
- 14.3 CUSTOMIZATION OPTIONS
- 14.4 RELATED REPORTS
- 14.5 AUTHOR DETAILS
- TABLE 1 TOTAL HEALTH EXPENDITURE DUE TO DIABETES (20–79 YEARS) IN 2021, BY COUNTRY
- TABLE 2 GLOBAL INCIDENCE OF INFECTIOUS DISEASES
- TABLE 3 APPROVED AND LAUNCHED MULTIPLEX ASSAYS FOR DIAGNOSIS OF SARS-COV-2
- TABLE 4 NUMBER OF LAB TECHNOLOGISTS AND TECHNICIANS IN US, 2020
- TABLE 5 MULTIPLEX ASSAYS MARKET, BY APPLICATION, 2020–2027 (USD MILLION)
- TABLE 6 MULTIPLEX ASSAYS MARKET, BY PRODUCT & SERVICE, 2020–2027 (USD MILLION)
- TABLE 7 MULTIPLEX ASSAY CONSUMABLES MARKET, BY REGION, 2020–2027 (USD MILLION)
- TABLE 8 NORTH AMERICA: MULTIPLEX ASSAY CONSUMABLES MARKET, BY COUNTRY, 2020–2027 (USD MILLION)
- TABLE 9 MULTIPLEX ASSAY INSTRUMENT MARKET, BY REGION, 2020–2027 (USD MILLION)
- TABLE 10 NORTH AMERICA: MULTIPLEX ASSAY INSTRUMENTS MARKET, BY COUNTRY, 2020–2027 (USD MILLION)
- TABLE 11 MULTIPLEX ASSAY SOFTWARE & SERVICES MARKET, BY REGION, 2020–2027 (USD MILLION)
- TABLE 12 NORTH AMERICA: MULTIPLEX ASSAY SOFTWARE & SERVICES MARKET, BY COUNTRY, 2020–2027 (USD MILLION)
- TABLE 13 MULTIPLEX ASSAYS MARKET, BY TYPE, 2020–2027 (USD MILLION)
- TABLE 14 PROTEIN MULTIPLEX ASSAYS MARKET, BY TYPE, 2020–2027 (USD MILLION)
- TABLE 15 PROTEIN MULTIPLEX ASSAYS MARKET, BY REGION, 2020–2027 (USD MILLION)
- TABLE 16 NORTH AMERICA: PROTEIN MULTIPLEX ASSAYS MARKET, BY COUNTRY, 2020–2027 (USD MILLION)
- TABLE 17 PLANAR PROTEIN ASSAYS MARKET, BY REGION, 2020–2027 (USD MILLION)
- TABLE 18 NORTH AMERICA: PLANAR PROTEIN ASSAYS MARKET, BY COUNTRY, 2020–2027 (USD MILLION)
- TABLE 19 BEAD-BASED PROTEIN ASSAYS MARKET, BY REGION, 2020–2027 (USD MILLION)
- TABLE 20 NORTH AMERICA: BEAD-BASED PROTEIN ASSAYS MARKET, BY COUNTRY, 2020–2027 (USD MILLION)
- TABLE 21 OTHER PROTEIN ASSAYS MARKET, BY REGION, 2020–2027 (USD MILLION)
- TABLE 22 NORTH AMERICA: OTHER PROTEIN ASSAYS MARKET, BY COUNTRY, 2020–2027 (USD MILLION)
- TABLE 23 SOME FDA-AUTHORIZED MULTIPLEX ASSAYS AND INSTRUMENTS FOR SIMULTANEOUS DETECTION OF INFLUENZA AND SARS-COV-2
- TABLE 24 NUCLEIC ACID MULTIPLEX ASSAYS MARKET, BY TYPE, 2020–2027 (USD MILLION)
- TABLE 25 NUCLEIC ACID MULTIPLEX ASSAYS MARKET, BY REGION, 2020–2027 (USD MILLION)
- TABLE 26 NORTH AMERICA: NUCLEIC ACID MULTIPLEX ASSAYS MARKET, BY COUNTRY, 2020–2027 (USD MILLION)
- TABLE 27 PLANAR NUCLEIC ACID ASSAYS MARKET, BY REGION, 2020–2027 (USD MILLION)
- TABLE 28 NORTH AMERICA: PLANAR NUCLEIC ACID ASSAYS MARKET, BY COUNTRY, 2020–2027 (USD MILLION)
- TABLE 29 BEAD-BASED NUCLEIC ACID ASSAYS MARKET, BY REGION, 2020–2027 (USD MILLION)
- TABLE 30 NORTH AMERICA: BEAD-BASED NUCLEIC ACID ASSAYS MARKET, BY COUNTRY, 2020–2027 (USD MILLION)
- TABLE 31 OTHER NUCLEIC ACID ASSAYS MARKET, BY REGION, 2020–2027 (USD MILLION)
- TABLE 32 NORTH AMERICA: OTHER NUCLEIC ACID ASSAYS MARKET, BY COUNTRY, 2020–2027 (USD MILLION)
- TABLE 33 CELL-BASED MULTIPLEX ASSAYS MARKET, BY REGION, 2020–2027 (USD MILLION)
- TABLE 34 NORTH AMERICA: CELL-BASED MULTIPLEX ASSAYS MARKET, BY COUNTRY, 2020–2027 (USD MILLION)
- TABLE 35 MULTIPLEX ASSAYS MARKET, BY TECHNOLOGY, 2020–2027 (USD MILLION)
- TABLE 36 MULTIPLEX ASSAYS MARKET FOR FLOW CYTOMETRY, BY REGION, 2020–2027 (USD MILLION)
- TABLE 37 NORTH AMERICA: MULTIPLEX ASSAYS MARKET FOR FLOW CYTOMETRY, BY COUNTRY, 2020–2027 (USD MILLION)
- TABLE 38 MULTIPLEX ASSAYS MARKET FOR FLUORESCENCE DETECTION, BY REGION, 2020–2027 (USD MILLION)
- TABLE 39 NORTH AMERICA: MULTIPLEX ASSAYS MARKET FOR FLUORESCENCE DETECTION, BY COUNTRY, 2020–2027 (USD MILLION)
- TABLE 40 MULTIPLEX ASSAYS MARKET FOR LUMINESCENCE, BY REGION, 2020–2027 (USD MILLION)
- TABLE 41 NORTH AMERICA: MULTIPLEX ASSAYS MARKET FOR LUMINESCENCE, BY COUNTRY, 2020–2027 (USD MILLION)
- TABLE 42 MULTIPLEX ASSAYS MARKET FOR MULTIPLEX REAL-TIME PCR, BY REGION, 2020–2027 (USD MILLION)
- TABLE 43 NORTH AMERICA: MULTIPLEX ASSAYS MARKET FOR MULTIPLEX REAL-TIME PCR, BY COUNTRY, 2020–2027 (USD MILLION)
- TABLE 44 MULTIPLEX ASSAYS MARKET FOR OTHER TECHNOLOGIES, BY REGION, 2020–2027 (USD MILLION)
- TABLE 45 NORTH AMERICA: MULTIPLEX ASSAYS MARKET FOR OTHER TECHNOLOGIES, BY COUNTRY, 2020–2027 (USD MILLION)
- TABLE 46 MULTIPLEX ASSAYS MARKET, BY APPLICATION, 2020–2027 (USD MILLION)
- TABLE 47 MULTIPLEX ASSAYS MARKET FOR RESEARCH & DEVELOPMENT, BY TYPE, 2020–2027 (USD MILLION)
- TABLE 48 MULTIPLEX ASSAYS MARKET FOR RESEARCH & DEVELOPMENT, BY REGION, 2020–2027 (USD MILLION)
- TABLE 49 NORTH AMERICA: MULTIPLEX ASSAYS MARKET FOR RESEARCH & DEVELOPMENT, BY COUNTRY, 2020–2027 (USD MILLION)
- TABLE 50 MULTIPLEX ASSAYS MARKET FOR DRUG DISCOVERY & DEVELOPMENT, BY REGION, 2020–2027 (USD MILLION)
- TABLE 51 NORTH AMERICA: MULTIPLEX ASSAYS MARKET FOR DRUG DISCOVERY & DEVELOPMENT, BY COUNTRY, 2020–2027 (USD MILLION)
- TABLE 52 MULTIPLEX ASSAYS MARKET FOR BIOMARKER DISCOVERY & VALIDATION, BY REGION, 2020–2027 (USD MILLION)
- TABLE 53 NORTH AMERICA: MULTIPLEX ASSAYS MARKET FOR BIOMARKER DISCOVERY & VALIDATION, BY COUNTRY, 2020–2027 (USD MILLION)
- TABLE 54 MULTIPLEX ASSAYS MARKET FOR CLINICAL DIAGNOSTICS, BY TYPE, 2020–2027 (USD MILLION)
- TABLE 55 MULTIPLEX ASSAYS MARKET FOR CLINICAL DIAGNOSTICS, BY REGION, 2020–2027 (USD MILLION)
- TABLE 56 NORTH AMERICA: MULTIPLEX ASSAYS MARKET FOR CLINICAL DIAGNOSTICS, BY COUNTRY, 2020–2027 (USD MILLION)
- TABLE 57 MULTIPLEX ASSAYS MARKET FOR INFECTIOUS DISEASE DIAGNOSTICS, BY REGION, 2020–2027 (USD MILLION)
- TABLE 58 NORTH AMERICA: MULTIPLEX ASSAYS MARKET FOR INFECTIOUS DISEASE DIAGNOSTICS, BY COUNTRY, 2020–2027 (USD MILLION)
- TABLE 59 INCREASING INCIDENCE OF CANCER, BY REGION, 2020 VS. 2030 VS. 2040 (MILLION)
- TABLE 60 NUMBER OF PREVALENT CANCER CASES WORLDWIDE IN 2020, BY TYPE OF CANCER
- TABLE 61 MULTIPLEX ASSAYS MARKET FOR CANCER DIAGNOSTICS, BY REGION, 2020–2027 (USD MILLION)
- TABLE 62 NORTH AMERICA: MULTIPLEX ASSAYS MARKET FOR CANCER DIAGNOSTICS, BY COUNTRY, 2020–2027 (USD MILLION)
- TABLE 63 MULTIPLEX ASSAYS MARKET FOR CARDIOVASCULAR DISEASES, BY REGION, 2020–2027 (USD MILLION)
- TABLE 64 NORTH AMERICA: MULTIPLEX ASSAYS MARKET FOR CARDIOVASCULAR DISEASES, BY COUNTRY, 2020–2027 (USD MILLION)
- TABLE 65 PREVALENCE OF SOME AUTOIMMUNE DISEASES
- TABLE 66 MULTIPLEX ASSAYS MARKET FOR AUTOIMMUNE DISEASES, BY REGION, 2020–2027 (USD MILLION)
- TABLE 67 NORTH AMERICA: MULTIPLEX ASSAYS MARKET FOR AUTOIMMUNE DISEASES, BY COUNTRY, 2020–2027 (USD MILLION)
- TABLE 68 MULTIPLEX ASSAYS MARKET FOR NERVOUS SYSTEM DISORDERS, BY REGION, 2020–2027 (USD MILLION)
- TABLE 69 NORTH AMERICA: MULTIPLEX ASSAYS MARKET FOR NERVOUS SYSTEM DISORDERS, BY COUNTRY, 2020–2027 (USD MILLION)
- TABLE 70 MULTIPLEX ASSAYS MARKET FOR METABOLISM & ENDOCRINOLOGY DISORDERS, BY REGION, 2020–2027 (USD MILLION)
- TABLE 71 NORTH AMERICA: MULTIPLEX ASSAYS MARKET FOR METABOLISM & ENDOCRINOLOGY DISORDERS, BY COUNTRY, 2020–2027 (USD MILLION)
- TABLE 72 MULTIPLEX ASSAYS MARKET FOR OTHER DISEASES, BY REGION, 2020–2027 (USD MILLION)
- TABLE 73 NORTH AMERICA: MULTIPLEX ASSAYS MARKET FOR OTHER DISEASES, BY COUNTRY, 2020–2027 (USD MILLION)
- TABLE 74 MULTIPLEX ASSAYS MARKET, BY END USER, 2020–2027 (USD MILLION)
- TABLE 75 MULTIPLEX ASSAYS MARKET FOR PHARMACEUTICAL & BIOTECHNOLOGY COMPANIES, BY REGION, 2020–2027 (USD MILLION)
- TABLE 76 NORTH AMERICA: MULTIPLEX ASSAYS MARKET FOR PHARMACEUTICAL & BIOTECHNOLOGY COMPANIES, BY COUNTRY, 2020–2027 (USD MILLION)
- TABLE 77 MULTIPLEX ASSAYS MARKET FOR HOSPITALS & RESEARCH INSTITUTES, BY REGION, 2020–2027 (USD MILLION)
- TABLE 78 NORTH AMERICA: MULTIPLEX ASSAYS MARKET FOR HOSPITALS & RESEARCH INSTITUTES, BY COUNTRY, 2020–2027 (USD MILLION)
- TABLE 79 MULTIPLEX ASSAYS MARKET FOR REFERENCE LABORATORIES, BY REGION, 2020–2027 (USD MILLION)
- TABLE 80 NORTH AMERICA: MULTIPLEX ASSAYS MARKET FOR REFERENCE LABORATORIES, BY COUNTRY, 2020–2027 (USD MILLION)
- TABLE 81 MULTIPLEX ASSAYS MARKET FOR OTHER END USERS, BY REGION, 2020–2027 (USD MILLION)
- TABLE 82 NORTH AMERICA: MULTIPLEX ASSAYS MARKET FOR OTHER END USERS, BY COUNTRY, 2020–2027 (USD MILLION)
- TABLE 83 MULTIPLEX ASSAYS MARKET, BY REGION, 2020–2027 (USD MILLION)
- TABLE 84 NORTH AMERICA: MULTIPLEX ASSAYS MARKET, BY COUNTRY, 2020–2027 (USD MILLION)
- TABLE 85 NORTH AMERICA: MULTIPLEX ASSAYS MARKET, BY PRODUCT & SERVICE, 2020–2027 (USD MILLION)
- TABLE 86 NORTH AMERICA: MULTIPLEX ASSAYS MARKET, BY TYPE, 2020–2027 (USD MILLION)
- TABLE 87 NORTH AMERICA: MULTIPLEX ASSAYS MARKET, BY TECHNOLOGY, 2020–2027 (USD MILLION)
- TABLE 88 NORTH AMERICA: MULTIPLEX ASSAYS MARKET, BY APPLICATION, 2020–2027 (USD MILLION)
- TABLE 89 NORTH AMERICA: MULTIPLEX ASSAYS MARKET, BY END USER, 2020–2027 (USD MILLION)
- TABLE 90 US: MULTIPLEX ASSAYS MARKET, BY PRODUCT & SERVICE, 2020–2027 (USD MILLION)
- TABLE 91 US: MULTIPLEX ASSAYS MARKET, BY TYPE, 2020–2027 (USD MILLION)
- TABLE 92 US: MULTIPLEX ASSAYS MARKET, BY TECHNOLOGY, 2020–2027 (USD MILLION)
- TABLE 93 US: MULTIPLEX ASSAYS MARKET, BY APPLICATION, 2020–2027 (USD MILLION)
- TABLE 94 US: MULTIPLEX ASSAYS MARKET, BY END USER, 2020–2027 (USD MILLION)
- TABLE 95 CANADA: MULTIPLEX ASSAYS MARKET, BY PRODUCT & SERVICE, 2020–2027 (USD MILLION)
- TABLE 96 CANADA: MULTIPLEX ASSAYS MARKET, BY TYPE, 2020–2027 (USD MILLION)
- TABLE 97 CANADA: MULTIPLEX ASSAYS MARKET, BY TECHNOLOGY, 2020–2027 (USD MILLION)
- TABLE 98 CANADA: MULTIPLEX ASSAYS MARKET, BY APPLICATION, 2020–2027 (USD MILLION)
- TABLE 99 CANADA: MULTIPLEX ASSAYS MARKET, BY END USER, 2020–2027 (USD MILLION)
- TABLE 100 EUROPE: HEALTHCARE EXPENDITURE, BY COUNTRY (% OF GDP)
- TABLE 101 EUROPE: MULTIPLEX ASSAYS MARKET, BY PRODUCT & SERVICE, 2020–2027 (USD MILLION)
- TABLE 102 EUROPE: MULTIPLEX ASSAYS MARKET, BY TYPE, 2020–2027 (USD MILLION)
- TABLE 103 EUROPE: MULTIPLEX ASSAYS MARKET, BY TECHNOLOGY, 2020–2027 (USD MILLION)
- TABLE 104 EUROPE: MULTIPLEX ASSAYS MARKET, BY APPLICATION, 2020–2027 (USD MILLION)
- TABLE 105 EUROPE: MULTIPLEX ASSAYS MARKET, BY END USER, 2020–2027 (USD MILLION)
- TABLE 106 ASIA PACIFIC: MULTIPLEX ASSAYS MARKET, BY PRODUCT & SERVICE, 2020–2027 (USD MILLION)
- TABLE 107 ASIA PACIFIC: MULTIPLEX ASSAYS MARKET, BY TYPE, 2020–2027 (USD MILLION)
- TABLE 108 ASIA PACIFIC: MULTIPLEX ASSAYS MARKET, BY TECHNOLOGY, 2020–2027 (USD MILLION)
- TABLE 109 ASIA PACIFIC: MULTIPLEX ASSAYS MARKET, BY APPLICATION, 2020–2027 (USD MILLION)
- TABLE 110 ASIA PACIFIC: MULTIPLEX ASSAYS MARKET, BY END USER, 2020–2027 (USD MILLION)
- TABLE 111 REST OF THE WORLD: MULTIPLEX ASSAYS MARKET, BY PRODUCT & SERVICE, 2020–2027 (USD MILLION)
- TABLE 112 REST OF THE WORLD: MULTIPLEX ASSAYS MARKET, BY TYPE, 2020–2027 (USD MILLION)
- TABLE 113 REST OF THE WORLD: MULTIPLEX ASSAYS MARKET, BY TECHNOLOGY, 2020–2027 (USD MILLION)
- TABLE 114 REST OF THE WORLD: MULTIPLEX ASSAYS MARKET, BY APPLICATION, 2020–2027 (USD MILLION)
- TABLE 115 REST OF THE WORLD: MULTIPLEX ASSAYS MARKET, BY END USER, 2020–2027 (USD MILLION)
- TABLE 116 OVERVIEW OF STRATEGIES ADOPTED BY KEY COMPANIES
- TABLE 117 MULTIPLEX ASSAYS MARKET: INTENSITY OF COMPETITIVE RIVALRY
- TABLE 118 KEY PRODUCT LAUNCHES & REGULATORY APPROVALS (2020- 2023)
- TABLE 119 KEY DEALS (2020-2023)
- TABLE 120 ILLUMINA, INC.: BUSINESS OVERVIEW
- TABLE 121 BIO-RAD LABORATORIES, INC.: BUSINESS OVERVIEW
- TABLE 122 THERMO FISHER SCIENTIFIC, INC.: BUSINESS OVERVIEW
- TABLE 123 BECTON, DICKINSON AND COMPANY.: BUSINESS OVERVIEW
- TABLE 124 DIASORIN S.P.A.: BUSINESS OVERVIEW
- TABLE 125 QIAGEN N.V.: BUSINESS OVERVIEW
- TABLE 126 ABCAM PLC.: BUSINESS OVERVIEW
- TABLE 127 MERCK KGAA: BUSINESS OVERVIEW
- TABLE 128 AGILENT TECHNOLOGIES, INC.: BUSINESS OVERVIEW
- TABLE 129 QUANTERIX: BUSINESS OVERVIEW
- TABLE 130 BIO-TECHNE: BUSINESS OVERVIEW
- TABLE 131 MESO SCALE DIAGNOSTICS, LLC: BUSINESS OVERVIEW
- TABLE 132 RANDOX LABORATORIES LTD.: BUSINESS OVERVIEW
- TABLE 133 OLINK: COMPANY OVERVIEW
- TABLE 134 SEEGENE INC.: COMPANY OVERVIEW
- TABLE 135 SIEMENS HEALTHINEERS AG: COMPANY OVERVIEW
- TABLE 136 PERKINELMER INC.: COMPANY OVERVIEW
- TABLE 137 SHIMADZU CORPORATION: COMPANY OVERVIEW
- TABLE 138 PROMEGA CORPORATION: COMPANY OVERVIEW
- TABLE 139 ENZO BIOCHEM INC.: COMPANY OVERVIEW
- TABLE 140 CAYMAN CHEMICAL: COMPANY OVERVIEW
- TABLE 141 BOSTER BIOLOGICAL TECHNOLOGY: COMPANY OVERVIEW
- TABLE 142 ANTIGENIX AMERICA, INC.: COMPANY OVERVIEW
- TABLE 143 QUANSYS BIOSCIENCES INC.: COMPANY OVERVIEW
- TABLE 144 RAYBIOTECH LIFE, INC.: COMPANY OVERVIEW
- FIGURE 1 MULTIPLEX ASSAYS MARKET: RESEARCH DESIGN METHODOLOGY
- FIGURE 2 BREAKDOWN OF PRIMARY INTERVIEWS: SUPPLY-SIDE AND DEMAND-SIDE PARTICIPANTS
- FIGURE 3 BREAKDOWN OF PRIMARY INTERVIEWS: BY COMPANY TYPE, DESIGNATION, AND REGION
- FIGURE 4 BOTTOM-UP APPROACH: COMPANY REVENUE ESTIMATION APPROACH
- FIGURE 5 CAGR PROJECTIONS: SUPPLY-SIDE ANALYSIS
- FIGURE 6 MULTIPLEX ASSAYS MARKET: TOP-DOWN APPROACH
- FIGURE 7 DATA TRIANGULATION
- FIGURE 8 MULTIPLEX ASSAYS MARKET, BY PRODUCT & SERVICE, 2022 VS. 2027 (USD MILLION)
- FIGURE 9 MULTIPLEX ASSAYS MARKET, BY TYPE, 2022 VS. 2027 (USD MILLION)
- FIGURE 10 MULTIPLEX ASSAYS MARKET, BY TECHNOLOGY, 2022 VS. 2027 (USD MILLION)
- FIGURE 11 MULTIPLEX ASSAYS MARKET, BY APPLICATION, 2022 VS. 2027 (USD MILLION)
- FIGURE 12 MULTIPLEX ASSAYS MARKET, BY END USER, 2022 VS. 2027 (USD MILLION)
- FIGURE 13 MULTIPLEX ASSAYS MARKET, BY REGION, 2022 VS. 2027 (USD MILLION)
- FIGURE 14 INCREASING ADOPTION OF MULTIPLEX ASSAYS IN COMPANION DIAGNOSTICS TO DRIVE MARKET GROWTH
- FIGURE 15 CONSUMABLES PRODUCT & SERVICE SEGMENT TO CONTINUE TO DOMINATE MARKET IN 2027
- FIGURE 16 PROTEIN MULTIPLEX ASSAYS TYPE SEGMENT TO ACCOUNT FOR LARGEST MARKET SHARE
- FIGURE 17 FLOW CYTOMETRY TECHNOLOGY TO ACCOUNT FOR LARGEST MARKET SHARE
- FIGURE 18 RESEARCH & DEVELOPMENT APPLICATION TO ACCOUNT FOR LARGER MARKET SHARE
- FIGURE 19 PHARMACEUTICAL & BIOTECHNOLOGY COMPANIES END USER SEGMENT TO ACCOUNT FOR LARGEST MARKET SHARE
- FIGURE 20 ASIA PACIFIC TO REGISTER HIGHEST GROWTH RATE DURING FORECAST PERIOD
- FIGURE 21 MULTIPLEX ASSAYS MARKET: DRIVERS, RESTRAINTS, OPPORTUNITIES, AND CHALLENGES
- FIGURE 22 INCIDENCE OF DIABETES, BY REGION, IN 2021, 2030, AND 2045
- FIGURE 23 NORTH AMERICA: MULTIPLEX ASSAYS MARKET SNAPSHOT
- FIGURE 24 ASIA PACIFIC: MULTIPLEX ASSAYS MARKET SNAPSHOT
- FIGURE 25 REVENUE SHARE ANALYSIS OF TOP PLAYERS (2017–2021)
- FIGURE 26 MULTIPLEX ASSAYS MARKET SHARE, BY KEY PLAYER, 2021
- FIGURE 27 MULTIPLEX ASSAYS MARKET: COMPETITIVE LEADERSHIP MAPPING, 2021
- FIGURE 28 MULTIPLEX ASSAYS MARKET: COMPETITIVE LEADERSHIP MAPPING FOR START-UPS/SMES, 2021
- FIGURE 29 COMPANY SNAPSHOT: ILLUMINA, INC. (2022)
- FIGURE 30 COMPANY SNAPSHOT: BIO-RAD LABORATORIES, INC. (2022)
- FIGURE 31 COMPANY SNAPSHOT: THERMO FISHER SCIENTIFIC, INC. (2021)
- FIGURE 32 COMPANY SNAPSHOT: BECTON, DICKINSON AND COMPANY (2022)
- FIGURE 33 COMPANY SNAPSHOT: DIASORIN S.P.A. (2021)
- FIGURE 34 COMPANY SNAPSHOT: QIAGEN N.V. (2021)
- FIGURE 35 COMPANY SNAPSHOT: ABCAM PLC (2021)
- FIGURE 36 COMPANY SNAPSHOT: MERCK KGAA (2022)
- FIGURE 37 COMPANY SNAPSHOT: AGILENT TECHNOLOGIES, INC. (2022)
- FIGURE 38 COMPANY SNAPSHOT: QUANTERIX (2022)
- FIGURE 39 COMPANY SNAPSHOT: BIO-TECHNE (2021)
The objective of the study is analyze the key market dynamics such as drivers, opportunities, challenges, restraints, and key player strategies. To track companies developments such as acquisitions, product launches, expansions, agreements and partnerships of the leading players, the competitive landscape of the multiplex assays market to analyzes market players on various parameters within the broad categories of business and product strategy. Top-down and bottom-up approaches were use to estimate the market size. To estimate the market size of segments and subsegments the market breakdown and data triangulation were used.
The four steps involved in estimating the market size are
Secondary Research
In the secondary research process, various secondary sources such as annual reports, press releases & investor presentations of companies, white papers, certified publications, articles by recognized authors, gold-standard & silver-standard websites, regulatory bodies, and databases (such as D&B Hoovers, Bloomberg Business, and Factiva) were referred to identify and collect information for this study.
Primary Research
In the primary research process, various sources from both the supply and demand sides were interviewed to obtain qualitative and quantitative information for this report. Primary sources were mainly industry experts from the core and related industries and preferred suppliers, manufacturers, distributors, service providers, technology developers, researchers, and organizations related to all segments of this industry’s value chain. In-depth interviews were conducted with various primary respondents, including key industry participants, subject-matter experts, C-level executives of key market players, and industry consultants, to obtain and verify the critical qualitative and quantitative information as well as assess prospects.
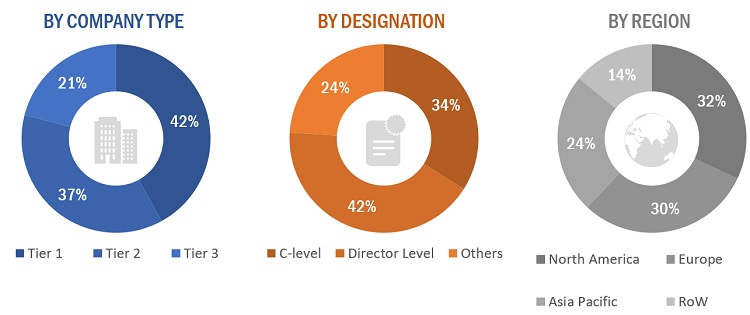
The following is a breakdown of the primary respondents:
Breakdown of Primary Participants
To know about the assumptions considered for the study, download the pdf brochure
Note 1: Others include sales managers, marketing managers, and product managers.
Note 2: Companies are classified into tiers based on their total revenues. As of 2021/2022, Tier 1 = >USD 100 million, Tier 2 = USD 10 million to USD 100 million, and Tier 3 = <USD 10 million.
|
COMPANY NAME |
DESIGNATION |
|
Illumina, Inc. |
Marketing Manager |
|
Bio-Rad Laboratories Inc. |
Senior Product Manager |
|
Thermo Fisher Scientific, Inc. |
General Manager |
Market Size Estimation
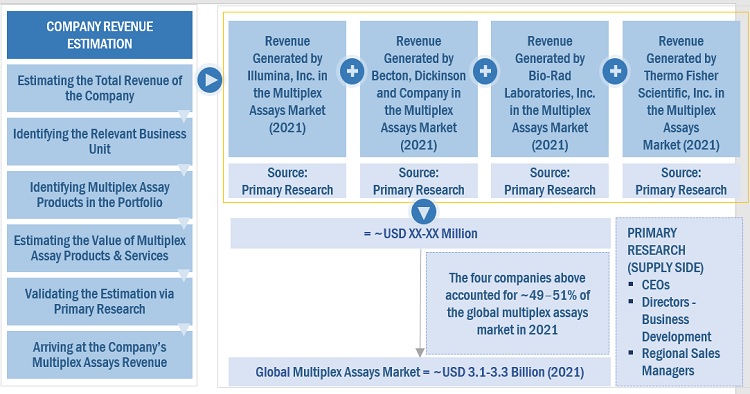
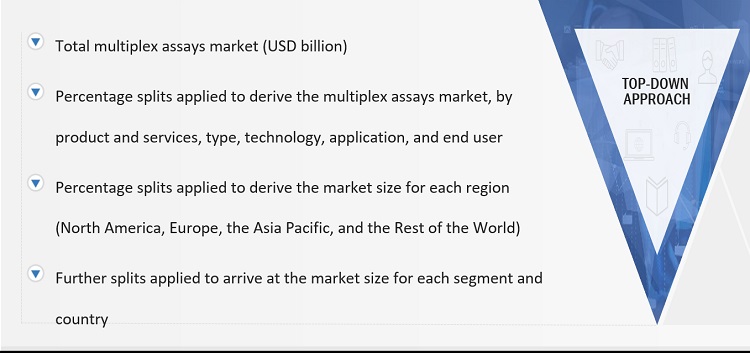
Both top-down and bottom-up approaches were used to estimate and validate the multiplex assays market's total size. These methods were also used extensively to estimate the size of various subsegments in the market. The research methodology used to estimate the market size includes the following:
- The key players in the industry have been identified through extensive secondary research
- The revenues generated by leading players operating in the multiplex assays market have been determined through primary and secondary research
- All percentage shares, splits, and breakdowns have been determined using secondary sources and verified through primary sources
Global Multiplex Assays Market Size: Botton Up Approach
To know about the assumptions considered for the study, Request for Free Sample Report
Global multiplex assays market Size: Top-Down Approach
Data Triangulation
After arriving at the overall market size applying the process mentioned above, the total market was split into several segments and subsegments. To complete the overall market engineering process and arrive at the exact statistics for all segments and subsegments, data triangulation and market breakdown procedures were employed, wherever applicable. The data was triangulated by studying various factors and trends from both the demand and supply sides.
Market Definition
Multiplex assays are analytical tools used to measure multiple analytes qualitatively and quantitatively from biological samples in a single run. Multiplex assays are faster, and they can be automated to a higher degree and use comparatively less sample volume than singleplex assays.
Key Stakeholders
- Senior Management
- End User
- Finance/Procurement Department
- R&D Department
Report Objectives
- To provide detailed information regarding the major factors influencing the market growth (such as (drivers, restraints, opportunities, and challenges)
- To analyze micromarkets1 with respect to individual growth trends, prospects, and contributions to the overall multiplex assays market
- To analyze market opportunities for stakeholders and provide details of the competitive landscape for key players
- To forecast the size of the market segments with respect to four regions: North America, Europe, the Asia Pacific, and the Rest of the World
- To profile the key players and comprehensively analyze their product portfolios, market positions, and core competencies2
- To track and analyze company developments such as product launches, regulatory approvals, agreements, partnerships, collaborations, and acquisitions in the multiplex assays market
- To benchmark players within the market using the proprietary Competitive Leadership Mapping framework, which analyzes market players on various parameters within the broad categories of business and product strategy
Available Customizations
MarketsandMarkets offers the following customizations for this market report
Country Information
- Additional country-level analysis of the multiplex assays market
Company profiles
- Additional five company profiles of players operating in the multiplex assays market.
Product Analysis
- Product matrix, which provides a detailed comparison of the product portfolio of each company in the multiplex assays market


 Generating Response ...


Growth opportunities and latent adjacency in Multiplex Assays Market