Network Monitoring Market Size, Share, Statistics and Industry Growth Analysis Report by Offering (Equipment, Software & Services), Bandwidth (1&10 Gbps, 40 Gbps, 100 Gbps), Technology (Ethernet, Fiber Optic, InfiniBand), End User and Geography - Global Forecast to 2027
Updated on : September 24, 2024
Network Monitoring Market Size & Growth
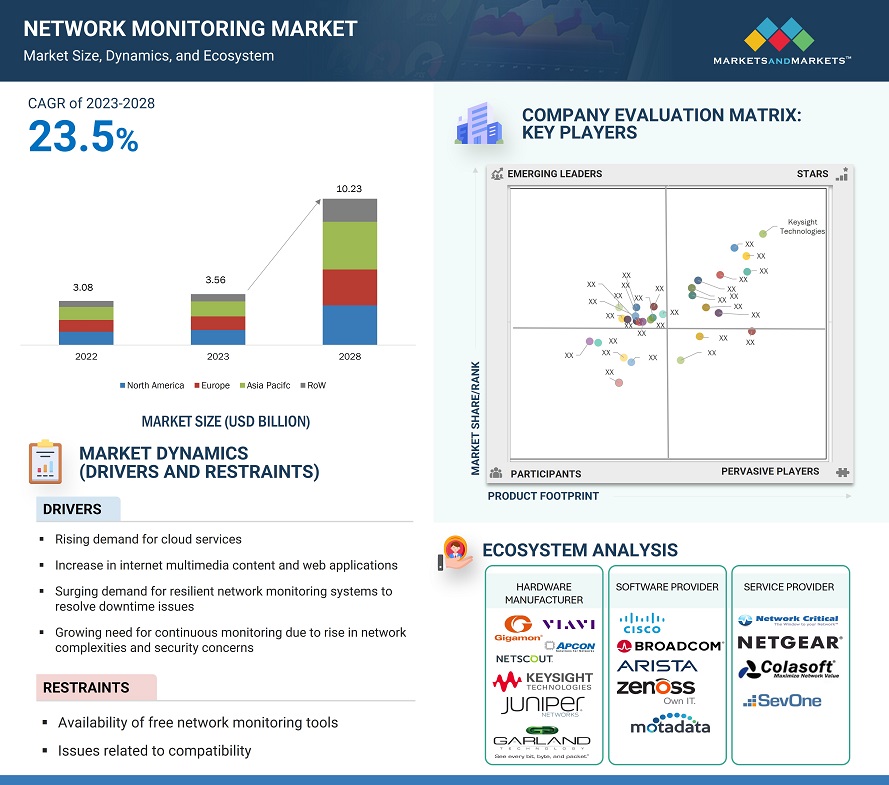
[273 Pages Report] The Network Monitoring Market Size is projected to grow from USD 2.2 billion in 2022 to reach USD 3.0 billion by 2027; it is expected to grow at a Compound Annual Growth Rate (CAGR) of 6.9 % from 2022 to 2027.
The rise in demand for cloud services, surging demand for resilient network monitoring systems to quickly resolve downtime issues along with need for continuous monitoring due to rise in network complexities and security concerns is expected to fuel the growth of the network monitoring industry.
To know about the assumptions considered for the study, Request for Free Sample Report
Network Monitoring Market Trends and Dynamics
Drivers: Surging demand for resilient network monitoring systems to quickly resolve downtime issues
When network devices fail, downtime, loss of productivity, or even security risks emerge. Hardware issues and errors can bring the entire infrastructure to a halt, while high CPU or network usage can slow operations to a painful grind. Network monitoring allows these trouble points to be quickly identified and addressed. Network monitoring helps to minimize the company’s downtime, and thus reduces costs. Many network monitoring solutions also provide added value by automatically adding new devices, mapping network topology, and revealing malicious activity or possible breaches. It is also essential to increase the overall productivity of the network. The network equipment provider companies are trying to create a fully redundant network from end to end, but in many cases, this is not possible. This may be because of the limitations in the architecture, lack of physical redundancy, or budgets that restrict a fully redundant approach. Network failures, server downtime, service or application crashes can seriously threaten the livelihood of business, costing thousands of dollars in revenue and productivity. Therefore, with the use of network monitoring solutions, one can gain better service and cut costs by fixing issues before noticing a problem.
Restraint : Availability of free network monitoring tools
Network monitoring provides clear insights about network traffic, bandwidth, and operational efficiency to the companies. It helps to address all the major challenges such as reducing overall operational cost, identifying optimal routes for interconnecting, and providing accurate insights on the flow of information. In the past, network monitoring tools were pertinent to the needs of larger organizations. Today, network monitoring suites are a lot more accessible to SMBs, NGOs, non-profits, and smaller organizations in general. Administrators in enterprises of all sizes are on the lookout for network monitoring tools that help to strengthen their online service. However, several free network traffic tools are available in the market space with which network admin can monitor and analyze network traffic and operate the network infrastructure efficiently.
Opportunity : Proliferation of Internet of Things (IoT) and Bring Your Own Device (BYOD) phenomenon
The BYOD phenomenon, i.e., Bring Your Own Device, refers to the provision and use of personal mobile devices and applications by employees for both private and business purposes. The penetration of mobile devices is growing rapidly due to the increase in acceptance of BYOD among organizations. The variety of applications, services, and functions available on mobile devices leads to large amount of data being stored on devices and transferred to and from devices. Most of the data stored on mobile devices contain sensitive information, such as usernames, credit card numbers, and passwords. This growth in dependency on mobile devices is inspiring organizations to implement effective monitoring & analytics solutions. In recent years, there has been a mass-scale shift to remote working has ushered in yet more IoT connections, creating a huge challenge for network administration teams in the past years. With more work devices connecting to home networks and personal devices connecting to corporate networks, monitoring of these networks has become crucial. As working from home seems to become significantly ubiquitous, businesses will need to continue refining their approach in network monitoring by adopting comprehensive monitoring solutions.
Challenge : High costs associated with network monitoring
As more business functions move onto the network, companies need to upgrade their networks to add capacity and new capabilities. In addition to traditional IT applications, networks now need to handle other business services, like telephony and video conferencing, which require improved network bandwidth. Multimedia applications also require the addition of multicasting protocols, new endpoint devices require autoconfiguration protocols and adding new services to shared network infrastructure requires the introduction of IP virtualization features. Companies can't afford to sacrifice proper network management to reduce costs, as it's crucial to business success. The cost of downtime, data leaks and other issues can easily result in much higher costs than those of upgrading and maintaining the network. Limited budgets can make it difficult to maintain network security. The complexity of today's networks means many businesses are spending a significant amount of time and resources on network monitoring, thereby leaving less resources for their core business activities.
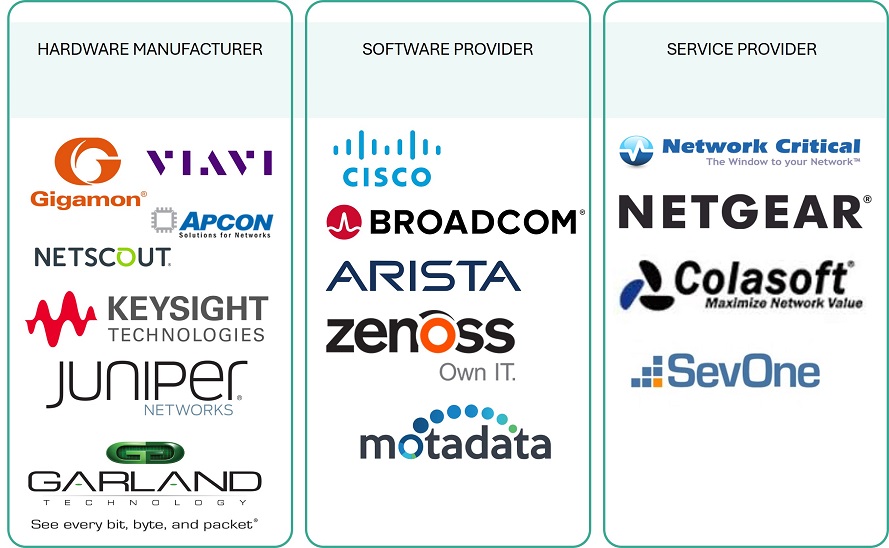
Network Monitoring Ecosystem
Network Monitoring Market Segmentation
Network monitoring equipment market for 40 Gbps bandwidth to hold a significant share during the forecast period.
Monitoring equipment with 40 Gbps bandwidth is being adopted in data centers and core network deployments. The expanding market for data centers and the growing use of servers and virtualization technology is driving the requirements for increased bandwidth. These network monitoring equipment are optimized and provide economic switching solutions. Also, this significantly reduces the required number of switches over the same network.
Recently, amid its overseas expansion, Garland Technology (US) continued its aggressive outreach campaign with the launch of its latest passive TAP. The 40Gigabit-SR4 fiber network TAP eliminates the need for SPAN Ports and allows users to TAP multi-mode OM3 and OM4 fiber types with 100% network visibility. One of the main benefits of this latest TAP is the elimination of SPAN Ports to monitor a 40Gigabit network, which has limitations to network security systems and network performance monitoring.
Network monitoring equipment market for data monitoring switches(network packet brokers) is expected to grow at the highest CAGR from during forecast period
The investments in advancements of network packet brokers have been an outcome of the increase in efficient network demand and is likely to propel the demand for network packet brokers globally. The factors include requirement of automated and simplified data centers, rise in usage of cloud services, surging trend of utilizing bare metal switches coupled with rising bandwidth requirements in data centers, advancement of NPBs, rise in multimedia content, and web applications drive the market for network data providers and is likely to bolster the network packet broker market during the forecast period. The key players are focusing on the development of advanced network packet broker solutions for various end-user industry applications.
Network Monitoring Market for telecommunications industry to hold a significant share during forecast period
Significant growth in the telecommunications industry across the globe is one of the key factors driving the network monitoring market growth. The increasing need for in-depth visibility in network infrastructure is also providing a boost to market growth. Telecommunications systems have rapidly transformed in the last few years with increasing demand for data connectivity. Managing these systems has become tedious not only in infrastructure and functionality management but also in scope management. With the help of network monitoring, one can keep track of telecom infrastructure and detect hardware failures or discrepancies that can cause potential revenue loss.
Network Monitoring Industry Regional Analysis
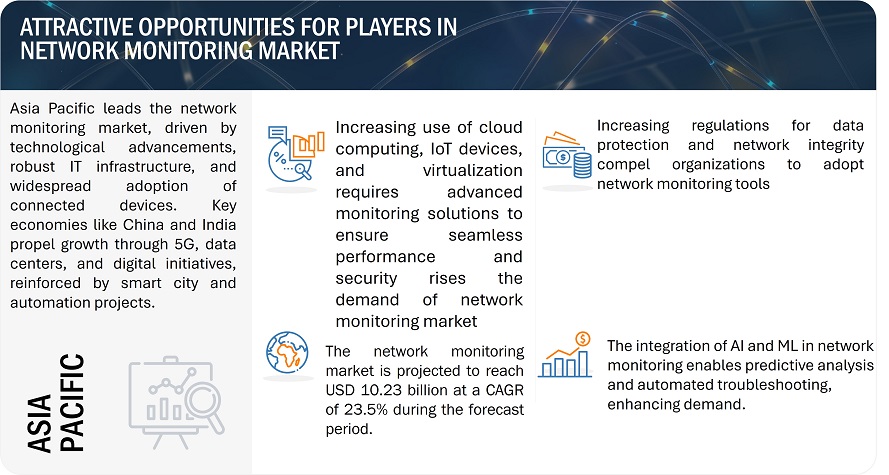
Network Monitoring Market in Asia Pacific estimated to grow at the fastest rate during the forecast period
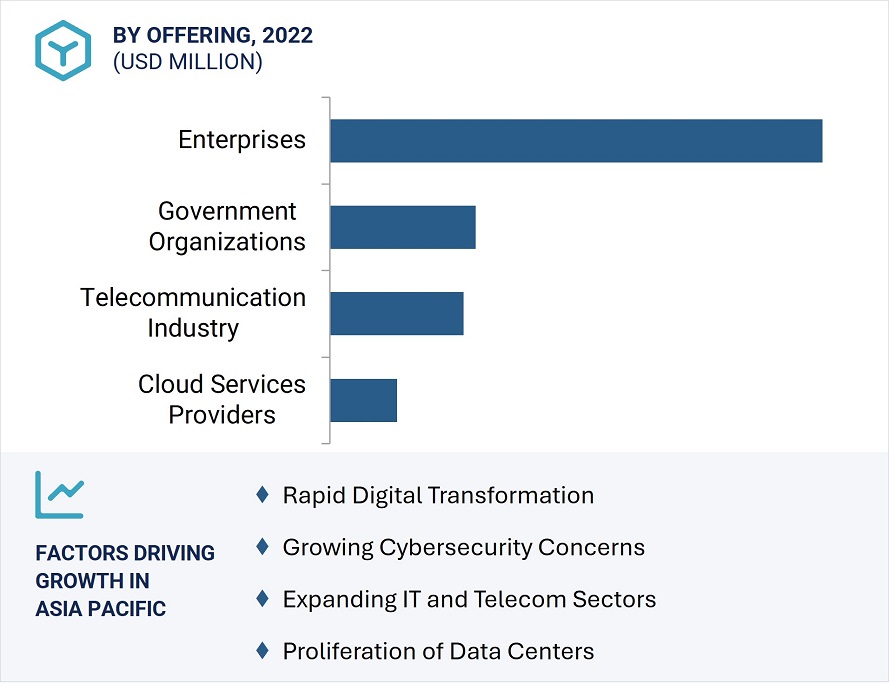
The network monitoring market in Asia Pacific is expected to grow at the highest CAGR during the forecast period. Network monitoring companies are expanding their presence in Asia Pacific, where China, Japan, and India are expected to be the major countries driving the growth of the network monitoring market. Also, the increasing number of small- and medium-scale enterprises and the adoption of digital technologies in them further drive the demand for network monitoring solutions. Moreover, the increasing penetration of the internet and rising population of internet users in the region creates a massive amount of data that drives the demand for cloud-based services. All these parameters generate the need for high performing monitoring solutions across the network infrastructure in data centers
To know about the assumptions considered for the study, download the pdf brochure
Top Network Monitoring Companies - Key Market Players
Major vendors in the Network Monitoring Comapanies include
- Gigamon (US),
- NETSCOUT (US),
- Keysight Technologies (US),
- Viavi,
- APCON (US),
- Garland Technology (US),
- Cisco (US),
- Broadcom (US),
- Arista Networks (US),
- Juniper Networks, Inc. (US),
- Zenoss (US).
- Network Critical (UK),
- CALIENT Technologies (CALIENT) (US),
- Netgear (US),
- Motadata (US),
- Riverbed Technology (US),
- Accedian Networks (US),
- Datadog (US),
- Kentik (US),
- Auvik Networks (Canada),
- LogicMonitor (US)
- Paessler (Germany) are among a few emerging companies in the network monitoring market share.
Network Monitoring Market Report Scope:
Report Metric |
Detail |
Estimated Market Size |
USD 13.6 billion |
Expected Market Size |
USD 17.0 billion |
Growth Rate |
CAGR of 4.6% |
Market size available for years |
2018—2027 |
Base year |
2021 |
Forecast period |
2022—2027 |
Segments covered |
Offerings, Bandwidth, Technology, End User, and Region |
Geographic regions covered |
North America , Europe, Asia Pacific, and RoW |
Companies covered |
Gigamon (US), NETSCOUT (US), Keysight Technologies (US), Viavi (US), APCON (US), and Garland Technology (US), Cisco (US), Broadcom (US), Arista Networks (US), Juniper Networks, Inc. (US), Zenoss (US), Network Critical (UK), CALIENT (US), Netgear (US), Motadata (US), LogicMonitor (US), Colasoft (US), SevOne (US), Riverbed Technology (US), Accedian Networks (Canada), ExtraHop (US), Solarwinds (US), ManageEngine (US), LiveAction (US), Auvik Networks (Canada), Paessler (Germany), Flowmon Networks (Czech Republic), AppNeta (US), Zabbix (Latvia) and Datadog (US) |
This research report categorizes the network monitoring market share based on offerings, bandwidth, technology, end-user, and region.
Based on Offerings, the Network Monitoring Market been Segmented as follows:
- Equipment
- Network TAPs
- Data Monitoring Switches
- Software & Services
Based on Bandwidth, the Network Monitoring Market been Segmented as follows:
- 1&10 Gbps
- 40 Gbps
- 100 Gbps
Based on Technology, the Network Monitoring Market been Segmented as follows:
- Ethernet
- Fiber Optic
- InfiniBand
Based on End User, the Network Monitoring Market been Segmented as follows:
- Enterprises
- Telecommunications Industry
- Government Organisations
- Cloud Service Providers
Based on Region, the Network Monitoring Market been Segmented as follows:
-
North America
- US
- Canada
- Mexico
-
Europe
- UK
- Germany
- France
- Italy
- Spain
- Rest of Europe
-
Asia Pacific
- China
- Japan
- India
- South Korea
- Rest of Asia Pacific
-
Rest of the World (RoW)
- Middle East & Africa
- South America
Recent Developments
- In December 2021, Viavi Solutions announced that XL Axiata, the number one converged network operator in Indonesia, is using the VIAVI ONMSi Optical Network Management System to increase visibility into their fiber network. With intelligent remote test and monitoring capabilities, the ONMSi solution allows the operator to ensure peak performance, minimize downtime and optimize subscriber experience.
- In April 2021, Gigamon, the cloud leader in visibility and analytics, announced a partnership with Riverbed, the leader in performance and visibility of networks and applications, in support of the recent Gigamon Hawk launch. With this partnership, mutual customers can leverage Riverbed’s leading network performance management (NPM) solutions to deliver unified packet, flow, and device visibility across branch offices, data centers, hybrid and multi-cloud environments to optimize network and application troubleshooting.
- In December 2020, NETSCOUT announced the extension of its long-term partnership with Vodafone. The exclusive, multi-year agreement leverages NETSCOUT’s InfiniStreamNG platform to help provide real-time, end-to-end visibility across Vodafone’s hybrid environment.
Frequently Asked Questions (FAQ):
What will be the dynamics for the adoption of network monitoring market based on end user?
The enterprise segment held the largest share of the network monitoring market in 2021 and is expected to retain its dominant position throughout the forecast period. The enterprise segment is also projected to grow at the highest CAGR during the forecast period. Advanced enterprise applications require high-performance connectivity, constant uptime, high throughput, and high reliability to manage a vast amount of data. To fulfil these requirements, network monitoring is being incorporated into enterprises. Large enterprises across different industries have been undergoing digitization to improve their business processes. Enterprise systems have rapidly evolved in the past few years, owing to the rise in demand for data connectivity. Therefore, smooth and agile network infrastructure is the basic requirement for any business or industry in this digital era. Network performance can be improved by examining all network processes using these network monitoring systems. Moreover, it can save organizations from facing potential revenue losses as these systems keep track of network infrastructure and detect hardware failures. Thus, the use of network monitoring systems has increased in enterprises.
Which network monitoring offering will contribute more to the overall market share by 2027?
The software & services will contribute the most to the network monitoring market. Cross domain management operations, Software as a Service (SaaS)-based network management market, and performance service level agreements in cloud monitoring are expected to redefine traditional network management. Moreover, increasing network complexity, converging technologies, and growing virtualization implementation are expected to transform network management technologies, tools, and practices.
How will technological developments such as artificial intelligence (AI) change the network monitoring landscape in the future?
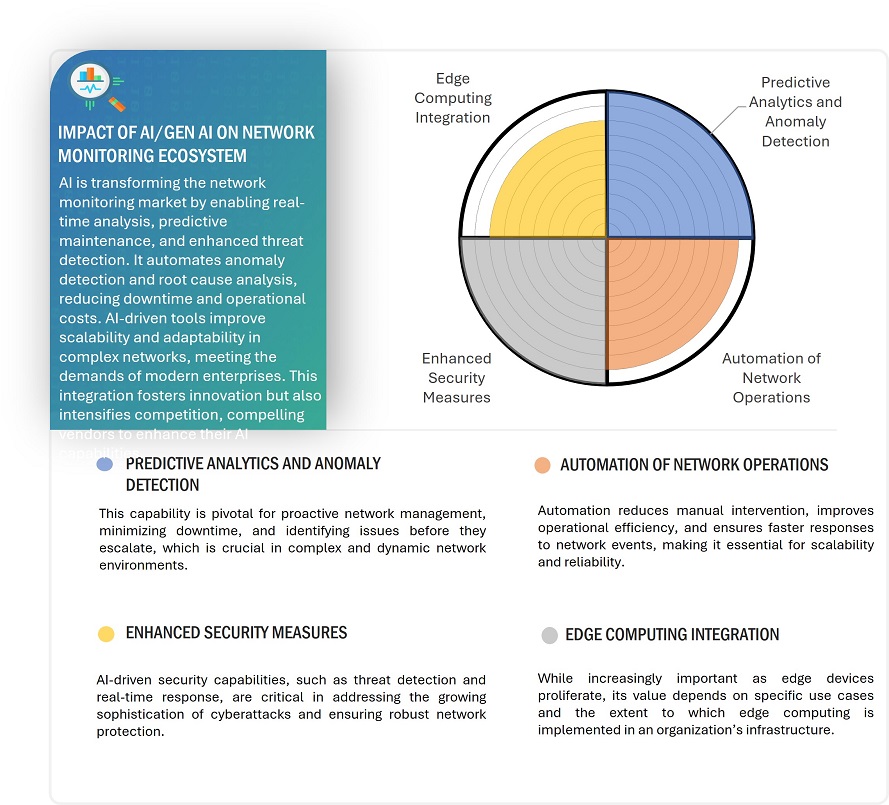
Network monitoring tools have begun to implement AI and machine learning into their systems. Network performance monitors (NPMs) can use AI to examine and respond to performance data. The use of AI in NPMs isn’t currently widespread, but as more network tools adopt AI and machine learning capabilities, more companies are seeing the benefits that AI bring to their networks.
Which region is expected to adopt network monitoring offerings at a fast rate?
Asia Pacific region is expected to adopt network monitoring offerings at the fastest rate. Developing countries such as India and China are expected to have a high potential for the future growth of the market.
What are the key market dynamics influencing market growth? How will they turn into strengths or weaknesses of companies operating in the market space?
Increasing global R&D spending on launching and developing new network monitoring equipment and solutions offers business opportunities to measurement companies. Companies such as Gigamon, NETSCOUT, Keysight Technologies, and Viavi have been consistently spending in the research and development of network monitoring solutions as observed in their annual reports over the last three years. .
To speak to our analyst for a discussion on the above findings, click Speak to Analyst
TABLE OF CONTENTS
1 INTRODUCTION (Page No. - 31)
1.1 STUDY OBJECTIVES
1.2 DEFINITION
1.3 STUDY SCOPE
1.3.1 MARKETS COVERED
FIGURE 1 MARKET: SEGMENTATION
1.3.2 NETWORK MONITORING MARKET: INCLUSIONS AND EXCLUSIONS
1.3.3 REGIONAL SCOPE
1.3.4 YEARS CONSIDERED
1.4 CURRENCY
1.5 STAKEHOLDERS
1.6 PACKAGE SIZE
1.7 SUMMARY OF CHANGES
2 RESEARCH METHODOLOGY (Page No. - 36)
2.1 RESEARCH DATA
FIGURE 2 NETWORK MONITORING MARKET: RESEARCH DESIGN
2.1.1 SECONDARY DATA
2.1.1.1 Major secondary sources
2.1.1.2 Key data from secondary sources
2.1.2 PRIMARY DATA
2.1.2.1 Primary interviews with experts
2.1.2.2 Breakdown of primaries
2.1.3 SECONDARY AND PRIMARY RESEARCH
2.1.3.1 Key industry insights
2.2 MARKET SIZE ESTIMATION
FIGURE 3 MARKET SIZE ESTIMATION METHODOLOGY: REVENUE OF MARKET PLAYERS
2.2.1 BOTTOM-UP APPROACH
FIGURE 4 MARKET SIZE ESTIMATION METHODOLOGY: BOTTOM-UP APPROACH
2.2.2 TOP-DOWN APPROACH
FIGURE 5 MARKET SIZE ESTIMATION METHODOLOGY: TOP-DOWN APPROACH
2.3 MARKET BREAKDOWN AND DATA TRIANGULATION
FIGURE 6 DATA TRIANGULATION
2.4 RESEARCH ASSUMPTIONS
2.5 RISK ASSESSMENT
2.6 LIMITATIONS
3 EXECUTIVE SUMMARY (Page No. - 46)
3.1 PRE-COVID-19 SCENARIO: NETWORK MONITORING MARKET
TABLE 1 PRE-COVID-19 SCENARIO: MARKET, 2020–2027 (USD MILLION)
3.2 POST-COVID-19: REALISTIC SCENARIO
TABLE 2 POST-COVID-19 REALISTIC SCENARIO: MARKET, 2020–2027 (USD MILLION)
3.3 POST-COVID-19: OPTIMISTIC SCENARIO
TABLE 3 POST-COVID-19 OPTIMISTIC SCENARIO: MARKET, 2020–2027 (USD MILLION)
3.4 POST-COVID-19: PESSIMISTIC SCENARIO
TABLE 4 POST-COVID-19 PESSIMISTIC SCENARIO: MARKET, 2020–2027 (USD MILLION)
FIGURE 7 MARKET: REALISTIC, PESSIMISTIC, AND OPTIMISTIC RECOVERY SCENARIOS (USD MILLION)
3.5 IMPACT OF COVID-19 ON MARKET
FIGURE 8 SOFTWARE & SERVICES SEGMENT TO GROW AT HIGHER CAGR DURING FORECAST PERIOD
FIGURE 9 100 GBPS BANDWIDTH EQUIPMENT SEGMENT TO REGISTER HIGHEST CAGR DURING FORECAST PERIOD
FIGURE 10 INFINIBAND SEGMENT TO EXHIBIT HIGHEST CAGR DURING FORECAST PERIOD
FIGURE 11 ENTERPRISES SEGMENT TO DOMINATE MARKET DURING FORECAST PERIOD
FIGURE 12 NORTH AMERICA HELD LARGEST SHARE OF MARKET IN 2021
4 PREMIUM INSIGHTS (Page No. - 53)
4.1 MAJOR OPPORTUNITIES IN NETWORK MONITORING MARKET
FIGURE 13 RISING NUMBER OF SMALL- AND MEDIUM-SIZED ENTERPRISES IN ASIA PACIFIC TO DRIVE GROWTH OF MARKET DURING FORECAST PERIOD
4.2 MARKET, BY BANDWIDTH (USD MILLION)
FIGURE 14 100 GBPS SEGMENT TO REGISTER HIGHEST CAGR DURING FORECAST PERIOD
4.3 MARKET, BY END USER
FIGURE 15 ENTERPRISES SEGMENT TO WITNESS HIGHEST GROWTH IN MARKET DURING FORECAST PERIOD
4.4 ASIA PACIFIC: MARKET, BY END USER AND COUNTRY, 2022
FIGURE 16 ENTERPRISES SEGMENT AND CHINA ARE LIKELY TO HOLD LARGEST SHARES OF MARKET IN 2022
4.5 GEOGRAPHIC SNAPSHOT OF MARKET
FIGURE 17 US TO HOLD LARGEST SHARE OF MARKET IN 2022
5 MARKET OVERVIEW (Page No. - 56)
5.1 INTRODUCTION
5.2 MARKET DYNAMICS
FIGURE 18 NETWORK MONITORING MARKET: MARKET DYNAMICS
5.2.1 DRIVERS
FIGURE 19 MARKET DRIVERS AND THEIR IMPACT
5.2.1.1 Rising demand for cloud services
FIGURE 20 GLOBAL CLOUD DATA CENTER IP TRAFFIC FROM 2015 TO 2021
5.2.1.2 Increase in internet multimedia content and web applications
5.2.1.3 Surging demand for resilient network monitoring systems to resolve downtime issues
5.2.1.4 Growing need for continuous monitoring due to rise in network complexities and security concerns
5.2.2 RESTRAINTS
FIGURE 21 MARKET RESTRAINTS AND THEIR IMPACT
5.2.2.1 Availability of free network monitoring tools
5.2.2.2 Issues related to compatibility
5.2.3 OPPORTUNITIES
FIGURE 22 MARKET OPPORTUNITIES AND THEIR IMPACT
5.2.3.1 Potential benefits of network monitoring for small- and medium-sized enterprises
5.2.3.2 Proliferation of Internet of Things (IoT) and Bring Your Own Device (BYOD) phenomenon
5.2.4 CHALLENGES
FIGURE 23 NETWORK MONITORING MARKET CHALLENGES AND THEIR IMPACT
5.2.4.1 Handling enormous amount of network performance data
5.2.4.2 High costs associated with network monitoring
5.3 SUPPLY CHAIN ANALYSIS
FIGURE 24 SUPPLY CHAIN ANALYSIS OF NETWORK MONITORING ECOSYSTEM
5.3.1 EXPERTS RESPONSIBLE FOR PLANNING AND REVISING FUNDS
5.3.2 RESEARCH AND DEVELOPMENT ENGINEERS
5.3.3 HARDWARE AND SOFTWARE PROVIDERS
5.3.4 NETWORK MONITORING SOLUTION PROVIDERS
5.3.5 DISTRIBUTORS AND SUPPLIERS
5.3.6 END USERS
5.3.7 AFTER-SALE SERVICE PROVIDERS
5.4 ECOSYSTEM/MARKET MAP
TABLE 5 PLAYERS AND THEIR ROLE IN ECOSYSTEM
5.5 TRENDS IMPACTING BUSINESSES OF CUSTOMERS
FIGURE 25 REVENUE SHIFT AND NEW REVENUE POCKETS FOR NETWORK MONITORING SYSTEM MANUFACTURERS
5.6 PORTER’S FIVE FORCE ANALYSIS
TABLE 6 IMPACT OF PORTERS FIVE FORCES ON NETWORK MONITORING MARKET
FIGURE 26 MARKET: PORTER’S FIVE FORCES ANALYSIS
5.6.1 INTENSITY OF COMPETITIVE RIVALRY
5.6.2 BARGAINING POWER OF SUPPLIERS
5.6.3 BARGAINING POWER OF BUYERS
5.6.4 THREAT OF SUBSTITUTES
5.6.5 THREAT OF NEW ENTRANTS
5.7 KEY STAKEHOLDERS AND BUYING CRITERIA
FIGURE 27 KEY STAKEHOLDERS IN BUYING PROCESS
TABLE 7 INFLUENCE OF STAKEHOLDERS IN BUYING PROCESS FOR TOP 3 END USERS (%)
5.7.1 BUYING CRITERIA
FIGURE 28 KEY BUYING CRITERIA FOR TOP 3 END USERS
TABLE 8 KEY BUYING CRITERIA FOR TOP 3 END USERS
5.8 CASE STUDIES
TABLE 9 ETSCOUT HELPED BANPARÁ-BANCO DO ESTADO DO PARÁ IN NETWORK MONITORING AS BANK EXTENDED ITS INFRASTRUCTURE
TABLE 10 NETSCOUT HELPED PHARMACEUTICAL COMPANY TO IMPROVE END-USER EXPERIENCE WITH NETSCOUT SMART VISIBILITY
TABLE 11 GIGAMON HELPED LOCKHEED MARTIN IMPROVE NETWORK PERFORMANCE BY ENHANCING CLOUD VISIBILITY
TABLE 12 NETSCOUT HELPED GLOBAL LAW FIRM TO ENHANCE NETWORK VISIBILITY AND MINIMIZE DISRUPTIONS IN THE NETWORK
TABLE 13 GIGAMON HELPED KBC BANKING TO SIMPLIFY ITS NETWORK MONITORING AND FORENSICS OPERATIONS
5.9 TECHNOLOGY ANALYSIS
5.9.1 INTEGRATION OF ARTIFICIAL INTELLIGENCE (AI) AND MACHINE LEARNING WITH NETWORK MONITORING TECHNOLOGY
5.9.2 ADOPTION OF PREDICTIVE ANALYTICS TO ENHANCE NETWORK PERFORMANCE MONITORING
5.10 TRADE ANALYSIS
5.10.1 IMPORT SCENARIO
5.10.1.1 Import scenario for network monitoring products
TABLE 14 IMPORT DATA, BY COUNTRY, 2017–2021 (USD MILLION)
5.10.2 EXPORT SCENARIO
5.10.2.1 Export scenario for network monitoring products
TABLE 15 EXPORT DATA, BY COUNTRY, 2017–2021 (USD MILLION)
5.11 PATENT ANALYSIS
TABLE 16 NUMBER OF PATENTS REGISTERED IN NETWORK MONITORING MARKET FROM 2011 TO 2021
FIGURE 29 TOP 10 COMPANIES WITH HIGHEST NUMBER OF PATENT APPLICATIONS BETWEEN 2011 AND 2021
FIGURE 30 NETWORK MONITORING PATENTS PUBLISHED BETWEEN 2011 AND 2021
TABLE 17 PATENT REGISTRATIONS RELATED TO MARKET
5.12 TARIFFS
TABLE 18 MFN TARIFFS FOR NETWORK MONITORING PRODUCTS EXPORTED BY US
TABLE 19 MFN TARIFFS FOR NETWORK MONITORING PRODUCTS EXPORTED BY CHINA
5.13 REGULATORY STANDARDS
TABLE 20 NORTH AMERICA: LIST OF REGULATORY BODIES, GOVERNMENT AGENCIES, AND OTHER ORGANIZATIONS
TABLE 21 EUROPE: LIST OF REGULATORY BODIES, GOVERNMENT AGENCIES, AND OTHER ORGANIZATIONS
TABLE 22 ASIA PACIFIC: LIST OF REGULATORY BODIES, GOVERNMENT AGENCIES, AND OTHER ORGANIZATIONS
TABLE 23 ROW: LIST OF REGULATORY BODIES, GOVERNMENT AGENCIES, AND OTHER ORGANIZATIONS
5.14 KEY CONFERENCES AND EVENTS BETWEEN 2022 AND 2023
TABLE 24 MARKET: DETAILED LIST OF CONFERENCES AND EVENTS
5.15 PRICING ANALYSIS
TABLE 25 NETWORK MONITORING HARDWARE COMPONENTS, SELLING PRICES
5.15.1 AVERAGE SELLING PRICES OF MARKET PLAYERS, BY OFFERING
FIGURE 31 AVERAGE SELLING PRICES OF KEY PLAYERS, BY OFFERING
TABLE 26 AVERAGE SELLING PRICES OF KEY PLAYERS, BY OFFERING (USD)
6 NETWORK MONITORING MARKET, BY OFFERING (Page No. - 91)
6.1 INTRODUCTION
TABLE 27 MARKET, BY OFFERING, 2018–2021 (USD MILLION)
FIGURE 32 SOFTWARE & SERVICES SEGMENT TO DOMINATE MARKET DURING FORECAST PERIOD
TABLE 28 MARKET, BY OFFERING, 2022–2027 (USD MILLION)
TABLE 29 MARKET, BY EQUIPMENT, 2018–2021 (USD MILLION)
TABLE 30 MARKET, BY EQUIPMENT, 2022–2027 (USD MILLION)
TABLE 31 MARKET, BY EQUIPMENT, 2018–2021 (THOUSAND UNITS)
TABLE 32 MARKET, BY EQUIPMENT, 2022–2027 (THOUSAND UNITS)
6.2 EQUIPMENT
6.2.1 NETWORK TAP
6.2.1.1 Network TAPs facilitate copying of traffic flowing across networks
6.2.1.2 Use Case: US Army deployed Garland Technology’s Network TAPs to prevent packet loss and capture traffic.
6.2.1.3 Use Case: HSBC Bank utilizes Network Critical’s Fiber Optical TAPs for monitoring its international network
6.2.1.3.1 Single-port network TAP
6.2.1.3.2 Aggregation TAP
6.2.1.3.3 Regeneration TAP
TABLE 33 NETWORK TAP: MARKET, BY TYPE, 2018–2021 (USD MILLION)
TABLE 34 NETWORK TAP: MARKET, BY TYPE, 2022–2027 (USD MILLION)
TABLE 35 NETWORK TAP: MARKET, BY REGION, 2018–2021 (USD MILLION)
TABLE 36 NETWORK TAP: MARKET, BY REGION, 2022–2027 (USD MILLION)
6.2.2 DATA MONITORING SWITCHES
6.2.2.1 Data monitoring switches or network packet brokers (NPBs) are utilized to direct traffic to exact and targeted network monitoring tools
6.2.2.2 Use Case: Intuit leveraged network monitoring solution offered by Arista Networks (US) to facilitate pervasive monitoring and security across multiple data centers
6.2.2.3 Use Case: Major gaming company “The Stars Group” chose network critical to increase monitoring accuracy and tighten security against network intrusion
TABLE 37 DATA MONITORING SWITCH: MARKET, BY REGION, 2018–2021 (USD MILLION)
TABLE 38 DATA MONITORING SWITCH: MARKET, BY REGION, 2022–2027 (USD MILLION)
6.3 SOFTWARE & SERVICES
6.3.1 SOFTWARE & SERVICES SEGMENT TO GROW AT HIGHER CAGR DURING FORECAST PERIOD
6.3.1.1 Use Case: Financial services company implements proactive business service monitoring with NETSCOUT’s software-based solution
7 NETWORK MONITORING MARKET, BY BANDWIDTH (Page No. - 102)
7.1 INTRODUCTION
FIGURE 33 100 GBPS BANDWIDTH EQUIPMENT SEGMENT TO REGISTER HIGHEST CAGR DURING FORECAST PERIOD
TABLE 39 MARKET, BY BANDWIDTH, 2018–2021 (USD MILLION)
TABLE 40 MARKET, BY BANDWIDTH, 2022–2027 (USD MILLION)
7.2 1 & 10 GBPS
7.2.1 1 & 10 GBPS BANDWIDTH EQUIPMENT SEGMENT TO HOLD LARGEST MARKET SHARE DURING FORECAST PERIOD
7.2.1.1 Use Case: Smithsonian Institution (US) leveraged network taps from Gigamon (US) for network monitoring
TABLE 41 1 & 10 GBPS BANDWIDTH EQUIPMENT: MARKET, BY TECHNOLOGY, 2018–2021 (USD MILLION)
TABLE 42 1 & 10 GBPS BANDWIDTH EQUIPMENT: MARKET, BY TECHNOLOGY, 2022–2027 (USD MILLION)
7.3 40 GBPS
7.3.1 GROWING USE OF VIRTUALIZATION TECHNOLOGY TO FUEL DEMAND FOR 40 GBPS NETWORK MONITORING EQUIPMENT
7.3.1.1 Use Case: Vodafone (UK) leveraged Network Critical’s hybrid TAP/Packet Broker that supports network speeds up to 40 Gbps
TABLE 43 40 GBPS BANDWIDTH EQUIPMENT: MARKET, BY TECHNOLOGY, 2018–2021 (USD MILLION)
TABLE 44 40 GBPS BANDWIDTH EQUIPMENT: MARKET, BY TECHNOLOGY, 2022–2027 (USD MILLION)
7.4 100 GBPS
7.4.1 RISING DEMAND FOR HIGH BANDWIDTH IN DATA CENTERS TO FUEL ADOPTION OF FAST 100 GIGABIT-PER-SECOND NETWORK MONITORING EQUIPMENT
7.4.1.1 Use Case: University of South Carolina (US) deployed Gigamon’s GigaVUE TA Series of visibility nodes to attain enhanced network visibility
FIGURE 34 INFINIBAND SUB-SEGMENT TO GROW AT HIGHEST CAGR IN MARKET FOR 100 GBPS BANDWIDTH DURING FORECAST PERIOD
TABLE 45 100 GBPS BANDWIDTH EQUIPMENT: MARKET, BY TECHNOLOGY, 2018–2021 (USD MILLION)
TABLE 46 100 GBPS BANDWIDTH EQUIPMENT: MARKET, BY TECHNOLOGY, 2022–2027 (USD MILLION)
8 NETWORK MONITORING MARKET, BY TECHNOLOGY (Page No. - 110)
8.1 INTRODUCTION
FIGURE 35 INFINIBAND SEGMENT TO GROW AT HIGHEST CAGR DURING FORECAST PERIOD
TABLE 47 MARKET, BY TECHNOLOGY, 2018–2021 (USD MILLION)
TABLE 48 MARKET, BY TECHNOLOGY, 2022–2027 (USD MILLION)
8.2 ETHERNET
8.2.1 ETHERNET SEGMENT HELD LARGEST MARKET SHARE IN 2021
8.2.1.1 Use Case: Heritage Credit Union saves more than USD 6,000 annually after deploying OpManager offered by ManageEngine (US) to monitor its network
TABLE 49 ETHERNET: MARKET, BY EQUIPMENT, 2018–2021 (USD MILLION)
TABLE 50 ETHERNET: MARKET, BY EQUIPMENT, 2022–2027 (USD MILLION)
TABLE 51 ETHERNET: MARKET, BY BANDWIDTH, 2018–2021 (USD MILLION)
TABLE 52 ETHERNET: MARKET, BY BANDWIDTH, 2022–2027 (USD MILLION)
8.3 FIBER OPTIC
8.3.1 GROWING DEMAND FOR FIBER OPTIC NETWORK MONITORING TO INCREASE NETWORK PRODUCTIVITY TO DRIVE MARKET GROWTH
8.3.1.1 Use Case: HSBC Bank utilizes Network Critical’s Fiber Optical TAPs for monitoring its international network
TABLE 53 FIBER OPTIC: MARKET, BY TYPE, 2018–2021 (USD MILLION)
TABLE 54 FIBER OPTIC: MARKET, BY TYPE, 2022–2027 (USD MILLION)
TABLE 55 FIBER OPTIC: MARKET, BY EQUIPMENT, 2018–2021 (USD MILLION)
TABLE 56 FIBER OPTIC: MARKET, BY EQUIPMENT, 2022–2027 (USD MILLION)
TABLE 57 FIBER OPTIC: MARKET, BY BANDWIDTH, 2018–2021 (USD MILLION)
TABLE 58 FIBER OPTIC: MARKET, BY BANDWIDTH, 2022–2027 (USD MILLION)
8.4 INFINIBAND
8.4.1 INFINIBAND SEGMENT TO EXHIBIT HIGHEST GROWTH DURING FORECAST PERIOD
8.4.1.1 Use Case: NETSCOUT helps sustain transformed financial service delivery to millions of customers and prospects
TABLE 59 INFINIBAND: MARKET, BY EQUIPMENT, 2018–2021 (USD MILLION)
TABLE 60 INFINIBAND: MARKET, BY EQUIPMENT, 2022–2027 (USD MILLION)
TABLE 61 INFINIBAND: MARKET, BY BANDWIDTH, 2018–2021 (USD MILLION)
TABLE 62 INFINIBAND: MARKET, BY BANDWIDTH, 2022–2027 (USD MILLION)
9 NETWORK MONITORING MARKET, BY END USER (Page No. - 119)
9.1 INTRODUCTION
TABLE 63 MARKET, BY END USER, 2018–2021 (USD MILLION)
FIGURE 36 ENTERPRISES SEGMENT TO DOMINATE MARKET DURING FORECAST PERIOD
TABLE 64 MARKET, BY END USER, 2022–2027 (USD MILLION)
9.2 ENTERPRISES
9.2.1 NETWORK MONITORING SOLUTIONS HELP ENTERPRISES IMPROVE THEIR NETWORK PERFORMANCE BY EXAMINING EVERY ASPECT OF NETWORK PROCESS
9.2.1.1 Use Case: Bombay Stock Exchange (BSE) deploys network monitoring solutions offered by Keysight Technologies (US)
9.2.1.2 Use Case: US-based financial services company deployed network monitoring solutions from Keysight Technologies (Ixia) to improve its network visibility
TABLE 65 ENTERPRISES: MARKET, BY REGION, 2018–2021 (USD MILLION)
TABLE 66 ENTERPRISES: MARKET, BY REGION, 2022–2027 (USD MILLION)
9.2.2 LARGE ENTERPRISES
9.2.2.1 Large enterprises sub-segment to dominate market during forecast period
9.2.3 SMALL- AND MEDIUM-SIZED ENTERPRISES
9.2.3.1 Small- and medium-sized enterprises sub-segment to grow at higher CAGR during forecast period
TABLE 67 ENTERPRISES: NETWORK MONITORING MARKET, BY TYPE, 2018–2021 (USD MILLION)
TABLE 68 ENTERPRISES: MARKET, BY TYPE, 2022–2027 (USD MILLION)
TABLE 69 ENTERPRISES: MARKET, BY BANDWIDTH, 2018–2021 (USD MILLION)
TABLE 70 ENTERPRISES: MARKET, BY BANDWIDTH, 2022–2027 (USD MILLION)
TABLE 71 SMALL- AND MEDIUM-SIZED ENTERPRISES: MARKET, BY REGION, 2018–2021 (USD MILLION)
TABLE 72 SMALL- AND MEDIUM-SIZED ENTERPRISES: MARKET, BY REGION, 2022–2027 (USD MILLION)
TABLE 73 LARGE ENTERPRISES: MARKET, BY REGION, 2018–2021 (USD MILLION)
TABLE 74 LARGE ENTERPRISES: MARKET, BY REGION, 2022–2027 (USD MILLION)
TABLE 75 ENTERPRISES: NORTH AMERICA MARKET, BY COUNTRY, 2018–2021 (USD MILLION)
FIGURE 37 US TO DOMINATE NORTH AMERICAN MARKET FOR ENTERPRISES DURING FORECAST PERIOD
TABLE 76 ENTERPRISES: NORTH AMERICA MARKET, BY COUNTRY, 2022–2027 (USD MILLION)
TABLE 77 ENTERPRISES: EUROPE MARKET, BY COUNTRY, 2018–2021 (USD MILLION)
TABLE 78 ENTERPRISES: EUROPE MARKET, BY COUNTRY, 2022–2027 (USD MILLION)
TABLE 79 ENTERPRISES: ASIA PACIFIC MARKET, BY COUNTRY, 2018–2021 (USD MILLION)
TABLE 80 ENTERPRISES: ASIA PACIFIC MARKET, BY COUNTRY, 2022–2027 (USD MILLION)
TABLE 81 ENTERPRISES: ROW MARKET, BY REGION, 2018–2021 (USD MILLION)
TABLE 82 ENTERPRISES: ROW MARKET, BY REGION, 2022–2027 (USD MILLION)
9.3 TELECOMMUNICATIONS INDUSTRY
9.3.1 NETWORK MONITORING SOLUTIONS HELP TELECOMMUNICATIONS INDUSTRY TO TRACK TELECOM INFRASTRUCTURE AND DETECT HARDWARE FAILURES OR DISCREPANCIES
9.3.1.1 Use Case: Prepaid Wireless Group (US) leveraged network TAPs and aggregators offered by Garland Technology to improve network visibility and reliability
TABLE 83 TELECOMMUNICATIONS INDUSTRY: NETWORK MONITORING MARKET, BY BANDWIDTH, 2018–2021 (USD MILLION)
TABLE 84 TELECOMMUNICATIONS INDUSTRY: MARKET, BY BANDWIDTH, 2022–2027 (USD MILLION)
TABLE 85 TELECOMMUNICATIONS INDUSTRY: MARKET, BY REGION, 2018–2021 (USD MILLION)
TABLE 86 TELECOMMUNICATIONS INDUSTRY: MARKET, BY REGION, 2022–2027 (USD MILLION)
TABLE 87 TELECOMMUNICATIONS INDUSTRY: NORTH AMERICA MARKET, BY COUNTRY, 2018–2021 (USD MILLION)
TABLE 88 TELECOMMUNICATIONS INDUSTRY: NORTH AMERICA MARKET, BY COUNTRY, 2022–2027 (USD MILLION)
TABLE 89 TELECOMMUNICATIONS INDUSTRY: EUROPE MARKET, BY COUNTRY, 2018–2021 (USD MILLION)
TABLE 90 TELECOMMUNICATIONS INDUSTRY: EUROPE MARKET, BY COUNTRY, 2022–2027 (USD MILLION)
FIGURE 38 CHINA TO DOMINATE ASIA PACIFIC MARKET FOR TELECOMMUNICATIONS INDUSTRY DURING FORECAST PERIOD
TABLE 91 TELECOMMUNICATIONS INDUSTRY: ASIA PACIFIC MARKET, BY COUNTRY, 2018–2021 (USD MILLION)
TABLE 92 TELECOMMUNICATIONS INDUSTRY: ASIA PACIFIC MARKET, BY COUNTRY, 2022–2027 (USD MILLION)
TABLE 93 TELECOMMUNICATIONS INDUSTRY: ROW MARKET, BY REGION, 2018–2021 (USD MILLION)
TABLE 94 TELECOMMUNICATIONS INDUSTRY: ROW MARKET, BY REGION, 2022–2027 (USD MILLION)
9.4 GOVERNMENT ORGANIZATIONS
9.4.1 NETWORK MONITORING SOLUTIONS AID GOVERNMENT ORGANIZATIONS IN RAPID DISASTER RECOVERY FROM NETWORK FAILURE
9.4.1.1 Use Case: Federal government agency deployed visibility solutions from Keysight Technologies (US) to prevent fraud and streamline customer experience
TABLE 95 GOVERNMENT ORGANIZATIONS: NETWORK MONITORING MARKET, BY BANDWIDTH, 2018–2021 (USD MILLION)
TABLE 96 GOVERNMENT ORGANIZATIONS: MARKET, BY BANDWIDTH, 2022–2027 (USD MILLION)
TABLE 97 GOVERNMENT ORGANIZATIONS: MARKET, BY REGION, 2018–2021 (USD MILLION)
TABLE 98 GOVERNMENT ORGANIZATIONS: MARKET, BY REGION, 2022–2027 (USD MILLION)
TABLE 99 GOVERNMENT ORGANIZATIONS: NORTH AMERICA MARKET, BY COUNTRY, 2018–2021 (USD MILLION)
TABLE 100 GOVERNMENT ORGANIZATIONS: NORTH AMERICA MARKET, BY COUNTRY, 2022–2027 (USD MILLION)
TABLE 101 GOVERNMENT ORGANIZATIONS: EUROPE MARKET, BY COUNTRY, 2018–2021 (USD MILLION)
TABLE 102 GOVERNMENT ORGANIZATIONS: EUROPE MARKET, BY COUNTRY, 2022–2027 (USD MILLION)
TABLE 103 GOVERNMENT ORGANIZATIONS: ASIA PACIFIC MARKET, BY COUNTRY, 2018–2021 (USD MILLION)
TABLE 104 GOVERNMENT ORGANIZATIONS: ASIA PACIFIC MARKET, BY COUNTRY, 2022–2027 (USD MILLION)
TABLE 105 GOVERNMENT ORGANIZATIONS: ROW MARKET, BY REGION, 2018–2021 (USD MILLION)
TABLE 106 GOVERNMENT ORGANIZATIONS: ROW MARKET, BY REGION, 2022–2027 (USD MILLION)
9.5 CLOUD SERVICE PROVIDERS
9.5.1 CLOUD SERVICE PROVIDERS ARE INCREASINGLY LEVERAGING NETWORK MONITORING SOLUTIONS TO KEEP COMPLEX CLOUD INFRASTRUCTURES ACTIVE
9.5.1.1 Use Case: Nutanix leveraged unified monitoring solution from Zenoss to maintain visibility and control across its IT infrastructure landscape
TABLE 107 CLOUD SERVICE PROVIDERS: NETWORK MONITORING MARKET, BY BANDWIDTH, 2018–2021 (USD MILLION)
TABLE 108 CLOUD SERVICE PROVIDERS: MARKET, BY BANDWIDTH, 2022–2027 (USD MILLION)
TABLE 109 CLOUD SERVICE PROVIDERS: MARKET, BY REGION, 2018–2021 (USD MILLION)
TABLE 110 CLOUD SERVICE PROVIDERS: MARKET, BY REGION, 2022–2027 (USD MILLION)
TABLE 111 CLOUD SERVICE PROVIDERS: NORTH AMERICA MARKET, BY COUNTRY, 2018–2021 (USD MILLION)
TABLE 112 CLOUD SERVICE PROVIDERS: NORTH AMERICA MARKET, BY COUNTRY, 2022–2027 (USD MILLION)
TABLE 113 CLOUD SERVICE PROVIDERS: EUROPE MARKET, BY COUNTRY, 2018–2021 (USD MILLION)
TABLE 114 CLOUD SERVICE PROVIDERS: EUROPE MARKET, BY COUNTRY, 2022–2027 (USD MILLION)
TABLE 115 CLOUD SERVICE PROVIDERS: ASIA PACIFIC MARKET, BY COUNTRY, 2018–2021 (USD MILLION)
TABLE 116 CLOUD SERVICE PROVIDERS: ASIA PACIFIC MARKET, BY COUNTRY, 2022–2027 (USD MILLION)
TABLE 117 CLOUD SERVICE PROVIDERS: ROW MARKET, BY REGION, 2018–2021 (USD MILLION)
TABLE 118 CLOUD SERVICE PROVIDERS: ROW MARKET, BY REGION, 2022–2027 (USD MILLION)
10 GEOGRAPHIC ANALYSIS (Page No. - 150)
10.1 INTRODUCTION
FIGURE 39 NETWORK MONITORING MARKET, BY REGION
FIGURE 40 GEOGRAPHIC SNAPSHOT: CHINA TO EMERGE AS POTENTIAL MARKET FOR NETWORK MONITORING BETWEEN 2022 AND 2027
TABLE 119 MARKET, BY REGION, 2018–2021 (USD MILLION)
FIGURE 41 ASIA PACIFIC TO REGISTER HIGHEST GROWTH DURING FORECAST PERIOD
TABLE 120 MARKET, BY REGION, 2022–2027 (USD MILLION)
10.2 NORTH AMERICA
FIGURE 42 NORTH AMERICA: SNAPSHOT OF MARKET
TABLE 121 NORTH AMERICA: MARKET, BY END USER, 2018–2021 (USD MILLION)
TABLE 122 NORTH AMERICA: MARKET, BY END USER, 2022–2027 (USD MILLION)
TABLE 123 NORTH AMERICA: MARKET, BY EQUIPMENT, 2018–2021 (USD MILLION)
TABLE 124 NORTH AMERICA: MARKET, BY EQUIPMENT, 2022–2027 (USD MILLION)
TABLE 125 NORTH AMERICA: MARKET, BY COUNTRY, 2018–2021 (USD MILLION)
TABLE 126 NORTH AMERICA: MARKET, BY COUNTRY, 2022–2027 (USD MILLION)
10.2.1 US
10.2.1.1 US to dominate North American market during forecast period
10.2.1.2 Use Case: Riverside County (US) enhanced its uptime and total visibility with Gigamon network monitoring solution
10.2.2 CANADA
10.2.2.1 Canada to hold significant share of North American market during forecast period
10.2.2.2 Use Case: Canada-based Telecom provider leveraged network monitoring solution from ManageEngine to enhance network visibility
10.2.3 MEXICO
10.2.3.1 Expanding telecommunications industry to drive market growth in Mexico
10.3 EUROPE
FIGURE 43 EUROPE: SNAPSHOT OF NETWORK MONITORING MARKET
TABLE 127 EUROPE: MARKET, BY END USER, 2018–2021 (USD MILLION)
TABLE 128 EUROPE: MARKET, BY END USER, 2022–2027 (USD MILLION)
TABLE 129 EUROPE: MARKET, BY EQUIPMENT, 2018–2021 (USD MILLION)
TABLE 130 EUROPE: MARKET, BY EQUIPMENT, 2022–2027 (USD MILLION)
TABLE 131 EUROPE: MARKET, BY COUNTRY, 2018–2021 (USD MILLION)
TABLE 132 EUROPE: MARKET, BY COUNTRY, 2022–2027 (USD MILLION)
10.3.1 UK
10.3.1.1 UK to hold significant share of European market during forecast period
10.3.1.2 Use Case: Bourne Leisure (UK) chose Network Critical to connect security tools economically and efficiently
10.3.2 GERMANY
10.3.2.1 German market to exhibit considerable growth during forecast period
10.3.2.2 Use Case: Truma (Germany) secured its production, business processes, and IT with Derdack and PRTG
10.3.3 ITALY
10.3.3.1 Growing cloud investments in Italy to provide impetus to deployment of network monitoring solutions
10.3.4 FRANCE
10.3.4.1 Increasing focus on 5G to contribute to growth of market in France
10.3.4.2 Use Case: LNA Santé (France) uses PRTG Network Monitor for monitoring IT network of its 72 nursing homes and healthcare institutions
10.3.5 SPAIN
10.3.5.1 Rising technological advancements in Spain to boost growth of market
10.3.5.2 Use Case: Telefónica (Spain) gains unified customer experience visibility across entire network by leveraging network monitoring solutions offered by Accedian Networks (Canada)
10.3.6 REST OF EUROPE
10.3.6.1 Use Case: VID Specialized University (Norway) leverages network monitoring solutions from Paessler (Germany) to proactively monitor systems, devices, traffic, and applications across IT infrastructure
10.3.6.2 Use Case: Maersk Group (Denmark) deployed network monitoring solutions from Riverbed Technology (US) to facilitate effective network monitoring and end-to-end visibility across its IT environment
10.4 ASIA PACIFIC
FIGURE 44 ASIA PACIFIC: SNAPSHOT OF NETWORK MONITORING MARKET
TABLE 133 ASIA PACIFIC: MARKET, BY END USER, 2018–2021 (USD MILLION)
TABLE 134 ASIA PACIFIC: MARKET, BY END USER, 2022–2027 (USD MILLION)
TABLE 135 ASIA PACIFIC: MARKET, BY EQUIPMENT, 2018–2021 (USD MILLION)
TABLE 136 ASIA PACIFIC: MARKET, BY EQUIPMENT, 2022–2027 (USD MILLION)
TABLE 137 ASIA PACIFIC: MARKET, BY COUNTRY, 2018–2021 (USD MILLION)
TABLE 138 ASIA PACIFIC: MARKET, BY COUNTRY, 2022–2027 (USD MILLION)
10.4.1 CHINA
10.4.1.1 China to dominate market in Asia Pacific during forecast period
10.4.1.2 Use Case: Chinese Bank leverages network monitoring solution from Riverbed Technology for monitoring and optimization of End User experience
10.4.2 JAPAN
10.4.2.1 Demand for high bandwidth in several sectors in Japan to propel market growth
10.4.2.2 Use Case: Japanese Telecom Operator KDDI Corporation Selects Kentik (US) for Network Traffic Intelligence
10.4.3 INDIA
10.4.3.1 Unprecedented increase in data consumption to fuel demand for network monitoring solutions in India
10.4.3.2 Use Case: Reliance Jio (India) leverages network monitoring solutions from Accedian Networks to enhance its network performance monitoring
10.4.4 SOUTH KOREA
10.4.4.1 Increasing focus on rolling out 5G network and eventual growth of data usage to drive market
10.4.4.2 Use Case: SK Telecom boosts capacity planning and improves operational efficiency with Skylight, network monitoring solution, from Accedian Networks (Canada)
10.4.5 REST OF ASIA PACIFIC
10.4.5.1 Use Case: Acurus (Australia) leverages PRTG Network Monitor for real-time network monitoring
10.4.5.2 Use Case: Universitas 21 Global (Singapore) leverages network monitoring solution by ManageEngine (US) for proactively monitoring its network infrastructure
10.5 ROW
FIGURE 45 ROW: SNAPSHOT OF NETWORK MONITORING MARKET
TABLE 139 ROW: MARKET, BY END USER, 2018–2021 (USD MILLION)
TABLE 140 MARKET IN ROW, BY END USER, 2022–2027 (USD MILLION)
TABLE 141 ROW: MARKET, BY EQUIPMENT, 2018–2021 (USD MILLION)
TABLE 142 ROW: MARKET, BY EQUIPMENT, 2022–2027 (USD MILLION)
TABLE 143 ROW: MARKET, BY REGION, 2018–2021 (USD MILLION)
TABLE 144 ROW: MARKET, BY REGION, 2022–2027 (USD MILLION)
10.5.1 MIDDLE EAST & AFRICA
10.5.1.1 Adoption of cloud services to boost the growth of market in Middle East & Africa
10.5.1.2 Use Case: ALYN Hospital (Israel) leveraged Paessler’s PRTG Network Monitor to complete major departmental restructuring during COVID-19 pandemic
10.5.1.3 Use Case: AXA Gulf insured against application downtime with Paessler’s network monitoring solution
10.5.2 SOUTH AMERICA
10.5.2.1 South America to hold larger share of RoW market
10.5.2.2 Use Case: Central 24 Horas (Brazil) deployed network monitoring solution for real-time monitoring
11 COMPETITIVE LANDSCAPE (Page No. - 184)
11.1 OVERVIEW
TABLE 145 NETWORK MONITORING MARKET: KEY GROWTH STRATEGIES ADOPTED BY COMPANIES FROM 2018 TO 2021
11.2 TOP 5 COMPANY REVENUE ANALYSIS
FIGURE 46 THREE-YEAR REVENUE ANALYSIS OF TOP 5 PLAYERS IN MARKET
11.3 MARKET SHARE ANALYSIS (2021)
TABLE 146 MARKET: DEGREE OF COMPETITION
11.4 COMPANY EVALUATION MATRIX
11.4.1 STAR
11.4.2 EMERGING LEADER
11.4.3 PERVASIVE
11.4.4 PARTICIPANT
FIGURE 47 MARKET, COMPANY EVALUATION MATRIX, 2021
11.5 STARTUP/SME EVALUATION MATRIX
TABLE 147 STARTUPS/SMES IN MARKET
11.5.1 PROGRESSIVE COMPANY
11.5.2 RESPONSIVE COMPANY
11.5.3 DYNAMIC COMPANY
11.5.4 STARTING BLOCK
FIGURE 48 MARKET, STARTUP/SME EVALUATION QUADRANT, 2021
TABLE 148 STARTUP MATRIX: DETAILED LIST OF KEY STARTUP/SMES
11.5.5 COMPETITIVE BENCHMARKING
TABLE 149 MARKET: COMPETITIVE BENCHMARKING OF KEY STARTUP/SMES
11.6 NETWORK MONITORING MARKET: COMPANY FOOTPRINT
TABLE 150 COMPANY FOOTPRINT
TABLE 151 COMPANY OFFERING FOOTPRINT
TABLE 152 COMPANY END USER FOOTPRINT
TABLE 153 COMPANY REGIONAL FOOTPRINT
11.7 COMPETITIVE SITUATIONS AND TRENDS
11.7.1 PRODUCT LAUNCHES
TABLE 154 PRODUCT LAUNCHES, 2019–2021
11.7.2 DEALS
TABLE 155 DEALS, 2019–2021
11.7.3 OTHERS
TABLE 156 OTHERS, 2019–2021
12 COMPANY PROFILES (Page No. - 204)
(Business Overview, Products/services/solutions Offered, Recent Developments, and MnM View (Key strengths/Right to Win, Strategic Choices Made, and Weaknesses and Competitive Threats))*
12.1 KEY PLAYERS
12.1.1 GIGAMON
TABLE 157 GIGAMON: BUSINESS OVERVIEW
12.1.2 NETSCOUT
TABLE 158 NETSCOUT: BUSINESS OVERVIEW
FIGURE 49 NETSCOUT: COMPANY SNAPSHOT
12.1.3 KEYSIGHT TECHNOLOGIES
TABLE 159 KEYSIGHT TECHNOLOGIES: BUSINESS OVERVIEW
FIGURE 50 KEYSIGHT TECHNOLOGIES: COMPANY SNAPSHOT
12.1.4 VIAVI
TABLE 160 VIAVI: BUSINESS OVERVIEW
FIGURE 51 VIAVI SOLUTIONS: COMPANY SNAPSHOT
12.1.5 APCON
TABLE 161 APCON: BUSINESS OVERVIEW
12.1.6 GARLAND TECHNOLOGY
TABLE 162 GARLAND TECHNOLOGY: BUSINESS OVERVIEW
12.1.7 JUNIPER NETWORKS, INC.
TABLE 163 JUNIPER NETWORKS: BUSINESS OVERVIEW
FIGURE 52 JUNIPER NETWORKS: COMPANY SNAPSHOT
12.1.8 CISCO
TABLE 164 CISCO: BUSINESS OVERVIEW
FIGURE 53 CISCO: COMPANY SNAPSHOT
12.1.9 BROADCOM
TABLE 165 BROADCOM: BUSINESS OVERVIEW
FIGURE 54 BROADCOM: COMPANY SNAPSHOT
12.1.10 ARISTA NETWORKS
TABLE 166 ARISTA NETWORKS: BUSINESS OVERVIEW
FIGURE 55 ARISTA NETWORKS: COMPANY SNAPSHOT
12.1.11 ZENOSS
TABLE 167 ZENOSS: BUSINESS OVERVIEW
12.2 OTHER PLAYERS
12.2.1 NETWORK CRITICAL
12.2.2 CALIENT
12.2.3 NETGEAR
12.2.4 MOTADATA
12.2.5 LOGICMONITOR
12.2.6 COLASOFT
12.2.7 SEVONE
12.2.8 RIVERBED TECHNOLOGY
12.2.9 ACCEDIAN NETWORKS
12.2.10 EXTRAHOP
12.2.11 SOLARWINDS
12.2.12 MANAGEENGINE (ZOHO CORP)
12.2.13 LIVEACTION
12.2.14 AUVIK NETWORKS
12.2.15 PAESSLER
12.2.16 FLOWMON NETWORKS
12.2.17 APPNETA
12.2.18 ZABBIX
12.2.19 DATADOG
12.2.20 KENTIK
12.2.21 DOMOTZ
*Details on Business Overview, Products/services/solutions Offered, Recent Developments, and MnM View (Key strengths/Right to Win, Strategic Choices Made, and Weaknesses and Competitive Threats) might not be captured in case of unlisted companies.
13 APPENDIX (Page No. - 267)
13.1 DISCUSSION GUIDE
13.2 KNOWLEDGE STORE: MARKETSANDMARKETS’ SUBSCRIPTION PORTAL
13.3 AVAILABLE CUSTOMIZATIONS
13.4 RELATED REPORTS
13.5 AUTHOR DETAILS
The study involved four major activities in estimating the size for network monitoring market. Exhaustive secondary research was done to collect information on the market, peer market, and parent market. The next step was to validate these findings, assumptions, and sizing with industry experts across value chains through primary research. The bottom-up approach was employed to estimate the overall market size. After that, market breakdown and data triangulation were used to estimate the market size of segments and subsegments.
Secondary Research
In the secondary research process, various sources were used to identify and collect information important for this study. These include annual reports, press releases & investor presentations of companies, white papers, technology journals, and certified publications, articles by recognized authors, directories, and databases.
Secondary research was mainly used to obtain key information about the supply chain of the industry, the total pool of market players, classification of the market according to industry trends to the bottom-most level, regional markets, and key developments from the market and technology-oriented perspectives.
Primary research was also conducted to identify the segmentation types, key players, competitive landscape, and key market dynamics such as drivers, restraints, opportunities, challenges, and industry trends, along with key strategies adopted by players operating in the network monitoring y market. Extensive qualitative and quantitative analyses were performed on the complete market engineering process to list key information and insights throughout the report.
Primary Research
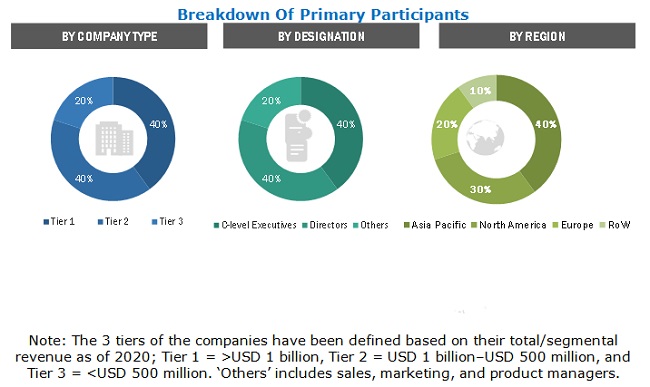
Extensive primary research has been conducted after acquiring knowledge about the network monitoring market scenario through secondary research. Several primary interviews have been conducted with experts from both demand (end users) and supply side (network monitoring offering providers) across 4 major geographic regions: North America, Europe, Asia Pacific, and RoW. Approximately 80% and 20% of the primary interviews have been conducted from the supply and demand side, respectively. These primary data have been collected through questionnaires, emails, and telephonic interviews.
To know about the assumptions considered for the study, download the pdf brochure
Market Size Estimation
In the complete market engineering process, both top-down and bottom-up approaches were implemented, along with several data triangulation methods, to estimate and validate the size of the network monitoring market and various other dependent submarkets. Key players in the market were identified through secondary research, and their market share in the respective regions was determined through primary and secondary research. This entire research methodology included the study of annual and financial reports of the top players, as well as interviews with experts (such as CEOs, VPs, directors, and marketing executives) for key insights (quantitative and qualitative).
All percentage shares, splits, and breakdowns were determined using secondary sources and verified through primary sources. All the possible parameters that affect the markets covered in this research study were accounted for, viewed in detail, verified through primary research, and analyzed to obtain the final quantitative and qualitative data. This data was consolidated and supplemented with detailed inputs and analysis from MarketsandMarkets and presented in this report.
Network Monitoring Market: Bottom-Up Approach
To know about the assumptions considered for the study, Request for Free Sample Report
Data Triangulation
After arriving at the overall market size from the market size estimation process as explained above, the total market has been split into several segments and subsegments. To complete the overall market engineering process and arrive at the exact statistics for all segments and subsegments, market breakdown and data triangulation procedures have been employed, wherever applicable. The data have been triangulated by studying various factors and trends from both demand and supply side. Along with this, the market has been validated using top-down and bottom-up approaches.
Report Objectives
- To define, describe, segment, and forecast the network monitoring market, in terms of value, based on bandwidth, offering, technology, end user, and region
- To forecast the size of the market, by region—North America, Europe, Asia Pacific, and the Rest of the World (RoW)—in terms of value
- To forecast the network monitoring market size, in terms of volume, by offering
- To provide detailed information regarding the drivers, restraints, opportunities, and challenges influencing the growth of the network monitoring market
- To strategically analyze the micromarkets1 with respect to the individual growth trends, prospects, and their contribution to the network monitoring market
- To map the competitive landscape based on company profiles, key player strategies, and key developments
- To provide a detailed overview of the network monitoring value chain and ecosystem
- To provide information about the key technology trends and patents related to the network monitoring market
- To provide information regarding trade data related to the network monitoring market
- To identify the key players operating in the network monitoring market and comprehensively analyze their market shares and core competencies2
- To analyze opportunities in the market for stakeholders by identifying high-growth segments of the network monitoring ecosystem
- To benchmark the market players using the proprietary company evaluation matrix framework, which analyzes them on various parameters within the broad categories of market ranking/share and product portfolio
- To analyze competitive developments such as contracts, acquisitions, product launches, collaborations, partnerships, and research and development (R&D) in the network monitoring
- To analyze the impact of COVID-19 on the growth of the network monitoring market
Available Customizations
With the given market data, MarketsandMarkets offers customizations according to the company’s specific needs. The following customization options are available for the report:
Product Analysis
- Product matrix that gives a detailed comparison of the product portfolio of each company
Company Information
- Detailed analysis and profiling of additional market players (up to 7)
Growth opportunities and latent adjacency in Network Monitoring Market