Neurodiagnostics Market by Product (Diagnostic & Imaging Systems (MRI, Ultrasound), Clinical Testing (PCR, NGS), Reagents & Consumables), Disease Pathology (Epilepsy, Stroke), End User and Region - Global Forecasts to 2024


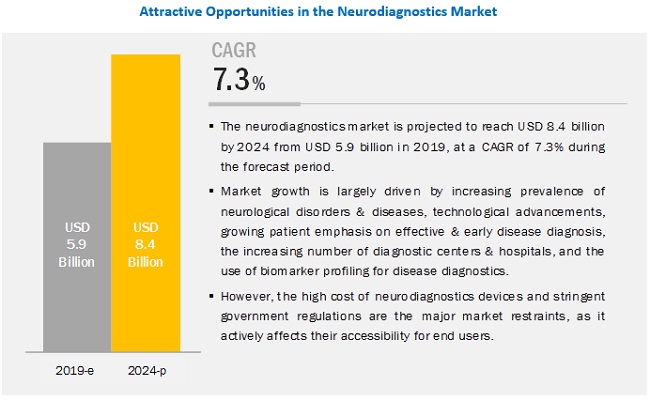
The neurodiagnostics market is projected to reach USD 8.4 billion by 2024, at a CAGR of 7.3%. The demand for neurodiagnostics products is expected to grow mainly due to factors such as the increasing prevalence of neurological disorders & diseases, technological advancements, growing patient emphasis on effective & early disease diagnosis, the growing number of diagnostic centers & hospitals, and the use of biomarker profiling for disease diagnostics.
The neurodegenerative diseases segment accounted for the largest share of the neurodiagnostics market by condition in 2018
The market, by condition, is segmented into neurodegenerative diseases, epilepsy, stroke, headache disorders, sleep disorders, and other conditions (includes autism, schizophrenia, Williams syndrome, Landau-Kleffner syndrome, depression, attention-deficit hyperactivity disorder (ADHD), and dyslexia). In 2019, the neurodegenerative diseases segment is expected to account for the largest share of the neurodiagnostics market. The increasing incidence of traumatic brain injuries, dementia, Parkinson’s disease, and Huntington’s disease, and the growing number of neurological examinations for the diagnosis of these conditions are driving the growth of this market segment.
The hospitals & surgical centers end-user segment accounted for the largest share of the neurodiagnostics market in 2018
Based on end-user, the market is segmented into hospitals & surgical centers, diagnostic laboratories & imaging centers, neurology centers, ambulatory care centers (ACCs), and research laboratories & academic institutes. In 2018, hospitals & surgical centers accounted for the largest share of the neurodiagnostics market. The large share of this end-user segment can primarily be attributed to the financial capabilities of hospitals to purchase expensive equipment, such as neurodiagnostic devices. Hospitals also have a more significant number of trained professionals to perform complex diagnostic procedures using neurodiagnostic tools than any other end-user segment, which is another major factor driving market growth.
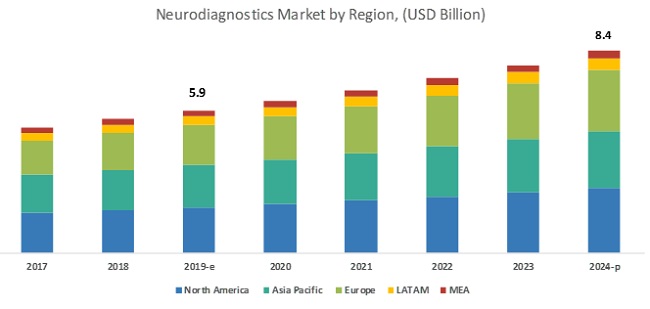
North America accounted for the largest share of the neurodiagnostics market in 2018
North America accounted for the largest share of the market. North America is a well-established market for medical devices. The presence of a highly developed healthcare system, high adoption of innovative neurodiagnostic tools among medical professionals, full availability of advanced neurodiagnostic tools, and the large number of neurodiagnostic devices manufacturing companies that have an established base or are headquartered in the US are the major factors driving the market in North America.
Neurodiagnostics Market Key Players
Some of the players in the neurodiagnostics market are GE Healthcare (US), Siemens Healthineers (Germany), Philips Healthcare (Netherlands), Canon, Inc. (Japan), Hitachi, Ltd. (Japan), Lifelines Neuro Company, LLC (US), Natus Medical Incorporated (US), Hoffman-La Roche AG (Switzerland), FUJIFILM Holdings Corporation (Japan), Mitsar Co., Ltd. (Russia), Advanced Brain Monitoring (US), Thermo Fisher Scientific, Inc. (US), Bio-Rad Laboratories (US), QIAGEN N.V. (Netherlands), and Nihon Kohden Corporation (Japan) among others.
An analysis of the market developments between 2016 and 2019 revealed that product launches & enhancements, partnerships, agreements, and acquisitions were adopted by market players to strengthen their product portfolios and maintain a competitive position in the neurodiagnostics market. Alliances and agreements were the most widely adopted growth strategies.
GE Healthcare is the top player in the global market. The company offers various diagnostic imaging modalities and services for neurodiagnostic procedures in the market. To sustain its leadership position and ensure its future growth, the company has been focusing on product launches, strategic agreements, and collaborations. The company also tries to evaluate new, emerging, and complementary technologies to identify new product opportunities.
Scope of the Report
|
Report Metric |
Details |
|
Market size available for years |
2017–2024 |
|
Base year considered |
2018 |
|
Forecast period |
2019–2024 |
|
Forecast units |
Value (USD) |
|
Segments covered |
Product, condition, end-user, and region |
|
Geographies covered |
North America (US and Canada), Europe (Germany, France, UK, Spain, Italy, and the Rest of Europe), Asia Pacific (China, Japan, Australia, India, South Korea and the Rest of Asia Pacific), Latin America (Brazil, Mexico, and the Rest of LATAM), and the Middle East and Africa |
|
Companies covered |
Major players covered include GE Healthcare (US), Siemens Healthineers (Germany), Philips Healthcare (Netherlands), Hitachi, Ltd. (Japan), Canon, Inc. (Japan), Lifelines Neuro Company, LLC (US), Natus Medical Incorporated (US), Hoffman-La Roche AG (Switzerland), FUJIFILM Holdings Corporation (Japan), Mitsar Co., Ltd. (Russia), Advanced Brain Monitoring (US), Thermo Fisher Scientific, Inc. (US), Bio-Rad Laboratories (US), QIAGEN N.V. (Netherlands), Nihon Kohden Corporation (Japan), ANT Neuro (Netherlands), Fonar Corporation (US), Fujirebio (Japan), DRG Instruments GmbH (Germany), Tecan Trading AG (Switzerland), Motion Lab Systems, Inc. (US), Rigaku Corporation (Japan), Neusoft Medical Systems Co., Ltd. (US), ELMIKO MEDICAL Sp. Z o.o. (Poland) and Ridge Diagnostics (US). |
This research report categorizes the neurodiagnostics market into the following segments and subsegments:
By Product
- Introduction
-
Diagnostic and Imaging Systems
- Electroencephalogram (EEG) Systems
- Electromyography (EMG) Products
- Magnetic Resonance Imaging (MRI) Systems
- Ultrasound Imaging Systems
- Computed Tomography (CT) Scanner
- Magnetoencephalogram (MEG) System
- Position emission tomography (PET) System
- Angiography System
- Other Systems
-
Clinical Testing Instruments
- PCR
- Next-Generation Sequencing (NGS)
- Sanger Sequencing
- Other Clinical Diagnostic Products
-
Reagents & Consumables
- Media and Serra
- Solvents
- Enzymes, Protein & Peptides
- Probes
- Buffers
- Antibodies
- Other Reagents
By Condition
- Neuro Degenerative Diseases
- Epilepsy
- Stroke
- Headache Disorders
- Sleep Disorders
- Other Diseases
By End-User
- Hospitals and Surgery Centers
- Neurology Centers
- Ambulatory Care Centers
- Diagnostic Laboratories & Imaging Centers
- Research Laboratories & Academic Institutes
By Region
-
North America
- US
- Canada
-
Europe
- Germany
- France
- UK
- Spain
- Italy
- RoE
-
Asia Pacific
- China
- Japan
- Australia
- South Korea
- India
- RoAPAC
-
Latin America
- Brazil
- Mexico
- RoLATAM
- Middle East and Africa
Recent Developments (2016-2019):
- In February 2019, Philips Healthcare (Netherlands) launched the Incisive CT Platform and Ingenia Ambition 1.5T MRI System.
- In September 2018, Royal Philips entered into two 20-year agreements for managed equipment services, where it has agreed to provide delivery, optimization, replacement, and maintenance services for all major medical imaging solutions in Australia and the ASEAN Pacific region.
- In March 2018, GE Healthcare (US) launched its SIGNA Premier 3.0T magnetic resonance imaging (MRI) system in Canada
- In March 2018, Siemens Healthineers (Germany) launched Magnetom Sola (1.5T) MRI System.
- In January 2018, Lifelines Neuro Company (US) acquired Incereb Ltd. (Ireland) to increase R&D spending for strengthening its product portfolio and expand its distribution network across the European market. Incereb is a manufacturer of neon neonatal EEG systems.
Key Questions Addressed by the Report:
- What are the growth opportunities related to the adoption of neurodiagnostics products across significant regions in the future?
- Emerging countries have immense opportunities for the growth and adoption of diagnostic and imaging systems, clinical testing instruments, and related reagents & consumables. Will this scenario continue in the next five years?
- Where will the advancements in products offered by various companies take the industry in the mid- to long-term?
- What are the newest trends and advancements in the neurodiagnostics market?
To speak to our analyst for a discussion on the above findings, click Speak to Analyst
 Exclusive indicates content/data unique to MarketsandMarkets and not available with any competitors.
Table of Contents
1 Introduction (Page No. - 20)
1.1 Objectives of the Study
1.2 Market Definition
1.3 Market Scope
1.3.1 Markets Covered
1.3.2 Years Considered for the Study
1.4 Currency Used for the Study
1.5 Major Market Stakeholders
2 Research Methodology (Page No. - 23)
2.1 Research Data
2.1.1 Secondary Data
2.1.1.1 Secondary Sources
2.1.2 Primary Data
2.2 Market Estimation Methodology
2.2.1 End User-Based Market Estimation
2.2.2 Revenue Mapping-Based Market Estimation
2.2.3 Primary Research Validation
2.3 Data Triangulation
2.4 Research Assumptions
2.5 Research Limitations
3 Executive Summary (Page No. - 31)
4 Premium Insights (Page No. - 35)
4.1 Market Overview
4.2 Neurodiagnostics Market, By Product, 2019 Vs. 2024
4.3 Market Share, By End User and Region (2019)
4.4 Market, By Condition, 2019 Vs. 2024 (USD Million)
4.5 Market, By Country
5 Market Overview (Page No. - 40)
5.1 Introduction
5.2 Market Dynamics
5.2.1 Drivers
5.2.1.1 Increasing Prevalence of Neurological Diseases & Disorders
5.2.1.2 Technological Advancements
5.2.1.3 Growing Patient Emphasis on Effective and Early Disease Diagnosis
5.2.1.4 Increasing Number of Diagnostic Centers & Hospitals
5.2.1.5 Advances in Genomics and Proteomics for the Diagnosis of Neurodegenerative Disorders
5.2.2 Restraints
5.2.2.1 High Cost of Neurodiagnostic Devices
5.2.2.2 Growing Adoption of Refurbished Neurodiagnostic Systems
5.2.3 Opportunities
5.2.3.1 Increasing Application in Clinical Trials
5.2.3.2 Emerging Markets
5.2.4 Challenges
5.2.4.1 Dearth of Skilled Surgeons
6 Neurodiagnostics Market, By Product (Page No. - 46)
6.1 Introduction
6.2 Diagnostic Imaging Systems
6.2.1 Growing Number of Diagnostic Laboratories & Imaging Centers to Drive the Adoption of Diagnostic Imaging Systems
6.2.1.1 MRI Systems
6.2.1.2 EEG Systems
6.2.1.3 CT Scanners
6.2.1.4 PET Scanners
6.2.1.5 EMG Devices
6.2.1.6 Ultrasound Imaging Systems
6.2.1.7 MEG Devices
6.2.1.8 Angiography Systems
6.2.1.9 Other Diagnostic Imaging Systems
6.3 Clinical Diagnostic Instruments
6.3.1 Increasing Public-Private Investments are Supporting the Growth of This Market Segment
6.3.1.1 PCR Instruments
6.3.1.2 NGS Instruments
6.3.1.3 Sanger Sequencers
6.3.1.4 Other Clinical Diagnostic Instruments
6.4 Reagents & Consumables
6.4.1 High Consumption of Reagents in Various Routine Assays & Techniques is Driving the Growth of This Segment
6.4.1.1 Media & Sera
6.4.1.2 Antibodies
6.4.1.3 Buffers
6.4.1.4 Solvents
6.4.1.5 Enzymes, Proteins, & Peptides
6.4.1.6 Probes
6.4.1.7 Other Reagents & Consumables
7 Neurodiagnostics Market, By Condition (Page No. - 87)
7.1 Introduction
7.2 Neurodegenerative Diseases
7.2.1 Growing Number of Neurological Examinations is Supporting the Growth of This Segment
7.3 Stroke
7.3.1 Growing Awareness About Strokes & Its Treatment Options in the Market are Supporting Market Growth
7.4 Epilepsy
7.4.1 Favorable Government Initiatives Have Resulted in the Increased Adoption of Neurodiagnostic Products
7.5 Headache Disorders
7.5.1 Increasing Incidence of Migraines & Tension Headaches to Support Market Growth
7.6 Sleep Disorders
7.6.1 Increasing Stress & Unhealthy Lifestyles are Supporting the Growth of This Market Segment
8 Neurodiagnostics Market, By End User (Page No. - 95)
8.1 Introduction
8.2 Hospitals & Surgical Centers
8.2.1 Hospitals & Surgical Centers are the Major End Users of Neurodiagnostic Devices Owing to Their High Purchasing Power to Buy Expensive Equipment
8.3 Diagnostic Laboratories & Imaging Centers
8.3.1 Growing Number of Private Imaging Centers Supports the Growth of This End-User Segment
8.4 Neurology Centers
8.4.1 Lower Costs and Shorter Waiting Periods Compared to Hospitals to Drive Market Growth
8.5 Ambulatory Care Centers
8.5.1 High-Quality and Lower-Cost Services Offered By Ambulatory Care Centers to Drive Market Growth
8.6 Research Laboratories & Academic Institutes
8.6.1 Budgetary Limitations Faced By Small Research Laboratories & Academic Institutes Will Restrain Market Growth
9 Neurodiagnostics Market, By Region (Page No. - 102)
9.1 Introduction
9.2 North America
9.2.1 US
9.2.1.1 US Dominates the Market Due to the Increased Adoption of High-End Neurodiagnostic Systems
9.2.2 Canada
9.2.2.1 Favorable Environment for R&D in the Field of Neurosciences is Driving Market Growth
9.3 Europe
9.3.1 Germany
9.3.1.1 Germany Commands the Largest Share of the Neurodiagnostics Market in Europe
9.3.2 UK
9.3.2.1 Market Growth in the UK is Mainly Driven By the Increasing Incidence of Neurodegenerative Diseases
9.3.3 France
9.3.3.1 Increasing Healthcare Expenditure Coupled With the High-End Medical Infrastructure Will Drive Demand for Neurodiagnostic Devices
9.3.4 Italy
9.3.4.1 Ongoing Economic Crisis in the Country and Rising Government Pressure to Reduce Healthcare Costs May Slow Market Growth
9.3.5 Spain
9.3.5.1 Increased Cost Burden on the State-Run Health Insurance System Will Hinder Market Growth
9.3.6 Rest of Europe
9.4 Asia Pacific
9.4.1 Japan
9.4.1.1 Favorable Reimbursement and Growing Neurological Disorder Patients Have Propelled Market Growth in Japan
9.4.2 China
9.4.2.1 Government Initiatives to Modernize Healthcare Facilities and the Rising Geriatric Population Will Drive Market Growth
9.4.3 India
9.4.3.1 Low Entry Barriers Have Made India a Prominent Market to Invest In
9.4.4 Australia
9.4.4.1 Technology Advancements and Improving Healthcare Infrastructure Will Drive the Market in Australia
9.4.5 South Korea
9.4.5.1 Rising Healthcare Spending and Medical Coverage for Neurological Disease Treatment Will Propel the Market Growth
9.4.6 Rest of Asia Pacific
9.5 Latin America
9.5.1 Brazil
9.5.1.1 Inadequate Accessibility to Healthcare has Driven the Government to Undertake Corrective Measures
9.5.2 Mexico
9.5.2.1 Mexico is a Prominent Medical Tourism Hub for US Patients
9.5.3 Rest of Latin America
9.6 Middle East & Africa
9.6.1 Infrastructural Development and Growing Healthcare Expenditure Will Contribute to Market Growth in the MEA
10 Competitive Landscape (Page No. - 165)
10.1 Overview
10.2 Market Share Analysis
10.3 Competitive Scenario
10.3.1 Key Product Launches
10.3.2 Key Expansions
10.3.3 Key Acquisitions
10.3.4 Key Partnerships, Agreements, and Collaborations
10.4 Competitive Leadership Mapping
10.4.1 Visionary Leaders
10.4.2 Innovators
10.4.3 Dynamic Differentiators
10.4.4 Emerging Companies
11 Company Profiles (Page No. - 172)
(Business Overview, Products Offered, Recent Developments, MnM View)*
11.1 GE Healthcare
11.2 Philips Healthcare
11.3 Siemens Healthineers
11.4 Hitachi, Ltd.
11.5 Canon, Inc.
11.6 Lifelines Neuro Company, LLC
11.7 Natus Medical Incorporated
11.8 F. Hoffmann-La Roche AG
11.9 FUJIFILM Holdings Corporation
11.10 Mitsar Co., Ltd.
11.11 Advanced Brain Monitoring, Inc.
11.12 Thermo Fisher Scientific, Inc.
11.13 Bio-Rad Laboratories
11.14 QIAGEN N.V.
11.15 Nihon Kohden Corporation
11.16 Other Companies
11.16.1 ANT Neuro
11.16.2 Fonar Corporation
11.16.3 Fujirebio (A Part of Miraca Group)
11.16.4 DRG Instruments GmbH
11.16.5 Tecan Trading AG
*Business Overview, Products Offered, Recent Developments, MnM View Might Not be Captured in Case of Unlisted Companies.
12 Appendix (Page No. - 213)
12.1 Discussion Guide
12.2 Knowledge Store: Marketsandmarkets’ Subscription Portal
12.3 Available Customizations
12.4 Related Reports
12.5 Author Details
List of Tables (189 Tables)
Table 1 Neurodiagnostics Market, By Product, 2017–2024 (USD Million)
Table 2 Diagnostic Imaging Systems Market, By Type, 2017–2024 (USD Million)
Table 3 Diagnostic Imaging Systems Market, By Region, 2017–2024 (USD Million)
Table 4 Diagnostic Imaging Systems Market, By Condition, 2017–2024 (USD Million)
Table 5 Diagnostic Imaging Systems Market, By End User, 2017–2024 (USD Million)
Table 6 MRI Systems Market, By Region, 2017–2024 (USD Million)
Table 7 MRI Systems Market, By Condition, 2017–2024 (USD Million)
Table 8 MRI Systems Market, By End User, 2017–2024 (USD Million)
Table 9 EEG Systems Market, By Region, 2017–2024 (USD Million)
Table 10 EEG Systems Market, By Condition, 2017–2024 (USD Million)
Table 11 EEG Systems Market, By End User, 2017–2024 (USD Million)
Table 12 CT Scanners Market, By Region, 2017–2024 (USD Million)
Table 13 CT Scanners Market, By Condition, 2017–2024 (USD Million)
Table 14 CT Scanners Market, By End User, 2017–2024 (USD Million)
Table 15 PET Scanners Market, By Region, 2017–2024 (USD Million)
Table 16 PET Scanners Market, By Condition, 2017–2024 (USD Million)
Table 17 PET Scanners Market, By End User, 2017–2024 (USD Million)
Table 18 EMG Devices Market, By Region, 2017–2024 (USD Million)
Table 19 EMG Devices Market, By Condition, 2017–2024 (USD Million)
Table 20 EMG Devices Market, By End User, 2017–2024 (USD Million)
Table 21 Ultrasound Imaging Systems Market, By Region, 2017–2024 (USD Million)
Table 22 Ultrasound Imaging Systems Market, By Condition, 2017–2024 (USD Million)
Table 23 Ultrasound Imaging Systems Market, By End User, 2017–2024 (USD Million)
Table 24 MEG Devices Market, By Region, 2017–2024 (USD Million)
Table 25 MEG Devices Market, By Condition, 2017–2024 (USD Million)
Table 26 MEG Devices Market, By End User, 2017–2024 (USD Million)
Table 27 Angiography Systems Market, By Region, 2017–2024 (USD Million)
Table 28 Angiography Systems Market, By Condition, 2017–2024 (USD Million)
Table 29 Angiography Systems Market, By End User, 2017–2024 (USD Million)
Table 30 Other Diagnostic Imaging Systems Market, By Region, 2017–2024 (USD Million)
Table 31 Other Diagnostic Imaging Systems Market, By Condition, 2017–2024 (USD Million)
Table 32 Other Diagnostic Imaging Systems Market, By End User, 2017–2024 (USD Million)
Table 33 Clinical Diagnostic Instruments Market, By Type, 2017–2024 (USD Million)
Table 34 Clinical Diagnostic Instruments Market, By Region, 2017–2024 (USD Million)
Table 35 Clinical Diagnostic Instruments Market, By Condition, 2017–2024 (USD Million)
Table 36 Clinical Diagnostic Instruments Market, By End User, 2017–2024 (USD Million)
Table 37 PCR Instruments Market, By Region, 2017–2024 (USD Million)
Table 38 PCR Instruments Market, By Condition, 2017–2024 (USD Million)
Table 39 PCR Instruments Market, By End User, 2017–2024 (USD Million)
Table 40 NGS Instruments Market, By Region, 2017–2024 (USD Million)
Table 41 NGS Instruments Market, By Condition, 2017–2024 (USD Million)
Table 42 NGS Instruments Market, By End User, 2017–2024 (USD Million)
Table 43 Sanger Sequencers Market, By Region, 2017–2024 (USD Million)
Table 44 Sanger Sequencers Market, By Condition, 2017–2024 (USD Million)
Table 45 Sanger Sequencers Market, By End User, 2017–2024 (USD Million)
Table 46 Other Clinical Diagnostic Instruments Market, By Region, 2017–2024 (USD Million)
Table 47 Other Clinical Diagnostic Instruments Market, By Condition, 2017–2024 (USD Million)
Table 48 Other Clinical Diagnostic Instruments Market, By End User, 2017–2024 (USD Million)
Table 49 Reagents & Consumables Market, By Type, 2017–2024 (USD Million)
Table 50 Reagents & Consumables Market, By Region, 2017–2024 (USD Million)
Table 51 Reagents & Consumables Market, By Condition, 2017–2024 (USD Million)
Table 52 Reagents & Consumables Market, By End User, 2017–2024 (USD Million)
Table 53 Media & Sera Market, By Region, 2017–2024 (USD Million)
Table 54 Media & Sera Market, By Condition, 2017–2024 (USD Million)
Table 55 Media & Sera Market, By End User, 2017–2024 (USD Million)
Table 56 Antibodies Market, By Region, 2017–2024 (USD Million)
Table 57 Antibodies Market, By Condition, 2017–2024 (USD Million)
Table 58 Antibodies Market, By End User, 2017–2024 (USD Million)
Table 59 Buffers Market, By Region, 2017–2024 (USD Million)
Table 60 Buffers Market, By Condition, 2017–2024 (USD Million)
Table 61 Buffers Market, By End User, 2017–2024 (USD Million)
Table 62 Solvents Market, By Region, 2017–2024 (USD Million)
Table 63 Solvents Market, By Condition, 2017–2024 (USD Million)
Table 64 Solvents Market, By End User, 2017–2024 (USD Million)
Table 65 Enzymes, Proteins, and Peptides Market, By Region, 2017–2024 (USD Million)
Table 66 Enzymes, Proteins, and Peptides Market, By Condition, 2017–2024 (USD Million)
Table 67 Enzymes, Proteins, and Peptides Market, By End User, 2017–2024 (USD Million)
Table 68 Probes Market, By Region, 2017–2024 (USD Million)
Table 69 Probes Market, By Condition, 2017–2024 (USD Million)
Table 70 Probes Market, By End User, 2017–2024 (USD Million)
Table 71 Other Reagents & Consumables Market, By Region, 2017–2024 (USD Million)
Table 72 Other Reagents & Consumables Market, By Condition, 2017–2024 (USD Million)
Table 73 Other Reagents & Consumables Market, By End User, 2017–2024 (USD Million)
Table 74 Neurodiagnostics Market, By Condition, 2017–2024 (USD Million)
Table 75 Market for Neurodegenerative Diseases, By Region, 2017–2024 (USD Million)
Table 76 Neurodiagnostics Market for Stroke, By Region, 2017–2024 (USD Million)
Table 77 Market for Epilepsy, By Region, 2017–2024 (USD Million)
Table 78 Market for Headache Disorders, By Region, 2017–2024 (USD Million)
Table 79 Neurodiagnostics Market for Sleep Disorders, By Region, 2017–2024 (USD Million)
Table 80 Neurodiagnostics Market for Other Conditions, By Region, 2017–2024 (USD Million)
Table 81 Neurodiagnostics Market, By End User, 2017–2024 (USD Million)
Table 82 Market for Hospitals & Surgical Centers, By Region, 2017–2024 (USD Million)
Table 83 Neurodiagnostics Market for Diagnostic Laboratories & Imaging Centers, By Region, 2017–2024 (USD Million)
Table 84 Market for Neurology Centers, By Region, 2017–2024 (USD Million)
Table 85 Neurodiagnostics Market for Ambulatory Care Centers, By Region, 2017–2024 (USD Million)
Table 86 Market for Research Laboratories & Academic Institutes, By Region, 2017–2024 (USD Million)
Table 87 Neurodiagnostics Market, By Region, 2017–2024 (USD Million)
Table 88 North America: Market, By Country, 2017–2024 (USD Million)
Table 89 North America: Neurodiagnostics Market, By Product, 2017–2024 (USD Million)
Table 90 North America: Diagnostic Imaging Systems Market, By Type, 2017–2024 (USD Million)
Table 91 North America: Clinical Diagnostic Instruments Market, By Type, 2017–2024 (USD Million)
Table 92 North America: Reagents & Consumables Market, By Type, 2017–2024 (USD Million)
Table 93 North America: Neurodiagnostics Market, By Condition, 2017–2024 (USD Million)
Table 94 North America: Neurodiagnostics Market, By End User, 2017–2024 (USD Million)
Table 95 US: Market, By Product, 2017–2024 (USD Million)
Table 96 US: Diagnostic Imaging Systems Market, By Type, 2017–2024 (USD Million)
Table 97 US: Clinical Diagnostic Instruments Market, By Type, 2017–2024 (USD Million)
Table 98 US: Reagents & Consumables Market, By Type, 2017–2024 (USD Million)
Table 99 Canada: Neurodiagnostics Market, By Product, 2017–2024 (USD Million)
Table 100 Canada: Diagnostic Imaging Systems Market, By Type, 2017–2024 (USD Million)
Table 101 Canada: Clinical Diagnostic Instruments Market, By Type, 2017–2024 (USD Million)
Table 102 Canada: Reagents & Consumables Market, By Type, 2017–2024 (USD Million)
Table 103 Europe: Neurodiagnostics Market, By Country, 2017–2024 (USD Million)
Table 104 Europe: Neurodiagnostics Market, By Product, 2017–2024 (USD Million)
Table 105 Europe: Diagnostic Imaging Systems Market, By Type, 2017–2024 (USD Million)
Table 106 Europe: Clinical Diagnostic Instruments Market, By Type, 2017–2024 (USD Million)
Table 107 Europe: Reagents & Consumables Market, By Type, 2017–2024 (USD Million)
Table 108 Europe: Market, By Condition, 2017–2024 (USD Million)
Table 109 Europe: Market, By End User, 2017–2024 (USD Million)
Table 110 Germany: Neurodiagnostics Market, By Product, 2017–2024 (USD Million)
Table 111 Germany: Diagnostic Imaging Systems Market, By Type, 2017–2024 (USD Million)
Table 112 Germany: Clinical Diagnostic Instruments Market, By Type, 2017–2024 (USD Million)
Table 113 Germany: Reagents & Consumables Market, By Type, 2017–2024 (USD Million)
Table 114 UK: Neurodiagnostics Market, By Product, 2017–2024 (USD Million)
Table 115 UK: Diagnostic Imaging Systems Market, By Type, 2017–2024 (USD Million)
Table 116 UK: Clinical Diagnostic Instruments Market, By Type, 2017–2024 (USD Million)
Table 117 UK: Reagents & Consumables Market, By Type, 2017–2024 (USD Million)
Table 118 France: Market, By Product, 2017–2024 (USD Million)
Table 119 France: Diagnostic Imaging Systems Market, By Type, 2017–2024 (USD Million)
Table 120 France: Clinical Diagnostic Instruments Market, By Type, 2017–2024 (USD Million)
Table 121 France: Reagents & Consumables Market, By Type, 2017–2024 (USD Million)
Table 122 Italy: Neurodiagnostics Market, By Product, 2017–2024 (USD Million)
Table 123 Italy: Diagnostic Imaging Systems Market, By Type, 2017–2024 (USD Million)
Table 124 Italy: Clinical Diagnostic Instruments Market, By Type, 2017–2024 (USD Million)
Table 125 Italy: Reagents & Consumables Market, By Type, 2017–2024 (USD Million)
Table 126 Spain: Market, By Product, 2017–2024 (USD Million)
Table 127 Spain: Diagnostic Imaging Systems Market, By Type, 2017–2024 (USD Million)
Table 128 Spain: Clinical Diagnostic Instruments Market, By Type, 2017–2024 (USD Million)
Table 129 Spain: Reagents & Consumables Market, By Type, 2017–2024 (USD Million)
Table 130 RoE: Neurodiagnostics Market, By Product, 2017–2024 (USD Million)
Table 131 RoE: Diagnostic Imaging Systems Market, By Type, 2017–2024 (USD Million)
Table 132 RoE: Clinical Diagnostic Instruments Market, By Type, 2017–2024 (USD Million)
Table 133 RoE: Reagents & Consumables Market, By Type, 2017–2024 (USD Million)
Table 134 Asia Pacific: Neurodiagnostics Market, By Country, 2017–2024 (USD Million)
Table 135 Asia Pacific: Market, By Product, 2017–2024 (USD Million)
Table 136 Asia Pacific: Diagnostic Imaging Systems Market, By Type, 2017–2024 (USD Million)
Table 137 Asia Pacific: Clinical Diagnostic Instruments Market, By Type, 2017–2024 (USD Million)
Table 138 Asia Pacific: Reagents & Consumables Market, By Type, 2017–2024 (USD Million)
Table 139 Asia Pacific: Neurodiagnostics Market, By Condition, 2017–2024 (USD Million)
Table 140 Asia Pacific: Market, By End User, 2017–2024 (USD Million)
Table 141 Japan: Neurodiagnostics Market, By Product, 2017–2024 (USD Million)
Table 142 Japan: Diagnostic Imaging Systems Market, By Type, 2017–2024 (USD Million)
Table 143 Japan: Clinical Diagnostic Instruments Market, By Type, 2017–2024 (USD Million)
Table 144 Japan: Reagents & Consumables Market, By Type, 2017–2024 (USD Million)
Table 145 China: Neurodiagnostics Market, By Product, 2017–2024 (USD Million)
Table 146 China: Diagnostic Imaging Systems Market, By Type, 2017–2024 (USD Million)
Table 147 China: Clinical Diagnostic Instruments Market, By Type, 2017–2024 (USD Million)
Table 148 China: Reagents & Consumables Market, By Type, 2017–2024 (USD Million)
Table 149 India: Market, By Product, 2017–2024 (USD Million)
Table 150 India: Diagnostic Imaging Systems Market, By Type, 2017–2024 (USD Million)
Table 151 India: Clinical Diagnostic Instruments Market, By Type, 2017–2024 (USD Million)
Table 152 India: Reagents & Consumables Market, By Type, 2017–2024 (USD Million)
Table 153 Australia: Neurodiagnostics Market, By Product, 2017–2024 (USD Million)
Table 154 Australia: Diagnostic Imaging Systems Market, By Type, 2017–2024 (USD Million)
Table 155 Australia: Clinical Diagnostic Instruments Market, By Type, 2017–2024 (USD Million)
Table 156 Australia: Reagents & Consumables Market, By Type, 2017–2024 (USD Million)
Table 157 South Korea: Market, By Product, 2017–2024 (USD Million)
Table 158 South Korea: Diagnostic Imaging Systems Market, By Type, 2017–2024 (USD Million)
Table 159 South Korea: Clinical Diagnostic Instruments Market, By Type, 2017–2024 (USD Million)
Table 160 South Korea: Reagents & Consumables Market, By Type, 2017–2024 (USD Million)
Table 161 Rest of Asia Pacific: Neurodiagnostics Market, By Product, 2017–2024 (USD Million)
Table 162 Rest of Asia Pacific: Diagnostic Imaging Systems Market, By Type, 2017–2024 (USD Million)
Table 163 Rest of Asia Pacific: Clinical Diagnostic Instruments Market, By Type, 2017–2024 (USD Million)
Table 164 Rest of Asia Pacific: Reagents & Consumables Market, By Type, 2017–2024 (USD Million)
Table 165 Latin America: Market, By Country, 2017–2024 (USD Million)
Table 166 Latin America: Neurodiagnostics Market, By Product, 2017–2024 (USD Million)
Table 167 Latin America: Diagnostic Imaging Systems Market, By Type, 2017–2024 (USD Million)
Table 168 Latin America: Clinical Diagnostic Instruments Market, By Type, 2017–2024 (USD Million)
Table 169 Latin America: Reagents & Consumables Market, By Type, 2017–2024 (USD Million)
Table 170 Latin America: Neurodiagnostics Market, By Condition, 2017–2024 (USD Million)
Table 171 Latin America: Market, By End User, 2017–2024 (USD Million)
Table 172 Brazil: Neurodiagnostics Market, By Product, 2017–2024 (USD Million)
Table 173 Brazil: Diagnostic Imaging Systems Market, By Type, 2017–2024 (USD Million)
Table 174 Brazil: Clinical Diagnostic Instruments Market, By Type, 2017–2024 (USD Million)
Table 175 Brazil: Reagents & Consumables Market, By Type, 2017–2024 (USD Million)
Table 176 Mexico: Neurodiagnostics Market, By Product, 2017–2024 (USD Million)
Table 177 Mexico: Diagnostic Imaging Systems Market, By Type, 2017–2024 (USD Million)
Table 178 Mexico: Clinical Diagnostic Instruments Market, By Type, 2017–2024 (USD Million)
Table 179 Mexico: Reagents & Consumables Market, By Type, 2017–2024 (USD Million)
Table 180 Rest of Latin America: Neurodiagnostics Market, By Product, 2017–2024 (USD Million)
Table 181 Latin America: Diagnostic Imaging Systems Market, By Type, 2017–2024 (USD Million)
Table 182 Latin America: Clinical Diagnostic Instruments Market, By Type, 2017–2024 (USD Million)
Table 183 Latin America: Reagents & Consumables Market, By Type, 2017–2024 (USD Million)
Table 184 Middle East and Africa: Neurodiagnostics Market, By Product, 2017–2024 (USD Million)
Table 185 Middle East and Africa: Diagnostic Imaging Systems Market, By Type, 2017–2024 (USD Million)
Table 186 Middle East and Africa: Clinical Diagnostic Instruments Market, By Type, 2017–2024 (USD Million)
Table 187 Middle East and Africa: Reagents & Consumables Market, By Type, 2017–2024 (USD Million)
Table 188 Middle East and Africa: Neurodiagnostics Market, By Condition, 2017–2024 (USD Million)
Table 189 Middle East and Africa: Market, By End User, 2017–2024 (USD Million)
List of Figures (28 Figures)
Figure 1 Research Design
Figure 2 Breakdown of Primaries: Neurodiagnostics Market
Figure 3 Research Methodology: Hypothesis Building
Figure 4 Market Size Estimation: Market
Figure 5 Data Triangulation Methodology
Figure 6 Increasing Prevalence of Neurological Disorders to Drive the Demand for Neurodiagnostic Devices
Figure 7 Diagnostic Imaging Systems to Register the Highest CAGR During the Forecast Period
Figure 8 North America to Dominate the Neurodiagnostics Market
Figure 9 Neurodegenerative Diseases to Dominate the Market During the Forecast Period
Figure 10 China is Estimated to be the Fastest-Growing Country in the Neurodiagnostics Market
Figure 11 Neurodiagnostics Market: Drivers, Restraints, Opportunities, and Challenge
Figure 12 North America: Market Snapshot
Figure 13 Asia Pacific: Market Snapshot
Figure 14 Key Developments in the Market From 2016 to 2019
Figure 15 GE Healthcare Held the Leading Position in the Market in 2018
Figure 16 Neurodiagnostics Market (Global) Competitive Leadership Mapping, 2018
Figure 17 GE Healthcare: Company Snapshot
Figure 18 Hitachi, Ltd.: Company Snapshot
Figure 19 Canon, Inc.: Company Snapshot
Figure 20 Philips Healthcare: Company Snapshot
Figure 21 Siemens Healthineers: Company Snapshot
Figure 22 Natus Medical Incorporated: Company Snapshot
Figure 23 F. Hoffmann-La Roche AG: Company Snapshot
Figure 24 FUJIFILM Holdings Corporation: Company Snapshot
Figure 25 Thermo Fisher Scientific, Inc: Company Snapshot
Figure 26 Bio-Rad Laboratories: Company Snapshot
Figure 27 QIAGEN N.V: Company Snapshot
Figure 28 Nihon Kohden: Company Snapshot
The study involved four major activities in estimating the current size of the neurodiagnostics market. Exhaustive secondary research was conducted to collect information on the market and its different subsegments. The next step was to validate these findings, assumptions, and sizing with industry experts across the value chain through primary research. Both top-down and bottom-up approaches were employed to estimate the total market size. After that, market breakdown and data triangulation were used to estimate the market size of segments and subsegments.
Secondary Research
In the secondary research process, various secondary sources such as annual reports, press releases & investor presentations of companies, white papers, certified publications, articles by recognized authors, gold-standard & silver-standard websites, regulatory bodies, and databases (such as D&B Hoovers, Bloomberg Businessweek, and Factiva) were referred to in order to identify and collect information for this study.
Primary Research
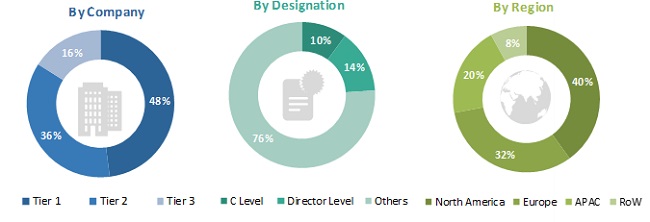
The neurodiagnostics market comprises several stakeholders such as original equipment manufacturers (OEMs), product distributors and channel partners, hospitals and surgical centers, emergency care units and trauma centers, ambulatory care centers, diagnostic laboratories and imaging centers, contract manufacturers and third-party suppliers, research laboratories and academic institutes, clinical research organizations (CROs), government and non-governmental regulatory authorities, and market research and consulting firms. Various primary sources from both the supply and demand sides of the market were interviewed to obtain qualitative and quantitative information. The following is a breakdown of primary respondents:
To know about the assumptions considered for the study, download the pdf brochure
Market Size Estimation
A detailed market estimation approach was followed to estimate and validate the value of the global neurodiagnostics market and other dependent submarkets, as mentioned below.
- Key players in the global market were identified through secondary research, and their global market shares were determined through primary and secondary research.
- The research methodology included the study of the annual and quarterly financial reports & regulatory filings of significant market players as well as interviews with industry experts for detailed market insights.
- All percentage shares split, and breakdowns for the global neurodiagnostics market were determined by using secondary sources and verified through primary sources.
- All key macro indicators affecting the revenue growth of market segments and subsegments have been accounted for, viewed in extensive detail, verified through primary research, and analyzed to get the validated and verified quantitative & qualitative data
- The gathered market data was consolidated and added to detailed inputs, analyzed, and presented in this report.
Data Triangulation
After arriving at the overall market size of the global market through the above-mentioned methodology, this market was split into several segments and subsegments. The data triangulation and market breakdown procedure were employed, wherever applicable, to complete the overall market engineering process and arrive at the exact market value data for the key segments and subsegments. The extrapolated market data was triangulated by studying various macro indicators and regional trends from both the demand- and supply-side participants.
Report Objectives
- To define, describe, and forecast the neurodiagnostics market based on product, condition, end-user, and region
- To provide detailed information on the major factors influencing market growth (such as drivers, restraints, opportunities, and industry-specific challenges)
- To strategically analyze micromarkets1 with respect to individual growth trends, prospects, and their contributions to the overall market
- To analyze market opportunities for stakeholders and provide details of the competitive landscape for key players
- To forecast the market value of various segments and sub-segments for five regions—North America, Europe, the Asia Pacific, Latin America, and the Middle East & Africa
- To profile the key players in the neurodiagnostics market and comprehensively analyze their global revenue shares and core competencies
- To track and analyze competitive market-specific developments such as product launches/approvals and enhancements; partnerships, collaborations, agreements; expansions; and acquisitions
Available Customizations
With the given market data, MarketsandMarkets offers customizations as per the company’s specific needs. The following customization options are available for the report:
- Product Analysis: Product matrix, which gives a detailed comparison of the product portfolios of the five major companies
- Company Information: Detailed analysis and profiling of additional market players (Up to 5)

 Generating Response ...


Growth opportunities and latent adjacency in Neurodiagnostics Market