Brain Monitoring Market by Product (Accessories, MRI, CT, PET, EEG, EMG, MEG, ICP, Electrode, Paste, Gel, Battery, Cable, Invasive), Disease (TBI, Stroke, Dementia, Epilepsy, Headache, Sleep), End User (Hospital, Clinic, ASC) & Region - Global Forecast to 2026
Updated on : April 13, 2023
The global brain monitoring market in terms of revenue was estimated to be worth $5.8 billion in 2021 and is poised to reach $8.0 billion by 2026, growing at a CAGR of 6.5% from 2021 to 2026. The new research study consists of an industry trend analysis of the market. The new research study consists of industry trends, pricing analysis, patent analysis, conference and webinar materials, key stakeholders, and buying behaviour in the market. The global market is mainly driven by factors such as the increasing incidence and prevalence of neurological disorders, rising awareness of neurodegenerative diseases, growth in the number of traumatic brain injuries, and increasing applications of brain monitoring in clinical trials. The rising demand for non-invasive and minimally invasive devices, the expanding therapeutic applications of brain monitoring devices, and the growing healthcare market in emerging economies are also expected to provide opportunities for growth for players in the market.
To know about the assumptions considered for the study, Request for Free Sample Report
Brain Monitoring Market Dynamics
Driver: Increasing incidence and prevalence of neurological disorders
The global incidence and prevalence of neurological disorders, such as dementia, epilepsy, Parkinson’s disease, Huntington’s disease, headache disorders, multiple sclerosis, neuro infections, stroke, and cerebral palsy, have increased significantly over the years. Brain disorders, which include a combination of developmental, psychiatric, and neurodegenerative diseases, are a growing cause of morbidity across the globe. This can primarily be attributed to the growing geriatric population (by 2050, more than 20% of the global population is expected to be aged over 65 years). The American Medical Association (AMA) estimates that at least 60% of individuals aged 65 years and above will be living with more than one chronic condition by 2030. Mentioned below are some important statistics related to the incidence and prevalence of neurological disorders:
- According to WHO data, as of September 2019, around 50 million people are affected by dementia globally, with nearly 10 million new cases registered each year. It is one of the major causes of disability and dependency among older people worldwide.
- According to WHO data, in June 2019, globally, the number of people affected with epilepsy was approximately 50 million; of this, nearly 80% live in low- and middle-income countries.
- The average incidence of epilepsy each year in the US is estimated at 150,000 or 48 for every 100,000 people (Source: Epilepsy Foundation). In the US, around 3.4 million people are affected by epilepsy.
The rising incidence of these neurological disorders has made it extremely important to monitor brain and neurological functions. Many neurological disorders and conditions are progressive, and their risk increases with age. Additionally, the prevalence of other diseases and conditions, such as sickle-cell diseases and cardiac disorders, is also increasing. Cardiac procedures may sometimes affect the normal functioning of the brain, which is another major factor driving the demand for brain monitoring devices.
Restraint: Research High cost of complex brain monitoring procedures and devices
The high cost of brain monitoring surgeries and devices is a major factor restraining the global brain monitoring market, especially in developing countries with poor reimbursement policies. Brain monitoring devices are highly complex, and the procedures involving the use of these devices are generally expensive. For instance, the average cost of a standard EEG is ~USD 200–700; this procedure can cost as high as USD 3,000 for extended monitoring. A dual-channel TCD costs approximately USD 3,000–3,200, and an ICP monitor costs approximately USD 340–500. Likewise, a single MEG system costs roughly USD 2.5–3 million. Due to the high price, healthcare facilities, even in countries that show wide adoption of high-tech medical equipment, find it difficult to procure MEG devices. Additionally, the maintenance cost and other associated indirect expenses increase the total cost of ownership of these devices, thereby limiting their adoption.
Small hospitals and standalone ASCs are also less inclined toward investing in costly and sophisticated technologies due to budgetary constraints; this is more prominent in developing countries. Owing to the high cost of these procedures, coupled with the poor reimbursement scenario, a very limited pool of patients in developing countries can afford neurological treatments. As a result, healthcare facilities are reluctant to invest in new or technologically advanced systems, thus limiting the brain monitoring market.
Opportunity: The increasing demand for non-invasive and minimally invasive devices
Invasive monitoring is a complex, painful, and risky process, as it involves direct intervention with sensitive brain tissue. Doctors and patients, therefore, show a high inclination toward the use of non-invasive or minimally invasive brain monitoring devices. Owing to their advantages, there has been a rapid increase in the demand for non-invasive ICP monitors, TCD devices, tympanic membrane displacement procedures, optic nerve sheath diameter, CT scan/MRI, and fundoscopy, which are reliable alternatives to invasive techniques, thus compelling players in this market to develop and commercialize such products.
In March 2019, Masimo (US) received CE Mark approval for its next-generation SedLine brain function monitor for pediatric patients aged between one and 18 years of age; this product assesses the brain function while the patient is under anesthesia.
- In March 2018, Nihon Kohden (Japan) launched aireeg WEE-1200, a wireless EEG system that provides real-time data during long-term epilepsy monitoring, intensive care, and routine EEG.
Several government initiatives are focused on the development of novel and innovative devices, such as the BRAIN initiative launched in the US in April 2013, for encouraging R&D related to the functioning of the brain. Advanced Research Projects Activity (IARPA) joined the BRAIN initiative for the development of non-invasive neural intervention devices for optimizing reasoning and problem-solving.
By product, the devices segment accounted for the largest share 74.9% of the Brain Monitoring market.
By product, the global market is categorized into devices and accessories. The devices segment held the largest share 74.9% of the global market. This is mainly due to the rising incidence of neurological, neurodegenerative, psychotic, and sleep disorders, the need for early diagnosis, the availability of innovative portable and wearable home-based monitoring devices, and increasing patient awareness.
By medical condition, the traumatic brain injury segment accounted for the largest share 26.8% of the brain monitoring market.
Based on disease, the global market is segmented into traumatic brain injury (TBI), stroke, dementia, headache disorders, sleep disorders, Parkinson’s disease, epilepsy, Huntington’s disease, and other diseases. The global market has been segmented into regenerative medicine and stem cell research, cancer & cell-based research, and others. Traumatic brain injury (TBI) holds the largest share of the global market by a medical condition. A major factor responsible for the large share of this market segment is the growing incidence of TBIs across the globe, leading to high demand for the management of these cases, thus requiring the intensive use of brain monitoring devices.
By end user -type, the hospital segment accounted for the largest share 57.8% of the brain monitoring market.
Based on end-users, the global market is segmented into hospitals, neurology centers, diagnostic centers, ASCs & clinics, and other end users. The hospital segment held the largest share 57.8 % of the global market. Brain monitoring is a complex process, requiring expensive and advanced devices and equipment that are mainly found in hospitals. Hospitals also see a considerably larger inflow of patients as compared to small clinics and other end users. Additionally, brain monitoring devices pose a considerable burden in terms of maintenance expenses on healthcare facilities; hospitals, more than other end-users, can bear such costs. Hence, brain monitoring devices are mostly used in hospitals, which consequently account for the largest share of this market segment.
North America accounted for the largest share 38% of the global brain monitoring market.
The global market, by region, is segmented into North America, Europe, APAC, and the RoW. North America accounted for the largest share of the global market. This can be attributed to the growing incidence of neurological diseases, a growing number of clinical trials of brain monitoring products, and the availability of medical reimbursement in the US.
To know about the assumptions considered for the study, download the pdf brochure
The global Brain Monitoring market is dominated by a few globally established players such as Natus Medical, Inc. (US) Nihon Kohden Corporation (Japan), Philips Healthcare (Netherlands), GE Healthcare (US), Siemens Healthineers (Germany), Compumedics, Ltd. (Australia), Medtronic (Ireland), Edwards Lifesciences Corporation (US), Drägerwerk AG & Co. KGaA (Germany), Advanced Brain Monitoring (US), Masimo Corporation (US), Spiegelberg GmbH & Co. KG (Germany), Cadwell Industries (US), and others.
Brain Monitoring Market Report Scope
Report Metric |
Details |
Market Revenue in 2021 |
$5.8 billion |
Projected Revenue by 2026 |
$8.0 billion |
Revenue Rate |
Poised to grow at a CAGR of 6.5% |
Market Driver |
Increasing incidence and prevalence of neurological disorders |
Market Opportunity |
Increasing demand for non-invasive and minimally invasive devices |
The study categorizes the Brain Monitoring market to forecast revenue and analyze trends in each of the following submarkets:
By Product
-
Devices
-
By Type
- Magnetic Resonance Imaging (MRI) Scanners
- Computerized Tomography (CT) Scanners
- Electroencephalograph (EEG) Devices
- Positron Emission Tomography (PET) Scanners
- Sleep Monitoring Devices
- Cerebral Oximeters
- Electromyography (EMG) Devices
- Intracranial Pressure (ICP) Monitors
- Magnetoencephalography (MEG) Devices
- Transcranial Doppler (TCD) Devices
-
By Procedure
- Devices for Invasive Procedures
- Devices for Non-invasive Procedures
-
By Type
-
Accessories
-
By Type
- Electrodes
-
-
- Wet Electrodes
- Dry Electrodes
- Needle Electrodes
- Sensors
- Pastes & Gels
- Caps
- Cables
- Batteries
- Other Accessories
-
-
By Type
-
By Usability
- Disposable
- Reusable
By Medical Condition
- Traumatic Brain Injury (TBI)
- Stroke
- Dementia
- Headache Disorders
- Sleep Disorders
- Parkinson’s Disease
- Epilepsy
- Huntington's Disease
- Other Medical Conditions
By End User
- Hospitals
- Neurology Centers
- Ambulatory Surgery Centers (ASCs) & Clinics
- Diagnostic Centers
- Other End Users
By Region
-
North America
- US
- Canada
-
Europe
- Germany
- UK
- France
- Rest of Europe
-
Asia Pacific
- China
- Japan
- India
- Rest of Asia Pacific
-
Rest of the World
- Latin America
- The Middle East and Africa
Recent Developments
- In 2021, Innovative Medcare Technology PTY Ltd. signed a contract with Spiegelberg for distributing Spiegelberg’s product portfolio in Australia & New Zealand.
- In 202, Received FDA approval for the Neuroscan Orion LifeSpan MEG
- In 2018, GE Healthcare launched its SIGNA Premier 3.0T magnetic resonance imaging (MRI) system in Canada.
- In March 2018, Nihon Kohden (Japan) launched aireeg WEE-1200, a wireless EEG system that provides real-time data during long-term epilepsy monitoring, intensive care, and routine EEG
- In 2018, Philips collaborated with Samsung Electronics to connect Samsung’s ARTIK Smart IoT Platform to Philips’ HealthSuite Digital Platform. This addressed the growing need for connected health platforms that can safely access, share, and analyze information, helping health systems and providers achieve their goal of delivering better care to consumers.
- In 2017, Natus acquired the global Camino ICP monitoring product line, including its San Diego manufacturing facility, from Integra. The sale also included the US rights to Integra's fixed-pressure shunts, as well as US rights to Codman's DURAFORM dural graft implants, standard EVD catheters, and CSF collection systems.
Frequently Asked Questions (FAQ):
What is the projected market revenue value of the brain monitoring market?
The brain monitoring market boasts a total revenue value of $8.0 billion by 2026.
What is the estimated growth rate (CAGR) of the brain monitoring market?
The global market for brain monitoring has an estimated compound annual growth rate (CAGR) of 6.5% and a revenue size in the region of $5.8 billion in 2021.
To speak to our analyst for a discussion on the above findings, click Speak to Analyst
TABLE OF CONTENTS
1 INTRODUCTION (Page No. - 40)
1.1 OBJECTIVES OF THE STUDY
1.2 MARKET DEFINITION
1.3 MARKET SCOPE
1.3.1 MARKETS COVERED
FIGURE 1 BRAIN MONITORING MARKET SEGMENTATION
1.3.2 YEARS CONSIDERED FOR THE STUDY
1.4 CURRENCY
1.5 LIMITATIONS
1.6 STAKEHOLDERS
1.7 SUMMARY OF CHANGES
2 RESEARCH METHODOLOGY (Page No. - 44)
2.1 RESEARCH DATA
FIGURE 2 RESEARCH DESIGN
2.1.1 SECONDARY SOURCES
2.1.1.1 Key data from secondary sources
2.1.2 PRIMARY DATA
FIGURE 3 PRIMARY SOURCES
2.1.2.1 Key data from primary sources
2.1.2.2 Insights from primary experts
FIGURE 4 BREAKDOWN OF PRIMARY INTERVIEWS: SUPPLY-SIDE AND DEMAND-SIDE PARTICIPANTS
FIGURE 5 BREAKDOWN OF PRIMARY INTERVIEWS
2.2 MARKET SIZE ESTIMATION
FIGURE 6 SUPPLY-SIDE MARKET SIZE ESTIMATION: REVENUE SHARE ANALYSIS
FIGURE 7 COMPANY REVENUE SHARE ANALYSIS ILLUSTRATION: BRAIN MONITORING MARKET
FIGURE 8 COMPANY REVENUE SHARE ANALYSIS ILLUSTRATION: EEG MARKET
FIGURE 9 TOP-DOWN APPROACH
FIGURE 10 CAGR PROJECTIONS FROM THE ANALYSIS OF DRIVERS, RESTRAINTS, OPPORTUNITIES, AND CHALLENGES IN THE GLOBAL MARKET (2021–2026)
FIGURE 11 CAGR PROJECTIONS: SUPPLY-SIDE ANALYSIS
2.3 MARKET BREAKDOWN AND DATA TRIANGULATION
FIGURE 12 DATA TRIANGULATION METHODOLOGY
2.4 MARKET SHARE ESTIMATION
2.5 ASSUMPTIONS FOR THE STUDY
2.6 RISK ASSESSMENT
TABLE 1 RISK ASSESSMENT: GLOBAL MARKET
3 EXECUTIVE SUMMARY (Page No. - 58)
FIGURE 13 BRAIN MONITORING MARKET, BY PRODUCT, 2021 VS. 2026 (USD MILLION)
FIGURE 14 BRAIN MONITORING DEVICES MARKET, BY TYPE, 2021 VS. 2026 (USD MILLION)
FIGURE 15 GLOBAL MARKET, BY MEDICAL CONDITION, 2021 VS. 2026 (USD MILLION)
FIGURE 16 GLOBAL MARKET, BY END USER, 2021–2026 (USD MILLION)
FIGURE 17 GLOBAL MARKET: GEOGRAPHIC SNAPSHOT
4 PREMIUM INSIGHTS (Page No. - 62)
4.1 BRAIN MONITORING MARKET OVERVIEW
FIGURE 18 INCREASING INCIDENCE AND PREVALENCE OF NEUROLOGICAL DISORDERS—A MAJOR FACTOR DRIVING MARKET GROWTH
4.2 GLOBAL MARKET, BY PRODUCT
FIGURE 19 DEVICES SEGMENT TO DOMINATE THE MARKET DURING THE FORECAST PERIOD (2021–2026)
4.3 GLOBAL MARKET, BY END USER
FIGURE 20 HOSPITALS HELD THE LARGEST SHARE OF THE END-USER MARKET IN 2020
4.4 GEOGRAPHIC SNAPSHOT OF THE GLOBAL MARKET
FIGURE 21 MARKETS IN THE APAC AND ROW WILL REGISTER HIGH GROWTH RATES DURING THE FORECAST PERIOD
5 MARKET OVERVIEW (Page No. - 65)
5.1 INTRODUCTION
5.2 MARKET DYNAMICS
FIGURE 22 BRAIN MONITORING MARKET: DRIVERS, RESTRAINTS, OPPORTUNITIES, AND CHALLENGES
5.2.1 DRIVERS
5.2.1.1 Increasing incidence and prevalence of neurological disorders
5.2.1.2 Rising awareness of neurodegenerative disorders
5.2.1.3 Growing incidence of traumatic brain injuries
5.2.1.4 Increasing applications in clinical trials
5.2.2 RESTRAINTS
5.2.2.1 High cost of complex brain monitoring procedures and devices
5.2.2.2 Unfavorable reimbursement policies
5.2.3 OPPORTUNITIES
5.2.3.1 Increasing demand for non-invasive and minimally invasive devices
5.2.3.2 Expanding therapeutic applications of brain monitoring devices
5.2.3.3 Growing healthcare market in emerging economies
FIGURE 23 GLOBAL ANNUAL HEALTHCARE EXPENDITURE: DEVELOPED VS. DEVELOPING ECONOMIES (1995 VS. 2012 VS. 2022)
5.2.4 CHALLENGES
5.2.4.1 Shortage of trained professionals
5.2.4.2 Issues related to product approval and commercialization
5.3 IMPACT OF COVID-19 ON THE GLOBAL MARKET
5.4 PRICING ANALYSIS
TABLE 2 REGIONAL PRICING ANALYSIS OF KEY BRAIN MONITORING MODALITIES
5.5 VALUE CHAIN ANALYSIS
5.5.1 RESEARCH & DEVELOPMENT
5.5.2 MANUFACTURING & ASSEMBLY
5.5.3 DISTRIBUTION, MARKETING & SALES, AND POST-SALES SERVICES
FIGURE 24 VALUE CHAIN ANALYSIS
5.6 ECOSYSTEM ANALYSIS
5.7 PORTER’S FIVE FORCES ANALYSIS
TABLE 3 GLOBAL MARKET: PORTER’S FIVE FORCES ANALYSIS
5.8 REGULATORY LANDSCAPE
5.8.1 NORTH AMERICA
5.8.1.1 US
TABLE 4 US FDA: MEDICAL DEVICE CLASSIFICATION
TABLE 5 US: MEDICAL DEVICE REGULATORY APPROVAL PROCESS
5.8.1.2 Canada
5.8.2 EUROPE
5.8.3 ASIA PACIFIC
5.8.3.1 Japan
TABLE 6 JAPAN: MEDICAL DEVICE CLASSIFICATION UNDER PMDA
5.8.3.2 China
5.8.3.3 India
5.9 PATENT ANALYSIS
FIGURE 25 MAJOR PATENT HOLDERS FOR MRI DEVICES (JANUARY 2011–MAY 2021)
FIGURE 26 MAJOR PATENT HOLDERS FOR CT SCANNERS (JANUARY 2011–MAY 2021)
FIGURE 27 MAJOR PATENT HOLDERS FOR PET SCANNERS (JANUARY 2011–MAY 2021)
6 BRAIN MONITORING MARKET, BY PRODUCT (Page No. - 81)
6.1 INTRODUCTION
TABLE 7 BRAIN MONITORING MARKET, BY PRODUCT, 2019–2026 (USD MILLION)
6.2 DEVICES
TABLE 8 BRAIN MONITORING DEVICES MARKET, BY REGION, 2019–2026 (USD MILLION)
TABLE 9 NORTH AMERICA: BRAIN MONITORING DEVICES MARKET, BY COUNTRY, 2019–2026 (USD MILLION)
TABLE 10 EUROPE: BRAIN MONITORING DEVICES MARKET, BY COUNTRY, 2019–2026 (USD MILLION)
TABLE 11 APAC: BRAIN MONITORING DEVICES MARKET, BY COUNTRY, 2019–2026 (USD MILLION)
6.2.1 BRAIN MONITORING DEVICES MARKET, BY TYPE
TABLE 12 BRAIN MONITORING DEVICES MARKET, BY TYPE, 2019–2026 (USD MILLION)
TABLE 13 BRAIN MONITORING DEVICES MARKET, BY TYPE, 2019–2026 (UNITS)
6.2.1.1 MRI scanners
6.2.1.1.1 Research efforts focusing on technological advancements like AI for image analysis will drive market growth
TABLE 14 MRI SCANNERS MARKET, BY REGION, 2019–2026 (USD MILLION)
TABLE 15 NORTH AMERICA: MRI SCANNERS MARKET, BY COUNTRY, 2019–2026 (USD MILLION)
TABLE 16 EUROPE: MRI SCANNERS MARKET, BY COUNTRY, 2019–2026 (USD MILLION)
TABLE 17 APAC: MRI SCANNERS MARKET, BY COUNTRY, 2019–2026 (USD MILLION)
6.2.1.2 CT scanners
6.2.1.2.1 High preference for CT among physicians for brain disease progression monitoring to drive market growth
TABLE 18 CT SCANNERS MARKET, BY REGION, 2019–2026 (USD MILLION)
TABLE 19 NORTH AMERICA: CT SCANNERS MARKET, BY COUNTRY, 2019–2026 (USD MILLION)
TABLE 20 EUROPE: CT SCANNERS MARKET, BY COUNTRY, 2019–2026 (USD MILLION)
TABLE 21 APAC: CT SCANNERS MARKET, BY COUNTRY, 2019–2026 (USD MILLION)
6.2.1.3 EEG devices
6.2.1.3.1 Growing applications of EEG and the rising number of specialized facilities are the key growth drivers for this market
TABLE 22 EEG DEVICES MARKET, BY REGION, 2019–2026 (USD MILLION)
TABLE 23 EEG DEVICES MARKET, BY REGION, 2019–2026 (UNITS)
TABLE 24 NORTH AMERICA: EEG DEVICES MARKET, BY COUNTRY, 2019–2026 (USD MILLION)
TABLE 25 EUROPE: EEG DEVICES MARKET, BY COUNTRY, 2019–2026 (USD MILLION)
TABLE 26 APAC: EEG DEVICES MARKET, BY COUNTRY, 2019–2026 (USD MILLION)
TABLE 27 EEG DEVICES MARKET, BY APPLICATION, 2019–2026 (USD MILLION)
6.2.1.4 PET scanners
6.2.1.4.1 Introduction of novel radiopharmaceutical tracers has driven the use of PET in brain disease monitoring
TABLE 28 PET SCANNERS MARKET, BY REGION, 2019–2026 (USD MILLION)
TABLE 29 NORTH AMERICA: PET SCANNERS MARKET, BY COUNTRY, 2019–2026 (USD MILLION)
TABLE 30 EUROPE: PET SCANNERS MARKET, BY COUNTRY, 2019–2026 (USD MILLION)
TABLE 31 APAC: PET SCANNERS MARKET, BY COUNTRY, 2019–2026 (USD MILLION)
6.2.1.5 Sleep monitoring devices
6.2.1.5.1 Rising incidence of sleep disorders is boosting the demand for sleep monitoring devices
TABLE 32 SLEEP MONITORING DEVICES MARKET, BY REGION, 2019–2026 (USD MILLION)
TABLE 33 SLEEP MONITORING DEVICES MARKET, BY REGION, 2019–2026 (UNITS)
TABLE 34 NORTH AMERICA: SLEEP MONITORING DEVICES MARKET, BY COUNTRY, 2019–2026 (USD MILLION)
TABLE 35 EUROPE: SLEEP MONITORING DEVICES MARKET, BY COUNTRY, 2019–2026 (USD MILLION)
TABLE 36 APAC: SLEEP MONITORING DEVICES MARKET, BY COUNTRY, 2019–2026 (USD MILLION)
6.2.1.6 Cerebral oximeters
6.2.1.6.1 Growing cases of hypoxia during surgical procedures are likely to drive market growth
TABLE 37 CEREBRAL OXIMETERS MARKET, BY REGION, 2019–2026 (USD MILLION)
TABLE 38 CEREBRAL OXIMETERS MARKET, BY REGION, 2019–2026 (UNITS)
TABLE 39 NORTH AMERICA: CEREBRAL OXIMETERS MARKET, BY COUNTRY, 2019–2026 (USD MILLION)
TABLE 40 EUROPE: CEREBRAL OXIMETERS MARKET, BY COUNTRY, 2019–2026 (USD MILLION)
TABLE 41 APAC: CEREBRAL OXIMETERS MARKET, BY COUNTRY, 2019–2026 (USD MILLION)
6.2.1.7 EMG devices
6.2.1.7.1 High demand for EMG devices is mainly due to the increasing prevalence of neuromuscular diseases
TABLE 42 EMG DEVICES MARKET, BY REGION, 2019–2026 (USD MILLION)
TABLE 43 EMG DEVICES MARKET, BY REGION, 2019–2026 (UNITS)
TABLE 44 NORTH AMERICA: EMG DEVICES MARKET, BY COUNTRY, 2019–2026 (USD MILLION)
TABLE 45 EUROPE: EMG DEVICES MARKET, BY COUNTRY, 2019–2026 (USD MILLION)
TABLE 46 APAC: EMG DEVICES MARKET, BY COUNTRY, 2019–2026 (USD MILLION)
6.2.1.8 ICP monitors
6.2.1.8.1 Fatal consequences of high ICP make monitoring important
TABLE 47 ICP MONITORS MARKET, BY REGION, 2019–2026 (USD MILLION)
TABLE 48 ICP MONITORS MARKET, BY REGION, 2019–2026 (UNITS)
TABLE 49 NORTH AMERICA: ICP MONITORS MARKET, BY COUNTRY, 2019–2026 (USD MILLION)
TABLE 50 EUROPE: ICP MONITORS MARKET, BY COUNTRY, 2019–2026 (USD MILLION)
TABLE 51 APAC: ICP MONITORS MARKET, BY COUNTRY, 2019–2026 (USD MILLION)
6.2.1.9 MEG devices
6.2.1.9.1 High implementation and maintenance costs of MEG devices are likely to hinder market growth
TABLE 52 MEG DEVICES MARKET, BY REGION, 2019–2026 (USD MILLION)
TABLE 53 MEG DEVICES MARKET, BY REGION, 2019–2026 (UNITS)
TABLE 54 NORTH AMERICA: MEG DEVICES MARKET, BY COUNTRY, 2019–2026 (USD MILLION)
TABLE 55 EUROPE: MEG DEVICES MARKET, BY COUNTRY, 2019–2026 (USD MILLION)
TABLE 56 APAC: MEG DEVICES MARKET, BY COUNTRY, 2019–2026 (USD MILLION)
6.2.1.10 TCD devices
6.2.1.10.1 Rising prevalence of strokes and cerebrovascular disorders will contribute to market growth
TABLE 57 TCD DEVICES MARKET, BY REGION, 2019–2026 (USD MILLION)
TABLE 58 TCD DEVICES MARKET, BY REGION, 2019–2026 (UNITS)
TABLE 59 NORTH AMERICA: TCD DEVICES MARKET, BY COUNTRY, 2019–2026 (USD MILLION)
TABLE 60 EUROPE: TCD DEVICES MARKET, BY COUNTRY, 2019–2026 (USD MILLION)
TABLE 61 APAC: TCD DEVICES MARKET, BY COUNTRY, 2019–2026 (USD MILLION)
6.2.2 BRAIN MONITORING DEVICES MARKET, BY PROCEDURE
TABLE 62 BRAIN MONITORING DEVICES MARKET, BY PROCEDURE, 2019–2026 (USD MILLION)
6.2.2.1 Devices for non-invasive procedures
6.2.2.1.1 Drawbacks of invasive monitoring are driving the demand for devices for non-invasive procedures
TABLE 63 BRAIN MONITORING DEVICES MARKET FOR NON-INVASIVE PROCEDURES, BY REGION, 2019–2026 (USD MILLION)
TABLE 64 NORTH AMERICA: BRAIN MONITORING DEVICES MARKET FOR NON-INVASIVE PROCEDURES, BY COUNTRY, 2019–2026 (USD MILLION)
TABLE 65 EUROPE: BRAIN MONITORING DEVICES MARKET FOR NON-INVASIVE PROCEDURES, BY COUNTRY, 2019–2026 (USD MILLION)
TABLE 66 APAC: BRAIN MONITORING DEVICES MARKET FOR NON-INVASIVE PROCEDURES, BY COUNTRY, 2019–2026 (USD MILLION)
6.2.2.2 Devices for invasive procedures
6.2.2.2.1 Higher accuracy of devices used for invasive procedures has ensured their adoption
TABLE 67 BRAIN MONITORING DEVICES MARKET FOR INVASIVE PROCEDURES, BY REGION, 2019–2026 (USD MILLION)
TABLE 68 NORTH AMERICA: BRAIN MONITORING DEVICES MARKET FOR INVASIVE PROCEDURES, BY COUNTRY, 2019–2026 (USD MILLION)
TABLE 69 EUROPE: BRAIN MONITORING DEVICES MARKET FOR INVASIVE PROCEDURES, BY COUNTRY, 2019–2026 (USD MILLION)
TABLE 70 APAC: BRAIN MONITORING DEVICES MARKET FOR INVASIVE PROCEDURES, BY COUNTRY, 2019–2026 (USD MILLION)
6.3 ACCESSORIES
TABLE 71 BRAIN MONITORING ACCESSORIES MARKET, BY REGION, 2019–2026 (USD MILLION)
TABLE 72 NORTH AMERICA: BRAIN MONITORING ACCESSORIES MARKET, BY COUNTRY, 2019–2026 (USD MILLION)
TABLE 73 EUROPE: BRAIN MONITORING ACCESSORIES MARKET, BY COUNTRY, 2019–2026 (USD MILLION)
TABLE 74 APAC: BRAIN MONITORING ACCESSORIES MARKET, BY COUNTRY, 2019–2026 (USD MILLION)
6.3.1 BRAIN MONITORING ACCESSORIES MARKET, BY TYPE
TABLE 75 BRAIN MONITORING ACCESSORIES MARKET, BY TYPE, 2019–2026 (USD MILLION)
TABLE 76 BRAIN MONITORING ACCESSORIES MARKET, BY TYPE, 2019–2026 (THOUSAND UNITS)
6.3.1.1 Electrodes
TABLE 77 ELECTRODES MARKET, BY REGION, 2019–2026 (USD MILLION)
TABLE 78 ELECTRODES MARKET, BY REGION, 2019–2026 (THOUSAND UNITS)
TABLE 79 NORTH AMERICA: ELECTRODES MARKET, BY COUNTRY, 2019–2026 (USD MILLION)
TABLE 80 EUROPE: ELECTRODES MARKET, BY COUNTRY, 2019–2026 (USD MILLION)
TABLE 81 APAC: ELECTRODES MARKET, BY COUNTRY, 2019–2026 (USD MILLION)
6.3.1.1.1 Electrodes market, by type
TABLE 82 ELECTRODES MARKET, BY TYPE, 2019–2026 (USD MILLION)
6.3.1.1.1.1 Wet electrodes
6.3.1.1.1.1.1 Flexibility and high quality of signal recording are driving the adoption of wet electrodes
TABLE 83 WET ELECTRODES MARKET, BY REGION, 2019–2026 (USD MILLION)
6.3.1.1.1.2 Dry electrodes
6.3.1.1.1.2.1 Technological advancements and non-requirement for skin preparation have made dry electrodes popular
TABLE 84 DRY ELECTRODES MARKET, BY REGION, 2019–2026 (USD MILLION)
6.3.1.1.1.3 Needle electrodes
6.3.1.1.1.3.1 Needle electrodes can provide more accurate signals for disease assessment
TABLE 85 NEEDLE ELECTRODES MARKET, BY REGION, 2019–2026 (USD MILLION)
6.3.1.2 Sensors
6.3.1.2.1 Increasing patient preference for non-invasive procedures to drive the market for sensors
TABLE 86 SENSORS MARKET, BY REGION, 2019–2026 (USD MILLION)
TABLE 87 SENSORS MARKET, BY REGION, 2019–2026 (THOUSAND UNITS)
TABLE 88 NORTH AMERICA: SENSORS MARKET, BY REGION, 2019–2026 (USD MILLION)
TABLE 89 EUROPE: SENSORS MARKET, BY COUNTRY, 2019–2026 (USD MILLION)
TABLE 90 APAC: SENSORS MARKET, BY COUNTRY, 2019–2026 (USD MILLION)
6.3.1.3 Pastes & gels
6.3.1.3.1 Development of novel gels & pastes is likely to drive market growth
TABLE 91 PASTES & GELS MARKET, BY REGION, 2019–2026 (USD MILLION)
TABLE 92 PASTES & GELS MARKET, BY REGION, 2019–2026 (THOUSAND UNITS)
TABLE 93 NORTH AMERICA: PASTES & GELS MARKET, BY COUNTRY, 2019–2026 (USD MILLION)
TABLE 94 EUROPE: PASTES & GELS MARKET, BY COUNTRY, 2019–2026 (USD MILLION)
TABLE 95 APAC: PASTES & GELS MARKET, BY COUNTRY, 2019–2026 (USD MILLION)
6.3.1.4 Caps
6.3.1.4.1 Extended application of Infacaps for premature babies to offer new opportunities for market players
TABLE 96 CAPS MARKET, BY REGION, 2019–2026 (USD MILLION)
TABLE 97 CAPS MARKET, BY REGION, 2019–2026 (THOUSAND UNITS)
TABLE 98 NORTH AMERICA: CAPS MARKET, BY COUNTRY, 2019–2026 (USD MILLION)
TABLE 99 EUROPE: CAPS MARKET, BY COUNTRY, 2019–2026 (USD MILLION)
TABLE 100 APAC: CAPS MARKET, BY COUNTRY, 2019–2026 (USD MILLION)
6.3.1.5 Batteries
6.3.1.5.1 Increasing usage of portable devices will drive market growth
TABLE 101 BATTERIES MARKET, BY REGION, 2019–2026 (USD MILLION)
TABLE 102 BATTERIES MARKET, BY REGION, 2019–2026 (THOUSAND UNITS)
TABLE 103 NORTH AMERICA: BATTERIES MARKET, BY COUNTRY, 2019–2026 (USD MILLION)
TABLE 104 EUROPE: BATTERIES MARKET, BY COUNTRY, 2019–2026 (USD MILLION)
TABLE 105 APAC: BATTERIES MARKET, BY COUNTRY, 2019–2026 (USD MILLION)
6.3.1.6 Cables
6.3.1.6.1 Technological developments for increasing the capabilities and lifespan of cables will drive market growth
TABLE 106 CABLES MARKET, BY REGION, 2019–2026 (USD MILLION)
TABLE 107 CABLES MARKET, BY REGION, 2019–2026 (THOUSAND UNITS)
TABLE 108 NORTH AMERICA: CABLES MARKET, BY COUNTRY, 2019–2026 (USD MILLION)
TABLE 109 EUROPE: CABLES MARKET, BY COUNTRY, 2019–2026 (USD MILLION)
TABLE 110 APAC: CABLES MARKET, BY COUNTRY, 2019–2026 (USD MILLION)
6.3.1.7 Other accessories
TABLE 111 OTHER BRAIN MONITORING ACCESSORIES MARKET, BY REGION, 2019–2026 (USD MILLION)
TABLE 112 NORTH AMERICA: OTHER BRAIN MONITORING ACCESSORIES MARKET, BY COUNTRY, 2019–2026 (USD MILLION)
TABLE 113 EUROPE: OTHER BRAIN MONITORING ACCESSORIES MARKET, BY COUNTRY, 2019–2026 (USD MILLION)
TABLE 114 APAC: OTHER BRAIN MONITORING ACCESSORIES MARKET, BY COUNTRY, 2019–2026 (USD MILLION)
6.3.2 BRAIN MONITORING ACCESSORIES MARKET, BY USABILITY
TABLE 115 BRAIN MONITORING ACCESSORIES MARKET, BY USABILITY, 2019–2026 (USD MILLION)
6.3.2.1 Disposable accessories
6.3.2.1.1 Growing physician preference for disposable accessories is driving market growth
TABLE 116 DISPOSABLE ACCESSORIES MARKET, BY REGION, 2019–2026 (USD MILLION)
TABLE 117 NORTH AMERICA: DISPOSABLE ACCESSORIES MARKET, BY COUNTRY, 2019–2026 (USD MILLION)
TABLE 118 EUROPE: DISPOSABLE ACCESSORIES MARKET, BY COUNTRY, 2019–2026 (USD MILLION)
TABLE 119 APAC: DISPOSABLE ACCESSORIES MARKET, BY COUNTRY, 2019–2026 (USD MILLION)
6.3.2.2 Reusable accessories
6.3.2.2.1 High usage of reusable accessories in developing countries will drive market growth
TABLE 120 REUSABLE ACCESSORIES MARKET, BY REGION, 2019–2026 (USD MILLION)
TABLE 121 NORTH AMERICA: REUSABLE ACCESSORIES MARKET, BY COUNTRY, 2019–2026 (USD MILLION)
TABLE 122 EUROPE: REUSABLE ACCESSORIES MARKET, BY COUNTRY, 2019–2026 (USD MILLION)
TABLE 123 APAC: REUSABLE ACCESSORIES MARKET, BY COUNTRY, 2019–2026 (USD MILLION)
7 BRAIN MONITORING MARKET, BY MEDICAL CONDITION (Page No. - 131)
7.1 INTRODUCTION
TABLE 124 GLOBAL MARKET, BY MEDICAL CONDITION, 2019–2026 (USD MILLION)
7.2 TRAUMATIC BRAIN INJURY
7.2.1 GROWING INCIDENCE OF TBI ACROSS THE GLOBE TO DRIVE MARKET GROWTH
TABLE 125 BRAIN MONITORING MARKET FOR TRAUMATIC BRAIN INJURY, BY REGION, 2019–2026 (USD MILLION)
TABLE 126 NORTH AMERICA: MARKET FOR TRAUMATIC BRAIN INJURY, BY COUNTRY, 2019–2026 (USD MILLION)
TABLE 127 EUROPE: MARKET FOR TRAUMATIC BRAIN INJURY, BY COUNTRY, 2019–2026 (USD MILLION)
TABLE 128 APAC: MARKET FOR TRAUMATIC BRAIN INJURY, BY COUNTRY, 2019–2026 (USD MILLION)
7.3 STROKE
7.3.1 GROWING AWARENESS ABOUT STROKES AND THEIR TREATMENT OPTIONS TO SUPPORT MARKET GROWTH
TABLE 129 BRAIN MONITORING MARKET FOR STROKE, BY REGION, 2019–2026 (USD MILLION)
TABLE 130 NORTH AMERICA: MARKET FOR STROKE, BY COUNTRY, 2019–2026 (USD MILLION)
TABLE 131 EUROPE: MARKET FOR STROKE, BY COUNTRY, 2019–2026 (USD MILLION)
TABLE 132 APAC: MARKET FOR STROKE, BY COUNTRY, 2019–2026 (USD MILLION)
7.4 DEMENTIA
7.4.1 GOVERNMENT INITIATIVES TO PROMOTE AWARENESS OF DEMENTIA—A MAJOR FACTOR DRIVING MARKET GROWTH
TABLE 133 BRAIN MONITORING MARKET FOR DEMENTIA, BY REGION, 2019–2026 (USD MILLION)
TABLE 134 NORTH AMERICA: MARKET FOR DEMENTIA, BY COUNTRY, 2019–2026 (USD MILLION)
TABLE 135 EUROPE: MARKET FOR DEMENTIA, BY COUNTRY, 2019–2026 (USD MILLION)
TABLE 136 APAC: MARKET FOR DEMENTIA, BY COUNTRY, 2019–2026 (USD MILLION)
7.5 HEADACHE DISORDERS
7.5.1 NEUROIMAGING TECHNIQUES ARE USED FOR THE EVALUATION OF HEADACHE DISORDERS IN CLINICAL PRACTICES
TABLE 137 BRAIN MONITORING MARKET FOR HEADACHE DISORDERS, BY REGION, 2019–2026 (USD MILLION)
TABLE 138 NORTH AMERICA: MARKET FOR HEADACHE DISORDERS, BY COUNTRY, 2019–2026 (USD MILLION)
TABLE 139 EUROPE: MARKET FOR HEADACHE DISORDERS, BY COUNTRY, 2019–2026 (USD MILLION)
TABLE 140 APAC: MARKET FOR HEADACHE DISORDERS, BY COUNTRY, 2019–2026 (USD MILLION)
7.6 SLEEP DISORDERS
7.6.1 GROWING INCIDENCE OF SLEEP DISORDERS TO DRIVE MARKET GROWTH
TABLE 141 BRAIN MONITORING MARKET FOR SLEEP DISORDERS, BY REGION, 2019–2026 (USD MILLION)
TABLE 142 NORTH AMERICA: MARKET FOR SLEEP DISORDERS, BY COUNTRY, 2019–2026 (USD MILLION)
TABLE 143 EUROPE: MARKET FOR SLEEP DISORDERS, BY COUNTRY, 2019–2026 (USD MILLION)
TABLE 144 APAC: MARKET FOR SLEEP DISORDERS, BY COUNTRY, 2019–2026 (USD MILLION)
7.7 PARKINSON’S DISEASE
7.7.1 INCREASING PREVALENCE OF PARKINSON'S DISEASE TO DRIVE MARKET GROWTH
TABLE 145 BRAIN MONITORING MARKET FOR PARKINSON’S DISEASE, BY REGION, 2019–2026 (USD MILLION)
TABLE 146 NORTH AMERICA: MARKET FOR PARKINSON'S DISEASE, BY COUNTRY, 2019–2026 (USD MILLION)
TABLE 147 EUROPE: MARKET FOR PARKINSON'S DISEASE, BY COUNTRY, 2019–2026 (USD MILLION)
TABLE 148 APAC: MARKET FOR PARKINSON'S DISEASE, BY COUNTRY, 2019–2026 (USD MILLION)
7.8 EPILEPSY
7.8.1 LARGE POPULATION DEPRIVED OF ACCURATE TREATMENT FOR EPILEPSY TO OFFER GROWTH OPPORTUNITIES FOR MARKET PLAYERS
TABLE 149 BRAIN MONITORING MARKET FOR EPILEPSY, BY REGION, 2019–2026 (USD MILLION)
TABLE 150 NORTH AMERICA: MARKET FOR EPILEPSY, BY COUNTRY, 2019–2026 (USD MILLION)
TABLE 151 EUROPE: MARKET FOR EPILEPSY, BY COUNTRY, 2019–2026 (USD MILLION)
TABLE 152 APAC: MARKET FOR EPILEPSY, BY COUNTRY, 2019–2026 (USD MILLION)
7.9 HUNTINGTON’S DISEASE
7.9.1 AVAILABILITY OF ADVANCED METHODOLOGIES FOR DIAGNOSIS TO AID MARKET GROWTH
TABLE 153 BRAIN MONITORING MARKET FOR HUNTINGTON’S DISEASE, BY REGION, 2019–2026 (USD MILLION)
TABLE 154 NORTH AMERICA: MARKET FOR HUNTINGTON’S DISEASE, BY COUNTRY, 2019–2026 (USD MILLION)
TABLE 155 EUROPE: MARKET FOR HUNTINGTON’S DISEASE, BY COUNTRY, 2019–2026 (USD MILLION)
TABLE 156 APAC: MARKET FOR HUNTINGTON’S DISEASE, BY COUNTRY, 2019–2026 (USD MILLION)
7.10 OTHER MEDICAL CONDITIONS
TABLE 157 BRAIN MONITORING MARKET FOR OTHER MEDICAL CONDITIONS, BY REGION, 2019–2026 (USD MILLION)
TABLE 158 NORTH AMERICA: MARKET FOR OTHER MEDICAL CONDITIONS, BY COUNTRY, 2019–2026 (USD MILLION)
TABLE 159 EUROPE: MARKET FOR OTHER MEDICAL CONDITIONS, BY COUNTRY, 2019–2026 (USD MILLION)
TABLE 160 APAC: MARKET FOR OTHER MEDICAL CONDITIONS, BY COUNTRY, 2019–2026 (USD MILLION)
8 BRAIN MONITORING MARKET, BY END USER (Page No. - 149)
8.1 INTRODUCTION
TABLE 161 GLOBAL MARKET, BY END USER, 2019–2026 (USD MILLION)
8.2 HOSPITALS
8.2.1 HOSPITALS ARE THE MAJOR END USERS OF BRAIN MONITORING DEVICES
TABLE 162 BRAIN MONITORING MARKET FOR HOSPITALS, BY REGION, 2019–2026 (USD MILLION)
TABLE 163 NORTH AMERICA: MARKET FOR HOSPITALS, BY COUNTRY, 2019–2026 (USD MILLION)
TABLE 164 EUROPE: MARKET FOR HOSPITALS, BY COUNTRY, 2019–2026 (USD MILLION)
TABLE 165 APAC: MARKET FOR HOSPITALS, BY COUNTRY, 2019–2026 (USD MILLION)
8.3 NEUROLOGY CENTERS
8.3.1 PREFERENCE FOR THE DIAGNOSIS AND TREATMENT OF BRAIN DISORDERS AT NEUROLOGY CENTERS IS INCREASING AMONG PATIENTS
TABLE 166 BRAIN MONITORING MARKET FOR NEUROLOGY CENTERS, BY REGION, 2019–2026 (USD MILLION)
TABLE 167 NORTH AMERICA: MARKET FOR NEUROLOGY CENTERS, BY COUNTRY, 2019–2026 (USD MILLION)
TABLE 168 EUROPE: MARKET FOR NEUROLOGY CENTERS, BY COUNTRY, 2019–2026 (USD MILLION)
TABLE 169 APAC: MARKET FOR NEUROLOGY CENTERS, BY COUNTRY, 2019–2026 (USD MILLION)
8.4 AMBULATORY SURGERY CENTERS & CLINICS
8.4.1 PATIENTS ARE INCREASINGLY OPTING FOR AMBULATORY SURGERY CENTERS & CLINICS AS A MORE CONVENIENT ALTERNATIVE TO HOSPITAL-BASED OUTPATIENT PROCEDURES
TABLE 170 BRAIN MONITORING MARKET FOR AMBULATORY SURGERY CENTERS & CLINICS, BY REGION, 2019–2026 (USD MILLION)
TABLE 171 NORTH AMERICA: MARKET FOR AMBULATORY SURGERY CENTERS & CLINICS, BY COUNTRY, 2019–2026 (USD MILLION)
TABLE 172 EUROPE: MARKET FOR AMBULATORY SURGERY CENTERS & CLINICS, BY COUNTRY, 2019–2026 (USD MILLION)
TABLE 173 APAC: MARKET FOR AMBULATORY SURGERY CENTERS & CLINICS, BY COUNTRY, 2019–2026 (USD MILLION)
8.5 DIAGNOSTIC CENTERS
8.5.1 DIAGNOSTIC CENTERS OFFER DIAGNOSIS AND TREATMENT OPTIONS FOR VARIOUS NEUROLOGICAL CONDITIONS
TABLE 174 BRAIN MONITORING MARKET FOR DIAGNOSTIC CENTERS, BY REGION, 2019–2026 (USD MILLION)
TABLE 175 NORTH AMERICA: MARKET FOR DIAGNOSTIC CENTERS, BY COUNTRY, 2019–2026 (USD MILLION)
TABLE 176 EUROPE: MARKET FOR DIAGNOSTIC CENTERS, BY COUNTRY, 2019–2026 (USD MILLION)
TABLE 177 APAC: MARKET FOR DIAGNOSTIC CENTERS, BY COUNTRY, 2019–2026 (USD MILLION)
8.6 OTHER END USERS
TABLE 178 BRAIN MONITORING MARKET FOR OTHER END USERS, BY REGION, 2019–2026 (USD MILLION)
TABLE 179 NORTH AMERICA: MARKET FOR OTHER END USERS, BY COUNTRY, 2019–2026 (USD MILLION)
TABLE 180 EUROPE: MARKET FOR OTHER END USERS, BY COUNTRY, 2019–2026 (USD MILLION)
TABLE 181 APAC: MARKET FOR OTHER END USERS, BY COUNTRY, 2019–2026 (USD MILLION)
9 BRAIN MONITORING MARKET, BY REGION (Page No. - 160)
9.1 INTRODUCTION
TABLE 182 BRAIN MONITORING MARKET, BY REGION, 2019–2026 (USD MILLION)
9.2 NORTH AMERICA
FIGURE 28 NORTH AMERICA: BRAIN MONITORING MARKET SNAPSHOT
TABLE 183 NORTH AMERICA: MARKET, BY COUNTRY, 2019–2026 (USD MILLION)
TABLE 184 NORTH AMERICA: MARKET, BY PRODUCT, 2019–2026 (USD MILLION)
TABLE 185 NORTH AMERICA: BRAIN MONITORING DEVICES MARKET, BY TYPE, 2019–2026 (USD MILLION)
TABLE 186 NORTH AMERICA: BRAIN MONITORING DEVICES MARKET, BY PROCEDURE, 2019–2026 (USD MILLION)
TABLE 187 NORTH AMERICA: BRAIN MONITORING ACCESSORIES MARKET, BY TYPE, 2019–2026 (USD MILLION)
TABLE 188 NORTH AMERICA: BRAIN MONITORING ACCESSORIES MARKET, BY USABILITY, 2019–2026 (USD MILLION)
TABLE 189 NORTH AMERICA: MARKET, BY MEDICAL CONDITION, 2019–2026 (USD MILLION)
TABLE 190 NORTH AMERICA: MARKET, BY END USER, 2019–2026 (USD MILLION)
9.2.1 US
9.2.1.1 The US dominates the North American brain monitoring market
TABLE 191 US: BRAIN MONITORING MARKET, BY PRODUCT, 2019–2026 (USD MILLION)
TABLE 192 US: BRAIN MONITORING DEVICES MARKET, BY TYPE, 2019–2026 (USD MILLION)
TABLE 193 US: BRAIN MONITORING DEVICES MARKET, BY PROCEDURE, 2019–2026 (USD MILLION)
TABLE 194 US: BRAIN MONITORING ACCESSORIES MARKET, BY TYPE, 2019–2026 (USD MILLION)
TABLE 195 US: BRAIN MONITORING ACCESSORIES MARKET, BY USABILITY, 2019–2026 (USD MILLION)
TABLE 196 US: MARKET, BY MEDICAL CONDITION, 2019–2026 (USD MILLION)
TABLE 197 US: MARKET, BY END USER, 2019–2026 (USD MILLION)
9.2.2 CANADA
9.2.2.1 Growing number of hospitals and surgical centers are expected to drive the demand for brain monitoring systems in Canada
TABLE 198 CANADA: BRAIN MONITORING MARKET, BY PRODUCT, 2019–2026 (USD MILLION)
TABLE 199 CANADA: BRAIN MONITORING DEVICES MARKET, BY TYPE, 2019–2026 (USD MILLION)
TABLE 200 CANADA: BRAIN MONITORING DEVICES MARKET, BY PROCEDURE, 2019–2026 (USD MILLION)
TABLE 201 CANADA: BRAIN MONITORING ACCESSORIES MARKET, BY TYPE, 2019–2026 (USD MILLION)
TABLE 202 CANADA: BRAIN MONITORING ACCESSORIES MARKET, BY USABILITY, 2019–2026 (USD MILLION)
TABLE 203 CANADA: MARKET, BY MEDICAL CONDITION, 2019–2026 (USD MILLION)
TABLE 204 CANADA: MARKET, BY END USER, 2019–2026 (USD MILLION)
9.3 EUROPE
FIGURE 29 EUROPE: BRAIN MONITORING MARKET SNAPSHOT
TABLE 205 EUROPE: MARKET, BY COUNTRY, 2019–2026 (USD MILLION)
TABLE 206 EUROPE: MARKET, BY PRODUCT,2019–2026 (USD MILLION)
TABLE 207 EUROPE: BRAIN MONITORING DEVICES MARKET, BY TYPE, 2019–2026 (USD MILLION)
TABLE 208 EUROPE: BRAIN MONITORING DEVICES MARKET, BY PROCEDURE, 2019–2026 (USD MILLION)
TABLE 209 EUROPE: BRAIN MONITORING ACCESSORIES MARKET, BY TYPE, 2019–2026 (USD MILLION)
TABLE 210 EUROPE: BRAIN MONITORING ACCESSORIES MARKET, BY USABILITY, 2019–2026 (USD MILLION)
TABLE 211 EUROPE: MARKET, BY MEDICAL CONDITION, 2019–2026 (USD MILLION)
TABLE 212 EUROPE: MARKET, BY END USER, 2019–2026 (USD MILLION)
9.3.1 GERMANY
9.3.1.1 High burden of Alzheimer’s in the country will support market growth
TABLE 213 GERMANY: BRAIN MONITORING MARKET, BY PRODUCT, 2019–2026 (USD MILLION)
TABLE 214 GERMANY: BRAIN MONITORING DEVICES MARKET, BY TYPE, 2019–2026 (USD MILLION)
TABLE 215 GERMANY: BRAIN MONITORING DEVICES MARKET, BY PROCEDURE, 2019–2026 (USD MILLION)
TABLE 216 GERMANY: BRAIN MONITORING ACCESSORIES MARKET, BY TYPE, 2019–2026 (USD MILLION)
TABLE 217 GERMANY: BRAIN MONITORING ACCESSORIES MARKET, BY USABILITY, 2019–2026 (USD MILLION)
TABLE 218 GERMANY: MARKET, BY MEDICAL CONDITION, 2019–2026 (USD MILLION)
TABLE 219 GERMANY: MARKET, BY END USER, 2019–2026 (USD MILLION)
9.3.2 FRANCE
9.3.2.1 France to witness the highest growth in the European brain monitoring market during the forecast period
TABLE 220 FRANCE: BRAIN MONITORING MARKET, BY PRODUCT, 2019–2026 (USD MILLION)
TABLE 221 FRANCE: BRAIN MONITORING DEVICES MARKET, BY TYPE, 2019–2026 (USD MILLION)
TABLE 222 FRANCE: BRAIN MONITORING DEVICES MARKET, BY PROCEDURE, 2019–2026 (USD MILLION)
TABLE 223 FRANCE: BRAIN MONITORING ACCESSORIES MARKET, BY TYPE, 2019–2026 (USD MILLION)
TABLE 224 FRANCE: BRAIN MONITORING ACCESSORIES MARKET, BY USABILITY, 2019–2026 (USD MILLION)
TABLE 225 FRANCE: MARKET, BY MEDICAL CONDITION, 2019–2026 (USD MILLION)
TABLE 226 FRANCE: MARKET, BY END USER, 2019–2026 (USD MILLION)
9.3.3 UK
9.3.3.1 Increasing investments by public and private sectors driving the growth of the brain monitoring market in the UK
TABLE 227 UK: BRAIN MONITORING MARKET, BY PRODUCT, 2019–2026 (USD MILLION)
TABLE 228 UK: BRAIN MONITORING DEVICES MARKET, BY TYPE, 2019–2026 (USD MILLION)
TABLE 229 UK: BRAIN MONITORING DEVICES MARKET, BY PROCEDURE, 2019–2026 (USD MILLION)
TABLE 230 UK: BRAIN MONITORING ACCESSORIES MARKET, BY TYPE, 2019–2026 (USD MILLION)
TABLE 231 UK: BRAIN MONITORING ACCESSORIES MARKET, BY USABILITY, 2019–2026 (USD MILLION)
TABLE 232 UK: MARKET, BY MEDICAL CONDITION, 2019–2026 (USD MILLION)
TABLE 233 UK: MARKET, BY END USER, 2019–2026 (USD MILLION)
9.3.4 REST OF EUROPE
TABLE 234 ROE: BRAIN MONITORING MARKET, BY PRODUCT, 2019–2026 (USD MILLION)
TABLE 235 ROE: BRAIN MONITORING DEVICES MARKET, BY TYPE, 2019–2026 (USD MILLION)
TABLE 236 ROE: BRAIN MONITORING DEVICES MARKET, BY PROCEDURE, 2019–2026 (USD MILLION)
TABLE 237 ROE: BRAIN MONITORING ACCESSORIES MARKET, BY TYPE, 2019–2026 (USD MILLION)
TABLE 238 ROE: BRAIN MONITORING ACCESSORIES MARKET, BY USABILITY, 2019–2026 (USD MILLION)
TABLE 239 ROE: MARKET, BY MEDICAL CONDITION, 2019–2026 (USD MILLION)
TABLE 240 ROE: MARKET, BY END USER, 2019–2026 (USD MILLION)
9.4 ASIA PACIFIC
TABLE 241 APAC: BRAIN MONITORING MARKET, BY COUNTRY, 2019–2026 (USD MILLION)
TABLE 242 APAC: MARKET, BY PRODUCT, 2019–2026 (USD MILLION)
TABLE 243 APAC: BRAIN MONITORING DEVICES MARKET, BY TYPE,2019–2026 (USD MILLION)
TABLE 244 APAC: BRAIN MONITORING DEVICES MARKET, BY PROCEDURE, 2019–2026 (USD MILLION)
TABLE 245 APAC: BRAIN MONITORING ACCESSORIES MARKET, BY TYPE,2019–2026 (USD MILLION)
TABLE 246 APAC: BRAIN MONITORING ACCESSORIES MARKET, BY USABILITY, 2019–2026 (USD MILLION)
TABLE 247 APAC: MARKET, BY MEDICAL CONDITION, 2019–2026 (USD MILLION)
TABLE 248 APAC: MARKET, BY END USER,2019–2026 (USD MILLION)
9.4.1 JAPAN
9.4.1.1 High incidence of neurological disorders owing to the large geriatric population will drive market growth
TABLE 249 JAPAN: BRAIN MONITORING MARKET, BY PRODUCT, 2019–2026 (USD MILLION)
TABLE 250 JAPAN: BRAIN MONITORING DEVICES MARKET, BY TYPE, 2019–2026 (USD MILLION)
TABLE 251 JAPAN: BRAIN MONITORING DEVICES MARKET, BY PROCEDURE, 2019–2026 (USD MILLION)
TABLE 252 JAPAN: BRAIN MONITORING ACCESSORIES MARKET, BY TYPE, 2019–2026 (USD MILLION)
TABLE 253 JAPAN: BRAIN MONITORING ACCESSORIES MARKET, BY USABILITY, 2019–2026 (USD MILLION)
TABLE 254 JAPAN: MARKET, BY MEDICAL CONDITION, 2019–2026 (USD MILLION)
TABLE 255 JAPAN: MARKET, BY END USER, 2019–2026 (USD MILLION)
9.4.2 CHINA
9.4.2.1 China to register the highest growth in the brain monitoring market during the forecast period
TABLE 256 CHINA: BRAIN MONITORING MARKET, BY PRODUCT,2019–2026 (USD MILLION)
TABLE 257 CHINA: BRAIN MONITORING DEVICES MARKET, BY TYPE,2019–2026 (USD MILLION)
TABLE 258 CHINA: BRAIN MONITORING DEVICES MARKET, BY PROCEDURE,2019–2026 (USD MILLION)
TABLE 259 CHINA: BRAIN MONITORING ACCESSORIES MARKET, BY TYPE, 2019–2026 (USD MILLION)
TABLE 260 CHINA: BRAIN MONITORING ACCESSORIES MARKET, BY USABILITY, 2019–2026 (USD MILLION)
TABLE 261 CHINA: MARKET, BY MEDICAL CONDITION, 2019–2026 (USD MILLION)
TABLE 262 CHINA: MARKET, BY END USER, 2019–2026 (USD MILLION)
9.4.3 INDIA
9.4.3.1 Improving healthcare infrastructure in the country will support the growth of the brain monitoring market
TABLE 263 INDIA: BRAIN MONITORING MARKET, BY PRODUCT, 2019–2026 (USD MILLION)
TABLE 264 INDIA: BRAIN MONITORING DEVICES MARKET, BY TYPE,2019–2026 (USD MILLION)
TABLE 265 INDIA: BRAIN MONITORING DEVICES MARKET, BY PROCEDURE, 2019–2026 (USD MILLION)
TABLE 266 INDIA: BRAIN MONITORING ACCESSORIES MARKET, BY TYPE, 2019–2026 (USD MILLION)
TABLE 267 INDIA: BRAIN MONITORING ACCESSORIES MARKET, BY USABILITY, 2019–2026 (USD MILLION)
TABLE 268 INDIA: MARKET, BY MEDICAL CONDITION, 2019–2026 (USD MILLION)
TABLE 269 INDIA: MARKET, BY END USER, 2019–2026 (USD MILLION)
9.4.4 REST OF APAC
TABLE 270 ROAPAC: BRAIN MONITORING MARKET, BY PRODUCT, 2019–2026 (USD MILLION)
TABLE 271 ROAPAC: BRAIN MONITORING DEVICES MARKET, BY TYPE, 2019–2026 (USD MILLION)
TABLE 272 ROAPAC: BRAIN MONITORING DEVICES MARKET, BY PROCEDURE, 2019–2026 (USD MILLION)
TABLE 273 ROAPAC: BRAIN MONITORING ACCESSORIES MARKET, BY TYPE, 2019–2026 (USD MILLION)
TABLE 274 ROAPAC: BRAIN MONITORING ACCESSORIES MARKET, BY USABILITY, 2019–2026 (USD MILLION)
TABLE 275 ROAPAC: MARKET, BY MEDICAL CONDITION, 2019–2026 (USD MILLION)
TABLE 276 ROAPAC: MARKET, BY END USER,2019–2026 (USD MILLION)
9.5 REST OF THE WORLD
TABLE 277 ROW: BRAIN MONITORING MARKET, BY REGION, 2019–2026 (USD MILLION)
TABLE 278 ROW: MARKET, BY PRODUCT, 2019–2026 (USD MILLION)
TABLE 279 ROW: BRAIN MONITORING DEVICES MARKET, BY TYPE, 2019–2026 (USD MILLION)
TABLE 280 ROW: BRAIN MONITORING DEVICES MARKET, BY PROCEDURE, 2019–2026 (USD MILLION)
TABLE 281 ROW: BRAIN MONITORING ACCESSORIES MARKET, BY TYPE, 2019–2026 (USD MILLION)
TABLE 282 ROW: BRAIN MONITORING ACCESSORIES MARKET, BY USABILITY, 2019–2026 (USD MILLION)
TABLE 283 ROW: MARKET, BY MEDICAL CONDITION, 2019–2026 (USD MILLION)
TABLE 284 ROW: MARKET, BY END USER, 2019–2026 (USD MILLION)
9.5.1 LATIN AMERICA
9.5.1.1 High cost of brain monitoring and imaging modalities to hamper market growth in this region
TABLE 285 LATIN AMERICA: BRAIN MONITORING MARKET, BY PRODUCT, 2019–2026 (USD MILLION)
TABLE 286 LATIN AMERICA: BRAIN MONITORING DEVICES MARKET, BY PROCEDURE, 2019–2026 (USD MILLION)
TABLE 287 LATIN AMERICA: BRAIN MONITORING ACCESSORIES MARKET, BY USABILITY, 2019–2026 (USD MILLION)
9.5.2 MIDDLE EAST & AFRICA
9.5.2.1 Strengthening of the healthcare infrastructure in the region to support market growth
TABLE 288 MIDDLE EAST & AFRICA: BRAIN MONITORING MARKET, BY PRODUCT, 2019–2026 (USD MILLION)
TABLE 289 MIDDLE EAST & AFRICA: BRAIN MONITORING DEVICES MARKET, BY PROCEDURE, 2019–2026 (USD MILLION)
TABLE 290 MIDDLE EAST & AFRICA: BRAIN MONITORING ACCESSORIES MARKET, BY USABILITY, 2019–2026 (USD MILLION)
10 COMPETITIVE LANDSCAPE (Page No. - 209)
10.1 OVERVIEW
FIGURE 30 KEY PLAYERS ADOPTED ORGANIC AS WELL AS INORGANIC GROWTH STRATEGIES
10.2 MARKET SHARE ANALYSIS
FIGURE 31 BRAIN MONITORING MARKET SHARE, BY KEY PLAYER, 2020
10.3 COMPANY EVALUATION QUADRANT
10.3.1 STARS
10.3.2 EMERGING LEADERS
10.3.3 PARTICIPANTS
10.3.4 PERVASIVE PLAYERS
FIGURE 32 GLOBAL MARKET: COMPANY EVALUATION QUADRANT, 2020
10.4 COMPANY EVALUATION QUADRANT FOR START-UPS/SMES (2020)
10.4.1 PROGRESSIVE COMPANIES
10.4.2 RESPONSIVE COMPANIES
10.4.3 STARTING BLOCKS
10.4.4 DYNAMIC COMPANIES
FIGURE 33 GLOBAL MARKET: COMPANY EVALUATION QUADRANT FOR START-UPS/SMES, 2020
10.5 COMPETITIVE BENCHMARKING
10.5.1 PRODUCT & REGIONAL FOOTPRINT OF COMPANIES
TABLE 291 OVERALL FOOTPRINT OF KEY PLAYERS
TABLE 292 REGIONAL FOOTPRINT OF KEY PLAYERS
TABLE 293 PRODUCT FOOTPRINT OF KEY PLAYERS
10.6 COMPETITIVE SITUATION AND TRENDS
10.6.1 PRODUCT LAUNCHES/ENHANCEMENTS AND APPROVALS
TABLE 294 GLOBAL MARKET: KEY PRODUCT LAUNCHES/ENHANCEMENTS AND APPROVALS
10.6.2 DEALS
TABLE 295 GLOBAL MARKET: KEY DEALS
10.6.3 OTHER DEVELOPMENTS
TABLE 296 BRAIN MONITORING MARKET: OTHER KEY DEVELOPMENTS
11 COMPANY PROFILES (Page No. - 217)
(Business Overview, Products Offered, Recent Developments, MNM View, Key Strengths/Right to Win, Strategic Choices Made, and Weaknesses and Competitive Threats)*
11.1 NATUS MEDICAL, INC.
TABLE 297 NATUS MEDICAL, INC.: BUSINESS OVERVIEW
FIGURE 34 NATUS MEDICAL, INC.: COMPANY SNAPSHOT (2020)
11.2 NIHON KOHDEN CORPORATION
TABLE 298 NIHON KOHDEN CORPORATION: BUSINESS OVERVIEW
FIGURE 35 NIHON KOHDEN CORPORATION: COMPANY SNAPSHOT (2020)
11.3 PHILIPS HEALTHCARE
TABLE 299 KONINKLIJKE PHILIPS N.V.: BUSINESS OVERVIEW
FIGURE 36 KONINKLIJKE PHILIPS N.V.: COMPANY SNAPSHOT (2020)
11.4 GE HEALTHCARE
TABLE 300 GE HEALTHCARE: BUSINESS OVERVIEW
FIGURE 37 GE HEALTHCARE: COMPANY SNAPSHOT (2020)
11.5 SIEMENS HEALTHINEERS
TABLE 301 SIEMENS HEALTHINEERS: BUSINESS OVERVIEW
FIGURE 38 SIEMENS HEALTHINEERS: COMPANY SNAPSHOT (2020)
11.6 COMPUMEDICS LIMITED
TABLE 302 COMPUMEDICS LIMITED: BUSINESS OVERVIEW
FIGURE 39 COMPUMEDICS LIMITED: COMPANY SNAPSHOT (2020)
11.7 MEDTRONIC PLC
TABLE 303 MEDTRONIC PLC: BUSINESS OVERVIEW
FIGURE 40 MEDTRONIC PLC: COMPANY SNAPSHOT (2020)
11.8 EDWARDS LIFESCIENCES CORPORATION
TABLE 304 EDWARDS LIFESCIENCES CORPORATION: BUSINESS OVERVIEW
FIGURE 41 EDWARDS LIFESCIENCES CORPORATION: COMPANY SNAPSHOT (2020)
11.9 ADVANCED BRAIN MONITORING, INC.
TABLE 305 ADVANCED BRAIN MONITORING: BUSINESS OVERVIEW
11.10 DRÄGERWERK AG & CO. KGAA
TABLE 306 DRAGERWERK AG & CO. KGAA: BUSINESS OVERVIEW
FIGURE 42 DRÄGERWERK AG & CO. KGAA: COMPANY SNAPSHOT (2020)
11.11 MASIMO CORPORATION
TABLE 307 MASIMO CORPORATION: BUSINESS OVERVIEW
FIGURE 43 MASIMO CORPORATION: COMPANY SNAPSHOT (2020)
11.12 SPIEGELBERG GMBH & CO. KG.
TABLE 308 SPIEGELBERG GMBH & CO. KG: BUSINESS OVERVIEW
11.13 CADWELL INDUSTRIES, INC.
TABLE 309 CADWELL INDUSTRIES, INC: BUSINESS OVERVIEW
11.14 NEUROWAVE SYSTEMS, INC.
TABLE 310 NEUROWAVE SYSTEMS, INC.: BUSINESS OVERVIEW
11.15 NEUROSOFT
TABLE 311 NEUROSOFT: BUSINESS OVERVIEW
11.16 CGX (A COGNIONICS COMPANY)
11.17 INTEGRA LIFESCIENCES
TABLE 312 INTEGRA LIFESCIENCES: BUSINESS OVERVIEW
FIGURE 44 INTEGRA LIFESCIENCES: COMPANY SNAPSHOT (2020)
11.18 OTHER PLAYERS
11.18.1 NONIN
11.18.2 RIMED
11.18.3 EMOTIV
11.18.4 INFRASCAN, INC.
11.18.5 NEUSOFT MEDICAL SYSTEMS
11.18.6 CLINICAL SCIENCE SYSTEMS
11.18.7 NORAXON
11.18.8 STERNMED
*Details on Business Overview, Products Offered, Recent Developments, MNM View, Key Strengths/Right to Win, Strategic Choices Made, and Weaknesses and Competitive Threats might not be captured in case of unlisted companies.
12 APPENDIX (Page No. - 260)
12.1 DISCUSSION GUIDE
12.2 KNOWLEDGE STORE: MARKETSANDMARKETS’ SUBSCRIPTION PORTAL
12.3 AVAILABLE CUSTOMIZATIONS
12.4 RELATED REPORTS
12.5 AUTHOR DETAILS
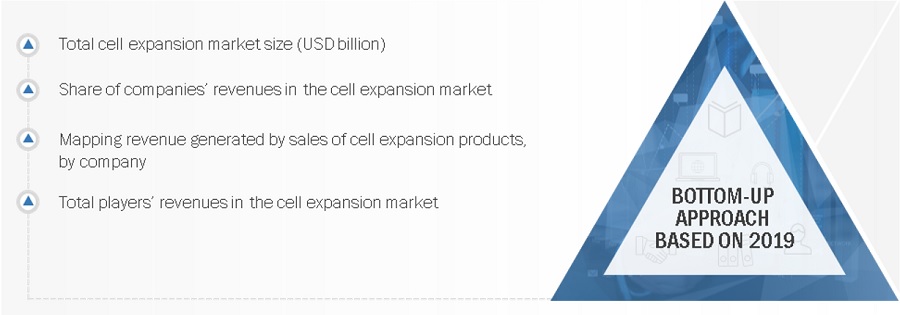
This study involved four major activities in estimating the size of brain monitoring market. Exhaustive secondary research was done to collect information on the market, peer market, and parent market. The next step was to validate these findings, assumptions, and sizing with industry experts across value chains through primary research. The bottom-up approach was employed to estimate the overall market size. After that, market breakdown and data triangulation were used to estimate the market size of segments and sub-segments.
Secondary Research
This research study involved widespread secondary sources; directories; databases such as Bloomberg Business, Factiva, and Dun & Bradstreet; white papers; annual reports; company house documents; investor presentations; and the SEC filings of companies.
Secondary research was used to identify and collect information useful for an extensive, technical, market-oriented, and commercial study of the brain monitoring market. It was also used to obtain important information about the key players and market classification & segmentation according to industry trends to the bottom-most level and key developments related to market and technology perspectives. A database of the key industry leaders was also prepared using secondary research.
Primary Research
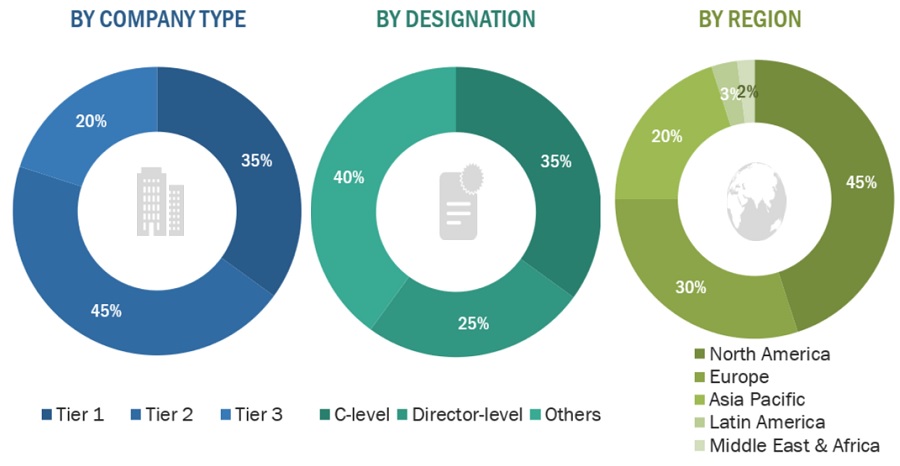
In the primary research process, various sources from both the supply and demand sides were interviewed to obtain qualitative and quantitative information for this report. Primary sources are mainly industry experts from the core and related industries and preferred suppliers, manufacturers, distributors, technology developers, researchers, and organizations related to all segments of this industry’s value chain. In-depth interviews were conducted with various primary respondents, including key industry participants, subject-matter experts (SMEs), C-level executives of key market players, and industry consultants, among other experts, to obtain and verify the critical qualitative and quantitative information as well as assess prospects. Primary research was conducted to identify segmentation types; industry trends; key players; and key market dynamics such as drivers, restraints, opportunities, challenges, industry trends, and strategies adopted by key players
To know about the assumptions considered for the study, download the pdf brochure
Market Size Estimation
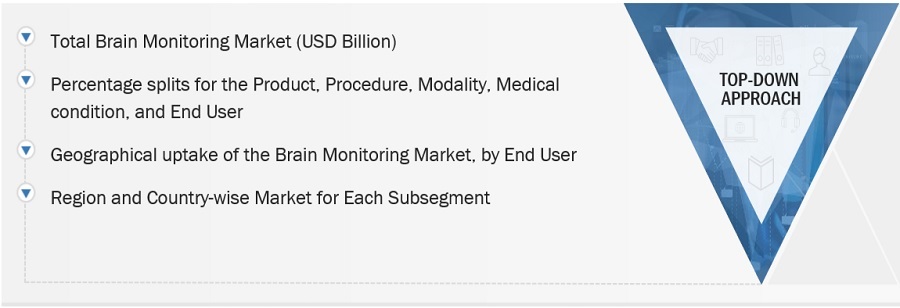
Both top-down and bottom-up approaches were used to estimate and validate the total size of the global brain monitoring market. These methods were also used extensively to estimate the size of various subsegments in the market. The research methodology used to estimate the market size includes the following:
- The key players in the industry and markets have been identified through extensive secondary research.
- The revenue generated from the sale of brain monitoring products by leading players has been determined through primary and secondary research.
- All percentage shares, splits, and breakdowns have been determined using secondary sources and verified through primary sources.
Data Triangulation
After arriving at the overall market size from the market size estimation process, the total market was split into several segments and subsegments. To complete the overall market engineering process and arrive at the exact statistics for all segments and subsegments, data triangulation and market breakdown procedures were employed, wherever applicable. The data was triangulated by studying various factors and trends from both the demand and supply sides.
Report Objectives
- To define, describe, and forecast the brain monitoring market based on product, medical condition, end user, and region
- To provide detailed information regarding the major factors influencing the growth of the market (such as drivers, restraints, opportunities, and challenges)
- To strategically analyze micromarkets1 with respect to individual growth trends, prospects, and contributions to the overall brain monitoring market
- To analyze the opportunities in the market for stakeholders and provide details of the competitive landscape for market leaders
- To profile the key players in the market and comprehensively analyze their market shares and core competencies2
- To forecast the size of the market segments with respect to four main regions, namely, North America, the Asia Pacific, Europe, and the Rest of the World (RoW)3
- To track and analyze competitive developments such as new product launches, agreements, collaborations, and expansions
Available Customizations
With the given market data, MarketsandMarkets offers customizations as per the company’s specific needs.
The following customization options are available for this report.
Company Information
- Detailed analysis and profiling of additional market players (up to 5)
Growth opportunities and latent adjacency in Brain Monitoring Market