NBR Market by Application (O-Rings & Seals, Hoses, Belts & Cables, Molded & Extruded Products, Adhesives & Sealants, Gloves), End-use Industry (Automotive & Transportation, Industrial, Oil & Gas, Medical), and Region - Global Forecast 2022


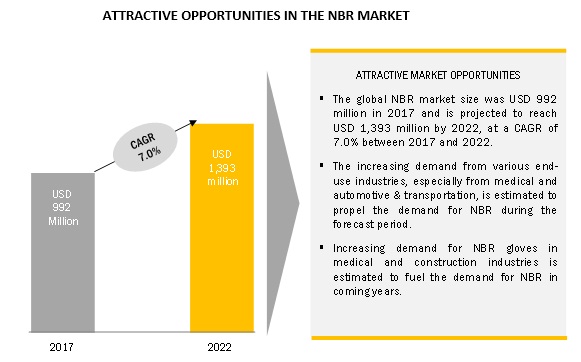
[149 Pages Report] NBR (Nitrile butadiene rubber) market size was USD 992.4 million in 2017 and projected to reach USD 1,393.0 million by 2022, registering a CAGR of 7.0% between 2017 and 2022. Rising use of NBR in O-rings & seals and gloves applications; growing trend of using NBR in automotive and oil & gas end-users to due to its high oil resistance and high heat stability.
The o-rings & seals segment accounted for the largest share of the market.
O-rings & seals was the largest application of NBR. O-rings & seals are used in the manufacturing, oil & gas, and automotive industries. The consumption of O-rings & seals in the automotive industry is directly related to vehicle manufacturing. Nitrile O-rings due to their desirable properties, which include low compression set, high tensile strength, and high abrasion and oil resistance are used in the manufacturing of O-rings & seals. O-rings & seals are made with different grades.
Medical is projected to be the fastest-growing application of NBR during the forecast period.
The medical end-use industry is projected to register the fastest-growth during the forecast period. NBR is being increasingly used in the production of medical gloves due to its cost-effectiveness. In the trade-off between quality and cost of materials used for gloves, NBR is preferred over other materials such as isoprene and latex. NBR gloves are puncture-resistant, and they also allow to identify any wear and tear easily when compared with latex gloves. NBR is also used in tubes, stoppers, and cushioning or supporting materials along with medical devices and equipment.
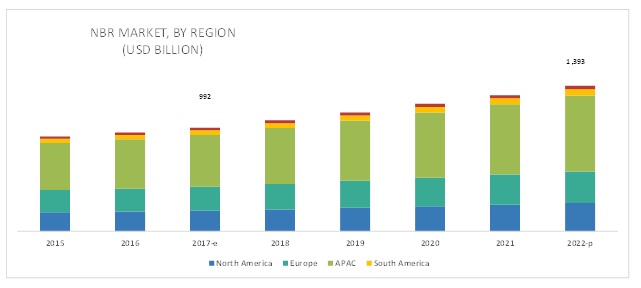
APAC is estimated to account for the largest market share during the forecast period.
APAC led the NBR market, in terms of both volume and value. In addition, APAC is also projected to be the fastest-growing market during the forecast period. The increased demand for NBR from the automotive & transportation, medical, construction, and other industries in countries such as China and Japan is driving the market in APAC. In addition, the growing investments in the automotive & transportation, manufacturing, and medical industries in APAC are driving the demand for NBR in these industries.
Market Dynamics
Drivers-Large-scale demand from the automotive industry
NBR is widely used in the automotive industry, and its largest application is in O-rings, belts, and cables. NBR is used in treads and sidewalls of tires, as it provides good abrasion and low rolling resistance, which ensure high performance. Apart from these benefits, NBR is a low-cost alternative to natural rubber with improved properties. The growth of the NBR market is thus influenced by the automotive industry.
Restraints-Availability of substitute materials
Though NBR is economical and has compression set resistance and resilience, and high water swell resistance, tear strength, and oil & grease resistance, there are substitutes with the same properties. The elastic materials such as thermoplastic elastomers (TPE), fluoroelastomers, and natural rubber can be used in various applications to replace NBR. For instance, NBR has limited resistance to ozonization. Hence, in aeronautics applications, it can be replaced with TPE or fluoroelastomers. The fluoroelastomers can operate more efficiently in border temperature range as compared with NBR and have excellent resistance to oils, greases, aliphatic, aromatic, chlorinated hydrocarbons along with many organic solvents and chemicals.
Opportunities-Growing end-use industries in APAC
The automotive, aeronautics, construction, medical, and food & beverage industries in the APAC countries are growing rapidly. The domestic manufacturing industry in the region has grown significantly in the past decade led by China, Japan, and South Korea, and it is expected to remain same in the future. The countries such as China and India are rapidly growing economies in the region and are attracting investments from domestic and foreign companies. The domestic NBR product manufacturers such as gloves, hoses, and belts are increasing their capacities to cope up with the increased domestic and global demand. For instance, the Malaysian glove manufacturers are expanding their production capacities to leverage the rising demand for NBR gloves. Malaysia is currently the world's largest producer of rubber gloves, accounting for more than 60% of the global market, in terms of volume. In 2017, the global exports of rubber gloves are estimated 228 billion pieces and projected to reach 287 billion by 2020. In 2017, exports are estimated at a robust rate of 19.4% year-on-year to USD 4.8 billion when compared with USD 3.4 billion in the previous year.
Challenges-Fluctuating raw material prices
Volatile raw material prices are one of the major challenges for the NBR market. The market for NBR is very competitive; even small changes in the supply and demand balances are reflected in its prices. The oil sold by Saudi Arabia and Nigeria to the US are now competing for the Asian market, which resulted in producers being forced to drop the prices of crude oil. This price fall has affected the refining industries, as well as, the upstream oil & gas industry. This has affected the NBR market, as NBR is a by-product of crude oil.
Scope of the Report
|
Report Metric |
Details |
|
Years considered for the study |
2015�2022 |
|
Base year considered |
2016 |
|
Forecast period |
2017�2022 |
|
Units considered |
Volumer (Kiloton) and Value (USD) |
|
Segments covered |
Application, End-Use Industry, Type and Region |
|
Geographies covered |
North America, APAC, Europe, Middle East & Africa, and South America |
|
Companies covered |
LANXESS (Germany), Sinopec (China), Kumho Petrochemical (South Korea), TSRC Corporation (Taiwan), JSR Corporation (Japan), LG Chem (South Korea), Versalis S.p.A (Italy), ZEON Corporation (Japan), SIBUR Holding (Russia), and OMNOVA Solutions Inc. (US). |
Report Segmentation
NBR Market, by Application
- O-rings & Seals
- Hoses, Belts & Cables
- Molded & extruded products
- Adhesives & Sealants
- Gloves (Includes Industrial and Medical)
- Others (includes plasticizers, processing aid and resin modifier)
NBR Market, by End-Use industry
- Automotive & Transportation
- Industrial (Includes Machineries)
- Oil & Gas
- Mining & Metallurgy
- Construction
- Medical
- Others (includes Cots & Aprons, Plastics)
NBR Market, by Type
- Bimodal
- Liquid
- Carboxylated
NBR Market, by Region
- North America
- Europe
- APAC
- Middle East & Africa
- South America
Key Market Players
The leading players in the NBR Market are LANXESS (Germany), Sinopec (China), Kumho Petrochemical (South Korea), TSRC Corporation (Taiwan), JSR Corporation (Japan), LG Chem (South Korea), Versalis S.p.A (Italy), ZEON Corporation (Japan), SIBUR Holding (Russia), and OMNOVA Solutions Inc. (US).
Recent Developments
- In July 2016, Lanxess launched new grades of NBR and introduced two new HNBR elastomers for low-temperature applications: Therban LT 1707 and LT 1757.
- In September 2015, ZEON Corp. established a unit in Haryana, India. This expansion has benefitted the company as the rubber market in India is growing rapidly. The unit looks after the imports and sales & marketing of ZEON products, including NBR.
- In April 2016, LANXESS and Saudi Aramco (Saudi Arabia) signed an agreement to establish a joint venture for synthetic rubber production. Both the companies signed an agreement to create a 50:50 joint venture to form a company named, ARLANXEO. Through this joint venture, the company is investing in synthetic rubbers, including NBR and elastomer products.
Key questions addressed by the report:
- What are the global trends in demand for NBR? Will the market witness an increase or decline in demand in the coming years?
- What is the estimated demand for the different applications of NBR?
- What were the revenue pockets for the NBR market in 2016?
- What are the different end-use industries of NBR?
- Who are the major NBR manufacturers globally?
To speak to our analyst for a discussion on the above findings, click Speak to Analyst
 Exclusive indicates content/data unique to MarketsandMarkets and not available with any competitors.
Table of Contents
1 Introduction (Page No. - 16)
1.1 Objectives of the Study
1.2 Market Definition
1.3 Market Scope
1.3.1 Years Considered for the Study
1.4 Currency
1.5 Unit Considered
1.6 Limitations
1.7 Stakeholders
2 Research Methodology (Page No. - 19)
2.1 Research Data
2.1.1 Secondary Data
2.1.1.1 Key Data From Secondary Sources
2.1.2 Primary Data
2.1.2.1 Key Data From Primary Sources
2.1.2.2 Key Industry Insights
2.1.2.3 Breakdown of Primary Interviews
2.2 Market Size Estimation
2.2.1 Bottom-Up Approach
2.2.2 Top Down Approach
2.3 Data Triangulation
2.4 Research Assumptions & Limitations
3 Executive Summary (Page No. - 27)
4 Premium Insights (Page No. - 31)
4.1 Attractive Market Opportunities for NBR
4.2 NBR Market, By Region
5 Market Overview (Page No. - 34)
5.1 Introduction
5.2 Market Dynamics
5.2.1 Drivers
5.2.1.1 Increasing Demand for NBR Gloves
5.2.1.2 Increasing Demand From Automotive Industry
5.2.2 Restraints
5.2.2.1 Restrictions on Use of Phthalates in NBR Formulations and Other Environmental Regulations on Rubber Manufacturing
5.2.2.2 Availability of Substitute Materials
5.2.3 Opportunities
5.2.3.1 Growing End-Use Industries in APAC
5.2.4 Challenges
5.2.4.1 Fluctuating Raw Material Prices
5.2.4.2 Natural Rubber Cultivation
5.3 Porter�s Five Forces Analysis
5.3.1.1 Bargaining Power of Buyers
5.3.1.2 Bargaining Power of Suppliers
5.3.1.3 Threat of New Entrants
5.3.1.4 Threat of Substitutes
5.3.1.5 Intensity of Competitive Rivalry
5.4 Macroeconomic Indicators
5.4.1 GDP Growth Rate Forecast of Major Economies, Globally
5.4.2 Automotive Industry Analysis
5.5 Rubber Industry Analysis
6 NBR Market, By Application (Page No. - 44)
6.1 Introduction
6.2 O-Rings & Seals
6.3 Hoses, Belts & Cables
6.4 Molded & Extruded Products
6.5 Adhesives & Sealants
6.6 Gloves
6.7 Others
7 NBR Market, By End-Use Industry (Page No. - 57)
7.1 Introduction
7.2 Automotive & Transportation
7.3 Industrial
7.4 Oil & Gas
7.5 Mining & Metallurgy
7.6 Construction
7.7 Medical
7.8 Others
8 NBR Market, By Region (Page No. - 72)
8.1 Introduction
8.2 North America
8.2.1 US
8.2.2 Canada
8.2.3 Mexico
8.3 Europe
8.3.1 Germany
8.3.2 France
8.3.3 UK
8.3.4 Italy
8.3.5 Russia
8.3.6 Rest of Europe
8.4 APAC
8.4.1 China
8.4.2 Japan
8.4.3 South Korea
8.4.4 Taiwan
8.4.5 Malaysia
8.4.6 Thailand
8.4.7 Rest of APAC
8.5 Middle East & Africa
8.5.1 Saudi Arabia
8.5.2 Rest of Middle East & Africa
8.6 South America
8.6.1 Brazil
8.6.2 Rest of South America
9 Competitive Landscape (Page No. - 121)
9.1 Overview
9.1 Market Ranking of Key Players
9.2 Competitive Scenario
9.2.1 New Product Developments
9.2.2 Expansions
9.2.3 Joint Ventures
9.2.4 Acquisitions
9.2.5 Partnerships
10 Company Profiles (Page No. - 125)
10.1 Lanxess
10.1.1 Business Overview
10.1.2 Products Offered
10.1.3 Recent Developments
10.1.4 Lanxess: SWOT Analysis
10.1.5 MnM View
10.2 Sinopec
10.2.1 Business Overview
10.2.2 Products Offered
10.2.3 Recent Developments
10.2.4 Sinopec: SWOT Analysis
10.2.5 MnM View
10.3 Kumho Petrochemical
10.3.1 Business Overview
10.3.2 Products Offered
10.3.3 Kumho Petrochemical: SWOT Analysis
10.3.4 MnM View
10.4 TSRC Corporation
10.4.1 Business Overview
10.4.2 Products Offered
10.4.3 Recent Developments
10.4.4 TSRC Corporation: SWOT Analysis
10.4.5 MnM View
10.5 JSR Corporation
10.5.1 Business Overview
10.5.2 Products Offered
10.5.3 JSR Corporation: SWOT Analysis
10.5.4 MnM View
10.6 LG Chem
10.6.1 Overview
10.6.2 Products Offered
10.6.3 MnM View
10.7 Versalis S.P.A.
10.7.1 Business Overview
10.7.2 Products Offered
10.7.3 Recent Developments
10.7.4 MnM View
10.8 Zeon Corporation
10.8.1 Business Overview
10.8.2 Products Offered
10.8.3 Recent Developments
10.8.4 MnM View
10.9 Sibur Holding
10.9.1 Business Overview
10.9.2 Products Offered
10.9.3 Recent Developments
10.9.4 MnM View
10.10 Omnova Solutions Inc.
10.10.1 Business Overview
10.10.2 Products Offered
10.10.3 MnM View
10.11 Other Players
10.11.1 Synthos Sa
10.11.2 Apcotex Industries Limited
11 Appendix (Page No. - 144)
11.1 Insights From Key Industry Experts
11.2 Discussion Guide
11.3 Introducing RT: Real-Time Market Intelligence
11.4 Available Customizations
11.5 Related Reports
List of Tables (156 Tables)
Table 1 trends and Forecast for GDP Growth Rates Between 2016 and 2021 44
Table 2 automotive Production Statistics of Key Countries in 2017 45
Table 3 rubber Production/Consumption Ratio in APAC 46
Table 4 NBR Market Size, By Application, 2015�2022 (Kiloton) 49
Table 5 NBR Market Size, By Application, 2015�2022 (USD Million) 49
Table 6 NBR Market Size in O-Rings & Seals Application, By Region, 2015�2022 (Kiloton) 50
Table 7 NBR Market Size in O-Rings & Seals Application, By Region, 2015�2022 (USD Million) 51
Table 8 NBR Market Size in Hoses, Belts & Cables Application, By Region, 2015�2022 (Kiloton) 53
Table 9 NBR Market Size in Hoses, Belts & Cables Application, By Region, 2015�2022 (USD Million) 53
Table 10 NBR Market Size in Molded & Extruded Products Application, By Region, 2015�2022 (Kiloton) 55
Table 11 NBR Market Size in Molded & Extruded Products Application, By Region, 2015�2022 (USD Million) 55
Table 12 NBR Market Size in Adhesives & Sealants Application, By Region, 2015�2022 (Kiloton) 56
Table 13 NBR Market Size in Adhesives & Sealants Application, By Region, 2015�2022 (USD Million) 57
Table 14 NBR Market Size in Gloves Application, By Region, 2015�2022 (Kiloton) 58
Table 15 NBR Market Size in Gloves Application, By Region, 2015�2022 (USD Million) 58
Table 16 NBR Market Size in Other Applications, By Region, 2015�2022 (Kiloton)
Table 17 NBR Market Size in Other Applications, By Region, 2015�2022 (USD Million)
Table 18 NBR Market Size, By End-Use Industry, 2015�2022 (Kiloton)
Table 19 NBR Market Size, By End-Use Industry, 2015�2022 (USD Million)
Table 20 NBR Market Size in Automotive & Transportation Industry, By Region, 2015�2022 (Kiloton)
Table 21 NBR Market Size in Automotive & Transportation Industry, By Region, 2015�2022 (USD Million)
Table 22 NBR Market Size in Industrial Segment, By Region, 2015�2022 (Kiloton)
Table 23 NBR Market Size in Industrial Segment, By Region, 2015�2022 (USD Million)
Table 24 NBR Market Size in Oil & Gas Industry, By Region, 2015�2022 (Kiloton)
Table 25 NBR Market Size in Oil & Gas Industry, By Region, 2015�2022 (USD Million)
Table 26 NBR Market Size in Mining & Metallurgy Industry, By Region, 2015�2022 (Kiloton)
Table 27 NBR Market Size in Mining & Metallurgy Industry, By Region, 2015�2022 (USD Million)
Table 28 NBR Market Size in Construction Industry, By Region, 2015�2022 (Kiloton)
Table 29 NBR Market Size in Construction Industry, By Region, 2015�2022 (USD Million)
Table 30 NBR Market Size in Medical Industry, By Region, 2015�2022 (Kiloton)
Table 31 NBR Market Size in Medical Industry, By Region, 2015�2022 (USD Million)
Table 32 NBR Market Size in Other End-Use Industries, By Region, 2015�2022 (Kiloton)
Table 33 NBR Market Size in Other End-Use Industries, By Region, 2015�2022 (USD Million)
Table 34 NBR Market, By Region, 2015-2022 (Kiloton)
Table 35 NBR Market, By Region, 2015-2022 (USD Million)
Table 36 North American Light-Vehicle Production
Table 37 North America: NBR Market Size, By Country, 2015-2022 (Kiloton)
Table 38 North America: NBR Market Size, By Country, 2015-2022 (USD Million)
Table 39 North America: NBR Market, By Application, 2015-2022 (Kiloton)
Table 40 North America: NBR Market , By Application, 2015-2022 (USD Million)
Table 41 North America: NBR Market Size, By End-Use Industry, 2015-2022 (Kiloton)
Table 42 North America: NBR Market Size, By End-Use Industry, 2015-2022 (USD Million)
Table 43 Leading Ports Exporting Light Vehicle Goods
Table 44 US: NBR Market Size, By Application, 2015-2022 (Kiloton)
Table 45 US: NBR Market Size, By Application, 2015-2022 (USD Million)
Table 46 US: NBR Market Size, By End-USe IndUStry, 2015-2022 (Kiloton)
Table 47 US: NBR Market Size, By End-Use Industry, 2015-2022 (USD Million)
Table 48 Canada: NBR Market Size, By Application, 2015-2022 (Kiloton)
Table 49 Canada: NBR Market Size, By Application, 2015-2022 (USD Million)
Table 50 Canada: NBR Market Size, By End-Use Industry, 2015-2022 (Kiloton)
Table 51 Canada: NBR Market Size, By End-Use Industry, 2015-2022 (USD Million)
Table 52 Mexico Accounts for Nearly Half of the Car Production in North America
Table 53 Medical Device and Equipment Market Size in Mexico (USD Billion):
Table 54 Mexico: NBR Market Size, By Application, 2015-2022 (Kiloton)
Table 55 Mexico: NBR Market Size, By Application, 2015-2022 (USD Million)
Table 56 Mexico: NBR Market Size, By End-Use Industry, 2015-2022 (Kiloton)
Table 57 Mexico: NBR Market Size, By End-Use Industry, 2015-2022 (USD Million)
Table 58 Europe: NBR Market Size, By Country, 2015-2022 (Kiloton)
Table 59 Europe: NBR Market Size, By Country, 2015-2022 (USD Million)
Table 60 Europe: NBR Market, By Application, 2015-2022 (Kiloton)
Table 61 Europe: NBR Market, By Application, 2015-2022 (USD Million)
Table 62 Europe: NBR Market Size, By End-Use Industry, 2015-2022 (Kiloton)
Table 63 Europe: NBR Market Size, By End-Use Industry, 2015-2022 (USD Million)
Table 64 Germany: NBR Market Size, By Application, 2015-2022 (Kiloton)
Table 65 Germany: NBR Market Size, By Application, 2015-2022 (USD Million)
Table 66 Germany: NBR Market Size, By End-Use Industry, 2015-2022 (Kiloton)
Table 67 Germany: NBR Market Size, By End-Use Industry, 2015-2022 (USD Million)
Table 68 France: NBR Market Size, By Application, 2015-2022 (Kiloton)
Table 69 France: NBR Market Size, By Application, 2015-2022 (USD Million)
Table 70 France: NBR Market Size, By End-Use Industry, 2015-2022 (Kiloton)
Table 71 France: NBR Market Size, By End-Use Industry, 2015-2022 (USD Million)
Table 72 UK: NBR Market Size, By Application, 2015-2022 (Kiloton)
Table 73 UK: NBR Market Size, By Application, 2015-2022 (USD Million)
Table 74 UK: NBR Market Size, By End-Use Industry, 2015-2022 (Kiloton)
Table 75 UK: NBR Market Size, By End-Use Industry, 2015-2022 (USD Million)
Table 76 Italy: NBR Market Size, By Application, 2015-2022 (Kiloton)
Table 77 Italy: NBR Market Size, By Application, 2015-2022 (USD Million)
Table 78 Italy: NBR Market Size, By End-Use Industry, 2015-2022 (Kiloton)
Table 79 Italy: NBR Market Size, By End-Use Industry, 2015-2022 (USD Million)
Table 80 Russia: NBR Market Size, By Application, 2015-2022 (Kiloton)
Table 81 Russia: NBR Market Size, By Application, 2015-2022 (USD Million)
Table 82 Russia: NBR Market Size, By End-Use Industry, 2015-2022 (Kiloton)
Table 83 Russia: NBR Market Size, By End-Use Industry, 2015-2022 (USD Million)
Table 84 Rest of Europe: NBR Market Size, By Application, 2015-2022 (Kiloton)
Table 85 Rest of Europe: NBR Market Size, By Application, 2015-2022 (USD Million)
Table 86 Rest of Europe: NBR Market Size, By End-Use Industry, 2015-2022 (Kiloton)
Table 87 Rest of Europe: NBR Market Size, By End-Use Industry, 2015-2022 (USD Million)
Table 88 APAC: NBR Market Size, By Country, 2015-2022 (Kiloton)
Table 89 APAC: NBR Market Size, By Country, 2015-2022 (USD Million)
Table 90 APAC: NBR Market, By Application, 2015-2022 (Kiloton)
Table 91 APAC: NBR Market, By Application, 2015-2022 (USD Million)
Table 92 APAC: NBR Market Size, By End-Use Industry, 2015-2022 (Kiloton)
Table 93 APAC: NBR Market Size, By End-Use Industry, 2015-2022 (USD Million)
Table 94 China: NBR Market Size, By Application, 2015-2022 (Kiloton)
Table 95 China: NBR Market Size, By Application, 2015-2022 (USD Million)
Table 96 China: NBR Market Size, By End-Use Industry, 2015-2022 (Kiloton)
Table 97 China: NBR Market Size, By End-Use Industry, 2015-2022 (USD Million)
Table 98 Japan: NBR Market Size, By Application, 2015-2022 (Kiloton)
Table 99 Japan: NBR Market Size, By Application, 2015-2022 (USD Million)
Table 100 Japan: NBR Market Size, By End-Use Industry, 2015-2022 (Kiloton)
Table 101 Japan: NBR Market Size, By End-Use Industry, 2015-2022 (USD Million)
Table 102 South Korea: NBR Market Size, By Application, 2015-2022 (Kiloton)
Table 103 South Korea: NBR Market Size, By Application, 2015-2022 (USD Million)
Table 104 South Korea: NBR Market Size, By End-Use Industry, 2015-2022 (Kiloton)
Table 105 South Korea: NBR Market Size, By End-Use Industry, 2015-2022 (USD Million)
Table 106 Taiwan: NBR Market Size, By Application, 2015-2022 (Kiloton)
Table 107 Taiwan: NBR Market Size, By Application, 2015-2022 (USD Million)
Table 108 Taiwan: NBR Market Size, By End-Use Industry, 2015-2022 (Kiloton)
Table 109 Taiwan: NBR Market Size, By End-Use Industry, 2015-2022 (USD Million)
Table 110 Malaysia: NBR Market Size, By Application, 2015-2022 (Kiloton)
Table 111 Malaysia: NBR Market Size, By Application, 2015-2022 (USD Million)
Table 112 Malaysia: NBR Market Size, By End-Use Industry, 2015-2022 (Kiloton)
Table 113 Malaysia: NBR Market Size, By End-Use Industry, 2015-2022 (USD Million)
Table 114 Thailand: NBR Market Size, By Application, 2015-2022 (Kiloton)
Table 115 Thailand: NBR Market Size, By Application, 2015-2022 (USD Million)
Table 116 Thailand: NBR Market Size, By End-Use Industry, 2015-2022 (Kiloton)
Table 117 Thailand: NBR Market Size, By End-Use Industry, 2015-2022 (USD Million)
Table 118 Rest of APAC: NBR Market Size, By Application, 2015-2022 (Kiloton)
Table 119 Rest of APAC: NBR Market Size, By Application, 2015-2022 (USD Million)
Table 120 Rest of APAC: NBR Market Size, By End-Use Industry, 2015-2022 (Kiloton)
Table 121 Rest of APAC: NBR Market Size, By End-Use Industry, 2015-2022 (USD Million)
Table 122 Middle East & Africa: NBR Market Size, By Country, 2015-2022 (Kiloton)
Table 123 Middle East & Africa: NBR Market Size, By Country, 2015-2022 (USD Million)
Table 124 Middle East & Africa: NBR Market, By Application, 2015-2022 (Kiloton)
Table 125 Middle East & Africa: NBR Market, By Application, 2015-2022 (USD Million)
Table 126 Middle East & Africa: NBR Market Size, By End-Use Industry, 2015-2022 (Kiloton)
Table 127 Middle East & Africa: NBR Market Size, By End-Use Industry, 2015-2022 (USD Million)
Table 128 Automotive Components Manufacturers in Saudi Arabia
Table 129 Saudi Arabia: Automotive Parts Import Export Overview, 2015
Table 130 Saudi Arabia: NBR Market Size, By Application, 2015-2022 (Kiloton)
Table 131 Saudi Arabia: NBR Market Size, By Application, 2015-2022 (USD Million)
Table 132 Saudi Arabia: NBR Market Size, By End-Use Industry, 2015-2022 (Kiloton)
Table 133 Saudi Arabia: NBR Market Size, By End-Use Industry, 2015-2022 (USD Million)
Table 134 Rest of Middle East & Africa: NBR Market Size, By Application, 2015-2022 (Kiloton)
Table 135 Rest of Middle East & Africa: NBR Market Size, By Application, 2015-2022 (USD Million)
Table 136 Rest of Middle East & Africa: NBR Market Size, By End-Use Industry, 2015-2022 (Kiloton)
Table 137 Rest of Middle East & Africa: NBR Market Size, By End-Use Industry, 2015-2022 (USD Million)
Table 138 South America: NBR Market Size, By Country, 2015-2022 (Kiloton)
Table 139 South America: NBR Market Size, By Country, 2015-2022 (USD Million)
Table 140 South America: NBR Market, By Application, 2015-2022 (Kiloton)
Table 141 South America: NBR Market, By Application, 2015-2022 (USD Million)
Table 142 South America: NBR Market Size, By End-Use Industry, 2015-2022 (Kiloton)
Table 143 South America: NBR Market Size, By End-Use Industry, 2015-2022 (USD Million)
Table 144 Brazil: NBR Market Size, By Application, 2015-2022 (Kiloton)
Table 145 Brazil: NBR Market Size, By Application, 2015-2022 (USD Million)
Table 146 Brazil: NBR Market Size, By End-Use Industry, 2015-2022 (Kiloton)
Table 147 Brazil: NBR Market Size, By End-Use Industry, 2015-2022 (USD Million)
Table 148 Rest of South America: NBR Market Size, By Application, 2015-2022 (Kiloton)
Table 149 Rest of South America: NBR Market Size, By Application, 2015-2022 (USD Million)
Table 150 Rest of South America: NBR Market Size, By End-Use Industry, 2015-2022 (Kiloton)
Table 151 Rest of South America: NBR Market Size, By End-Use Industry, 2015-2022 (USD Million)
Table 152 New Product Developments, 2012-2017
Table 153 Expansions, 2012-2017
Table 154 Joint Ventures, 2012�2017
Table 155 Acquisitions, 2012�2017
Table 156 Partnerships, 2012�2017
List of Figures (42 Figures)
Figure 1 NBR: Market Segmentation
Figure 2 NBR Market: Research Design
Figure 3 Market Size Estimation Methodology: Bottom-Up Approach
Figure 4 Market Size Estimation Methodology: Top-Down Approach
Figure 5 NBR Market: Data Triangulation
Figure 6 O-Rings & Seals to Be the Largest Application of NBR
Figure 7 Automotive & Transportation to Be the Largest End-Use Industry of NBR
Figure 8 APAC NBR Market to Witness Significant Growth
Figure 9 NBR Market Size, 2017 vs 2022
Figure 10 APAC Was the Fastest-Growing Market and Automotive & Transportation Was the Largest Application
Figure 11 Automotive & Transportation Was the Largest End-Use Industry of NBR
Figure 12 APAC to Be the Largest NBR Market
Figure 13 Factors Governing the NBR Market
Figure 14 O-Rings & Seals Was the Largest Application of NBR in 2016
Figure 15 APAC to Be the Fastest-Growing NBR Market in O-Rings & Seals Application
Figure 16 APAC to Lead the Market in Hoses, Belts & Cables Application
Figure 17 APAC to Be the Largest NBR Market in Molded & Extruded Products Application
Figure 18 APAC to Lead the NBR Market in Adhesives & Sealants Application
Figure 19 APAC to Be the Fastest-Growing NBR Market in Gloves Application
Figure 20 APAC to Be the Fastest-Growing NBR Market in Other Applications
Figure 21 Automotive & Transportation Was the Largest End-Use Industry of NBR in 2016
Figure 22 APAC to Be the Largest NBR Market in the Automotive & Transportation End-Use Industry
Figure 23 APAC to Lead the NBR Market in the Industrial Segment
Figure 24 North America to Be the Fastest-Growing NBR Market in Oil & Gas End-Use Industry
Figure 25 APAC to Be the Fastest-Growing NBR Market in Mining & Metallurgy End-Use Industry
Figure 26 APAC to Be the Fastest-Growing NBR Market in Construction End-Use Industry
Figure 27 APAC to Be the Fastest-Growing NBR Market in Medical End-Use Industry
Figure 28 APAC to Be the Fastest-Growing NBR Market in Other End-Use Industries
Figure 29 Regional Snapshot � Rapidly Growing Markets are Emerging as New Hotspots
Figure 30 Europe: NBR Market Snapshot
Figure 31 APAC: NBR Market Snapshot
Figure 32 Key Developments By Leading Players Between 2012 and 2017
Figure 33 Lanxess: Company Snapshot
Figure 34 Sinopec: Company Snapshot
Figure 35 Kumho Petrochemical: Company Snapshot
Figure 36 TSRC Corporation: Company Snapshot
Figure 37 JSR Corporation: Company Snapshot
Figure 38 LG Chem: Company Snapshot
Figure 39 Versalis S.P.A.: Company Snapshot
Figure 40 Zeon Corporation: Company Snapshot
Figure 41 Sibur Holding: Company Snapshot
Figure 42 Omnova Solutions Inc.: Company Snapshot


Growth opportunities and latent adjacency in NBR Market