Noise Monitoring Market by Sampling Method (Short-term, Long-term, & Permanent Monitoring), precision Type (Class 1 & Class 2), Connectivity (Wi-Fi, Cellular, Ethernet, & USB), Solution (Hardware, Software, & Service), Application, and Geography - Global Growth Driver and Industry Forecast to 2035


Noise Monitoring Market Summary
The global Noise Monitoring Market is entering a steady expansion phase as governments, industrial operators, transportation authorities, construction companies, and smart-city developers increase investment in continuous acoustic measurement and environmental compliance. Based on a synthesis of recent market estimates, the global Noise Monitoring Market was approximately USD 0.8-0.9 billion in 2025 and is projected to reach around USD 1.3-1.5 billion by 2035, representing an estimated 5-6% CAGR over the forecast period. Published estimates differ depending on whether environmental systems, occupational monitoring, services, or broader noise-detection equipment are included in the market definition.
Growth is being supported by urbanization, stricter noise regulations, expanding transportation infrastructure, industrial activity, construction, and rising awareness of occupational and community noise exposure. At the technology level, AI, IoT, cloud computing, edge analytics, and automation are transforming conventional noise measurement into connected, real-time monitoring networks. Modern systems can continuously collect sound-level data, identify abnormal acoustic events, transmit alerts remotely, and provide historical analytics for regulatory reporting and operational decision-making. This shift is increasing the strategic importance of Noise Monitoring Market solutions across smart cities, airports, manufacturing facilities, highways, construction sites, and residential environments.
Key Market Trends & Insights
North America remains a leading regional market, supported by mature environmental regulations, occupational safety requirements, advanced infrastructure, and widespread adoption of digital monitoring systems. Workplace noise-monitoring requirements and the use of personal dosimeters and sound-level meters provide a significant commercial base. For example, occupational noise programs in the United States use personal monitoring where workers are mobile or exposure levels fluctuate substantially.
Asia Pacific is expected to be the fastest-growing region during the forecast period. Rapid urbanization, infrastructure development, industrialization, transportation expansion, and smart-city programs are increasing the requirement for continuous acoustic measurement. Cities are increasingly moving from occasional manual measurements toward fixed and connected monitoring stations.
The environmental and permanent monitoring segment represents a major growth area because municipalities, airports, infrastructure operators, and industrial facilities increasingly require long-term measurement rather than one-time surveys. IoT connectivity enables these installations to send data to centralized platforms, improving visibility across geographically distributed monitoring locations.
Another important trend is the integration of AI-powered acoustic analytics. Instead of treating every sound event simply as a decibel measurement, intelligent systems can classify sound sources, detect anomalies, identify recurring patterns, and potentially distinguish traffic, construction, machinery, alarms, or other acoustic events. Research into IoT-based urban sound systems demonstrates the growing potential of combining edge devices, sound classification, cloud analytics, and real-time data visualization.
Automation is also reshaping noise management. Remote calibration checks, automated alarms, continuous data logging, cloud dashboards, and machine-learning-based event detection reduce the need for constant manual intervention. This supports scalable monitoring networks across large industrial sites and urban areas.
Market Size & Forecast
- Base year market size: Approximately USD 0.8-0.9 billion in 2025, depending on market scope and inclusion of environmental, occupational, hardware, software, and service categories.
- Forecast value by 2035: Approximately USD 1.3-1.5 billion, supported by expanding continuous-monitoring deployments and connected acoustic infrastructure.
- CAGR: Approximately 5-6% through 2035, broadly consistent with recent published forecasts for noise monitoring and noise-monitoring devices.
- Growth factors: Urbanization, industrial automation, regulatory enforcement, smart-city investments, IoT connectivity, cloud analytics, AI-based sound classification, transportation infrastructure, and workplace safety requirements will remain key growth factors.
Noise Monitoring Market Top 10 key takeaway
- The global Noise Monitoring Market was approximately USD 0.8-0.9 billion in 2025.
- The market is expected to reach approximately USD 1.3-1.5 billion by 2035.
- The market is projected to expand at roughly 5-6% CAGR through the forecast period.
- North America remains a leading regional market due to regulatory and occupational safety requirements.
- Asia Pacific is positioned as the fastest-growing regional market.
- Fixed and permanent monitoring systems are gaining importance in smart-city and infrastructure projects.
- IoT connectivity is shifting noise measurement from periodic surveys toward continuous monitoring.
- AI is enabling acoustic event classification, anomaly detection, and predictive noise analytics.
- Construction, industrial facilities, transportation, and urban environments represent major application opportunities.
- Cloud platforms and automated monitoring are improving scalability, remote management, and regulatory reporting.
Product Insights
The fixed or permanent noise monitoring system segment represents one of the most strategically important product categories in the Noise Monitoring Market. These systems are designed for continuous environmental measurement and are increasingly deployed around airports, highways, industrial facilities, construction projects, entertainment districts, and densely populated urban areas. Their ability to collect measurements continuously provides a more complete picture of acoustic conditions than periodic manual surveys.
Permanent monitoring stations increasingly combine Class 1 sound-level measurement, weather-resistant enclosures, GPS synchronization, cellular connectivity, data logging, alarms, and remote management. For example, SVANTEK offers monitoring stations with MEMS microphones, 4G connectivity, GPS, real-time data transfer, remote alarms, and cloud-based management. Its SV 307A combines continuous environmental monitoring with automated system checks and remote data access.
Portable sound-level meters and personal noise dosimeters remain essential in occupational safety and environmental surveys. Personal dosimeters are particularly important when workers move between locations or experience variable exposure levels. Advanced systems calculate time-weighted averages and accumulated noise dose, supporting workplace hearing-conservation programs.
Emerging product categories include IoT-enabled acoustic sensors, compact MEMS-based monitoring stations, wearable exposure monitors, remote kiosks, and AI-enabled acoustic gateways. The direction of product development is increasingly toward smaller sensors, longer battery life, wireless connectivity, automated diagnostics, and software-defined analytics.
Technology / Component Insights
The technology architecture of the Noise Monitoring Market is evolving from standalone measurement instruments toward integrated sensing, communications, computing, and analytics platforms. Core components include microphones, sound-level meters, acoustic sensors, signal-processing units, data loggers, wireless communication modules, GPS systems, edge processors, cloud software, and visualization platforms.
IoT is one of the most influential technologies because it allows distributed noise sensors to communicate with centralized platforms. Cellular, Wi-Fi, Ethernet, and other connectivity technologies enable monitoring stations to transfer data continuously rather than requiring technicians to retrieve measurement devices manually. This is particularly valuable for large cities, construction projects, rail corridors, and industrial sites.
Cloud computing adds another layer of scalability. Data from multiple monitoring stations can be aggregated into a single dashboard, allowing operators to compare locations, identify trends, configure alarms, and produce reports. SvanNET by SVANTEK, for example, provides remote management, real-time data visualization, multi-point connections, alarms, and secure data access for noise and vibration monitoring stations.
AI is becoming increasingly relevant because raw decibel levels do not always explain the source or significance of an acoustic event. Machine-learning models can analyze frequency, temporal, and spectral characteristics to classify sound sources and detect unusual events. Research using mobile IoT noise-monitoring nodes has demonstrated the application of machine-learning models for calibration and real-world urban acoustic monitoring.
Future innovation is likely to center on edge AI, automated source localization, predictive analytics, low-power wireless sensors, digital twins for urban infrastructure, and integration with broader environmental monitoring systems. Noise data may increasingly be combined with traffic, weather, air-quality, building, and industrial IoT information to create more comprehensive environmental intelligence.
Application Insights
The environmental and urban noise monitoring segment represents a major application area within the Noise Monitoring Market. Urban authorities increasingly need continuous information on traffic noise, construction activity, commercial activity, public events, and other sources of community noise. Permanent monitoring networks can help identify hotspots and support evidence-based decisions on zoning, traffic management, infrastructure planning, and enforcement.
Transportation is another important application. Airports, railways, highways, ports, and logistics facilities generate substantial acoustic activity and frequently operate near residential areas. Continuous monitoring can help operators understand changes in noise levels and evaluate mitigation measures.
The construction sector provides a growing opportunity because large infrastructure projects can create temporary but significant noise exposure. IoT-connected monitoring stations can provide project managers and authorities with real-time alerts when predetermined thresholds are exceeded. This creates a more transparent approach to community relations and environmental compliance.
Industrial applications also remain significant. Manufacturing plants, mining operations, power facilities, and processing sites require noise assessment for both worker protection and surrounding communities. As factories become more automated, noise monitoring can become part of broader industrial IoT platforms, where acoustic anomalies may also provide indications of equipment degradation.
Future opportunities will increasingly emerge from smart-city infrastructure, AI-based sound classification, automated enforcement systems, connected buildings, and integrated environmental monitoring networks.
Regional Insights
North America currently maintains a leading position in the Noise Monitoring Market because of established workplace-safety frameworks, environmental regulations, infrastructure investment, and high adoption of advanced measurement technologies. The region also benefits from mature industrial and transportation ecosystems that require reliable noise assessment. In the United States, occupational monitoring practices distinguish between area monitoring and personal monitoring depending on worker mobility and variability in noise exposure.
Europe represents another significant market, supported by environmental policy, urban planning, transportation infrastructure, industrial safety, and growing interest in healthier urban environments. European cities are increasingly integrating environmental sensors into broader smart-city architectures, creating opportunities for connected acoustic networks.
Asia Pacific is expected to experience the fastest growth. Rapid urbanization and infrastructure expansion are increasing exposure to road traffic, construction, industrial, and community noise. Governments and municipalities are investing in environmental monitoring capabilities, while local technology ecosystems are reducing the cost of deploying connected sensor networks.
The combination of IoT, mobile connectivity, and low-cost sensing is particularly important in emerging Asian markets. Research involving real-time mobile noise-monitoring systems in Hyderabad, India, illustrates how distributed IoT nodes can collect large volumes of geotagged acoustic data for urban analysis.
- North America: Leading market supported by mature regulatory and occupational monitoring requirements.
- Europe: Strong environmental governance and smart-city adoption support sustained demand.
- Asia Pacific: Fastest-growing region due to urbanization, infrastructure, and industrial expansion.
- Urban infrastructure: Traffic, construction, and public-space monitoring are increasing demand for permanent systems.
- Digitalization: IoT and cloud connectivity are accelerating deployment of distributed monitoring networks.
Country-Specific Market Trends
In Asia Pacific, China is estimated to record approximately 6-7% CAGR, while Japan is expected to grow at around 4-5% CAGR through 2035. China's large urban population, transportation infrastructure, industrial activity, and smart-city investments are creating significant demand for continuous environmental monitoring. Local governments and infrastructure operators are increasingly interested in real-time data rather than periodic measurements. Japan's market is more mature, with demand concentrated in industrial facilities, transportation, construction, environmental management, and advanced acoustic measurement.
In North America, the United States is estimated to grow at approximately 5-6% CAGR, Canada at around 4-5%, and Mexico at approximately 5-6%. The United States benefits from strong occupational safety requirements, infrastructure projects, industrial activity, and technology adoption. Canada offers opportunities in mining, transportation, construction, and municipal environmental management. Mexico's manufacturing, automotive, logistics, and infrastructure expansion provides additional demand.
In Europe, Germany is estimated to grow at approximately 4-5% CAGR, while France is expected to expand at around 4-5%. Germany's industrial and automotive sectors create demand for workplace and environmental acoustic measurement, while France benefits from transportation, infrastructure, urban planning, and environmental-monitoring initiatives. Across Europe, digital environmental management and smart-city development are supporting the transition toward connected noise monitoring.
These country-level growth rates are directional analyst estimates designed to reflect relative adoption patterns rather than precise company or government forecasts.
- China: Smart-city investment, infrastructure expansion, and industrialization support strong demand.
- Japan: Mature industrial and transportation applications sustain technology adoption.
- United States: Workplace safety, infrastructure, and environmental compliance remain major drivers.
- Germany: Industrial automation and automotive manufacturing support acoustic monitoring requirements.
- France: Transportation, urban infrastructure, and environmental management create growth opportunities.
Key Noise Monitoring Market Company Insights
The competitive landscape includes established measurement and instrumentation companies such as Brüel & Kjær, 3M, SVANTEK, Cirrus Research, RION, ACOEM, Casella, NTi Audio, Pulsar Instruments, and Norsonic. Recent market research identifies many of these companies among the principal participants in noise detection, monitoring, and noise-monitoring devices.
Competitive strategies are shifting toward connected hardware, cloud platforms, remote diagnostics, and automated analytics. SVANTEK has emphasized Class 1 permanent monitoring stations with MEMS technology, 4G communication, GPS, remote alarms, and cloud management. Cirrus Research provides long-duration data-logging capabilities for noise measurements, allowing users to program recording intervals and analyze accumulated acoustic information.
3M's noise measurement portfolio covers sound-level meters, personal noise dosimeters, and measurement solutions supporting occupational hearing-conservation programs. Meanwhile, the broader competitive environment is increasingly focused on integrating AI, wireless connectivity, automation, and software analytics into established measurement platforms.
- SVANTEK: Focuses on connected Class 1 monitoring stations, MEMS technology, cloud management, and remote diagnostics.
- 3M: Maintains a strong position in occupational noise measurement and personal exposure monitoring.
- Brüel & Kjær: Emphasizes high-performance sound and vibration measurement for professional applications.
- Cirrus Research: Focuses on sound-level measurement, data logging, environmental monitoring, and workplace applications.
- RION and other specialists: Compete through precision instrumentation, portable measurement systems, and specialized acoustic applications.
Recent Developments
In 2024, SVANTEK introduced the SV 303 urban noise monitoring terminal, designed for smart-city applications and Class 1 measurement. The system was developed for real-time urban noise assessment and integration with existing monitoring infrastructure, reflecting the industry's movement toward networked municipal acoustic management.
More recently, SVANTEK's advanced monitoring portfolio has emphasized MEMS-based Class 1 measurement, 4G connectivity, GPS synchronization, remote system checks, and real-time data access. The SV 307A demonstrates how permanent monitoring systems are increasingly being designed as connected, automated platforms rather than standalone sound-level meters.
AI and machine-learning integration is also advancing beyond simple measurement. Recent research has demonstrated machine-learning-assisted calibration and classification for IoT-based mobile noise-monitoring systems, indicating a future in which acoustic networks can automatically interpret large volumes of environmental sound data.
Market Segmentation
The Noise Monitoring Market can be segmented By Product into fixed or permanent monitoring systems, portable sound-level meters, personal noise dosimeters, remote monitoring terminals, and related accessories. By Technology / Component, the market includes microphones and acoustic sensors, sound-level meters, data loggers, wireless connectivity, IoT gateways, cloud analytics, AI-powered software, and integrated monitoring platforms. By Application, important categories include environmental monitoring, construction, industrial facilities, transportation, airports, residential and commercial areas, healthcare, and occupational safety. By Region, the market encompasses North America, Europe, Asia Pacific, Latin America, and the Middle East & Africa, with North America maintaining a strong current position and Asia Pacific offering the highest growth potential. Recent market research similarly segments the industry by components, product type, technology, application, and geography.
- By Product: Fixed monitoring systems and portable measurement devices remain important product categories.
- By Technology / Component: IoT connectivity, cloud analytics, MEMS microphones, and AI are gaining strategic importance.
- By Application: Environmental, industrial, construction, transportation, and occupational monitoring represent major demand centers.
- By Region: North America leads, while Asia Pacific is expected to grow at the fastest rate.
- Emerging segment: AI-enabled, cloud-connected, and automated acoustic monitoring platforms are creating new value opportunities.
Conclusion
The global Noise Monitoring Market is expected to maintain steady expansion through 2035, with market value potentially increasing from approximately USD 0.8-0.9 billion in 2025 to USD 1.3-1.5 billion by 2035. A projected growth rate of approximately 5-6% CAGR reflects the structural need for more accurate, continuous, connected, and automated acoustic measurement.
AI will be particularly important in the next phase of market development. Traditional noise monitoring primarily answers the question of how loud an environment is, whereas AI-enabled systems can increasingly help determine what caused the noise, when it occurred, whether it is unusual, and how it may evolve. This creates opportunities for predictive analytics, automated event classification, acoustic source localization, and intelligent alerts.
IoT and cloud platforms will further expand the addressable market by making large-scale monitoring networks easier to deploy and manage. Instead of isolated meters, municipalities and enterprises can operate interconnected networks that deliver real-time information through centralized dashboards. Automation will reduce manual data collection and improve the consistency of regulatory reporting and operational response.
For businesses, the Noise Monitoring Market therefore represents an important intersection of environmental compliance, occupational safety, smart infrastructure, and digital transformation. Companies that combine measurement accuracy with wireless connectivity, AI analytics, cybersecurity, remote management, and low-maintenance hardware are likely to gain a competitive advantage as organizations move toward continuous environmental intelligence.
FAQs
1. What is the market size of the Noise Monitoring Market?
The global Noise Monitoring Market is estimated at approximately USD 0.8-0.9 billion in 2025, depending on the scope used for environmental, occupational, hardware, software, and service categories. Published estimates place the market in a broadly similar range.
2. What is the expected growth rate of the Noise Monitoring Market?
The Noise Monitoring Market is expected to grow at approximately 5-6% CAGR through 2035. Growth will be supported by environmental regulation, urbanization, industrial activity, smart-city programs, IoT deployment, and demand for continuous monitoring.
3. What are the key drivers of the Noise Monitoring Market?
Key drivers include stricter noise regulations, urbanization, transportation and construction activity, workplace safety requirements, industrial expansion, smart-city development, IoT connectivity, cloud analytics, AI-based acoustic classification, and automation of environmental monitoring.
4. Which region leads the Noise Monitoring Market?
North America is currently a leading regional market, supported by established occupational and environmental monitoring practices, advanced infrastructure, and technology adoption. Asia Pacific is expected to register the fastest growth through 2035 because of rapid urbanization, infrastructure development, industrialization, and smart-city investment.
5. Who are the key companies in the Noise Monitoring Market?
Major participants include Brüel & Kjær, 3M, SVANTEK, Cirrus Research, RION, ACOEM, Casella, NTi Audio, Pulsar Instruments, and Norsonic. Competitive strategies increasingly emphasize connected measurement devices, AI-assisted analytics, cloud platforms, remote monitoring, automated diagnostics, and specialized environmental and occupational applications.
To speak to our analyst for a discussion on the above findings, click Speak to Analyst
 Exclusive indicates content/data unique to MarketsandMarkets and not available with any competitors.
Table of Contents
1 Introduction (Page No. - 15)
1.1 Objectives of the Study
1.2 Market Definition
1.3 Study Scope
1.3.1 Markets Covered
1.3.2 Geographic Scope
1.3.3 Years Considered for the Study
1.4 Currency
1.5 Limitations
1.6 Stakeholders
2 Research Methodology (Page No. - 18)
2.1 Research Data
2.1.1 Secondary Data
2.1.1.1 Key Data From Secondary Sources
2.1.2 Primary Data
2.1.2.1 Key Data From Primary Sources
2.1.2.2 Key Industry Insights
2.1.2.3 Breakdown of Primaries
2.2 Market Size Estimation
2.2.1 Bottom-Up Approach
2.2.2 Top-Down Approach
2.2.3 Market Share Estimation
2.3 Market Breakdown and Data Triangulation
2.4 Research Assumptions
3 Executive Summary (Page No. - 27)
4 Premium Insights (Page No. - 33)
4.1 Attractive Market Opportunities in the Overall Noise Monitoring Market
4.2 Market, By Connectivity
4.3 Market, By Application in Europe
4.4 Region Analysis of the Market
4.5 Market, By Region
4.6 Market, By Precision Type
5 Market Overview (Page No. - 37)
5.1 Introduction
5.2 Market Dynamics
5.2.1 Drivers
5.2.1.1 Occupational Hearing Impairment
5.2.1.2 Stringent Government Policies Awareness for Reducing Noise Pollution in Urban Areas
5.2.1.3 Increase in Government Funding for Noise Monitoring and Control
5.2.1.4 Noise Monitoring Systems to Optimize Profit and Capacity on Airports
5.2.1.5 Government Authorities’ and Consultants’ Need for Data Accessibility
5.2.1.6 Rising Installation of All in One Environmental Monitoring Solutions
5.2.1.7 High Requirement for Noise Monitoring Infrastructure in Mining, Wind Plant, Petrochemical Industry, and Harbor
5.2.2 Restraints
5.2.2.1 Interoperability of the File Formats Between Equipment and Analysis Software
5.2.2.2 Distance of the Noise Monitoring Device From the Source
5.2.2.3 Lenient Approach of the Local Authorities in Developing Countries
5.2.2.4 Several Implementations Prove to Be Very Costly
5.2.3 Opportunities
5.2.3.1 Lucrative Opportunities in Smart Cities
5.2.3.2 Integrating Cloud-Based System for Remote Monitoring
5.2.3.3 Increasing Need for Noise Monitoring for Rail Transit, Marine, Gunshot, and Race Track Monitoring
5.2.3.4 Data as A Service
5.2.4 Challenges
5.2.4.1 Monitoring of the Underwater Noise Pollution
5.2.4.2 Data Security Issues on Cloud
5.2.4.3 Emerging Mobile-Based Apps for Noise Detection and Monitoring
6 Noise Monitoring Market, By Sampling Method (Page No. - 44)
6.1 Introduction
6.2 Short-Term Monitoring
6.3 Long-Term Monitoring
6.4 Permanent Monitoring
7 Noise Monitoring System Market, By Precision Type (Page No. - 48)
7.1 Introduction
7.2 Class 1 Standard Devices
7.3 Class 2 Standard Devices
8 Noise Monitoring Market, By Connectivity (Page No. - 53)
8.1 Introduction
8.2 Wi-Fi
8.3 Cellular
8.4 Ethernet
8.5 USB Cable
9 Noise Monitoring Market, By Solution (Page No. - 58)
9.1 Introduction
9.2 Hardware
9.2.1 Fixed Monitors
9.2.2 Portable Monitors
9.3 Software
9.4 Services
10 Noise Monitoring Market, By Application (Page No. - 66)
10.1 Introduction
10.2 Noise Monitoring in Airports
10.3 Noise Monitoring in Hospitals
10.4 Noise Monitoring in Residential Areas
10.5 Noise Monitoring of Road Traffic
10.6 Noise Monitoring in Railways
10.7 Noise Monitoring in Industries
10.8 Noise Monitoring in Construction Sites
10.9 Noise Monitoring in Recreational Areas
10.10 Noise Monitoring in Other Applications
11 Noise Monitoring Market By Geography (Page No. - 88)
11.1 Introduction
11.2 Americas
11.2.1 US
11.2.2 Canada
11.2.3 Mexico
11.3 Europe
11.3.1 UK
11.3.2 Germany
11.3.3 France
11.3.4 Rest of Europe
11.4 Asia Pacific (APAC)
11.4.1 China
11.4.2 Japan
11.4.3 India
11.4.4 Rest of APAC
11.5 Rest of the World (RoW)
11.5.1 Middle East
11.5.2 Africa
12 Competitive Landscape (Page No. - 100)
12.1 Overview
12.2 Market Rank Analysis
12.3 Competitive Leadership Mapping
12.3.1 Visionary Leaders
12.3.2 Dynamic Differentiators
12.3.3 Innovators
12.3.4 Emerging Companies
12.4 Competitive Benchmarking
12.4.1 Business Strategy Excellence (25 Companies)
12.4.2 Strenghth of Product Portfolio (25 Companies)
*Top 25 Companies Analyzed for This Study are - Brüel & Kjær, Extech Instruments (Flir Systems Inc), Cirrus Research PLC, 3M, Larson Davis (PCB Piezotronics, Inc.), PCE Holding GmbH, 01db (Acoem Group), Pulsar Instruments PLC, Sinus Messtechnik GmbH, Svantek, Cesva Instruments SLU, Testo Se & Co. KGaA, Casella Inc., Norsonic, Rion Co., Ltd., Nti-Audio, Delta Ohm, Castle Group Ltd., Ono Soki Co.Ltd., SKF Group, Kimo Instrument, Libelium Comunicaciones Distribuidas, B&K Precision Corporation, Exair Co. and Ht Instruments
12.5 Competitive Scenario
12.5.1 Product Launches
12.5.2 Acquisitions, Expansions, and Agreements
13 Company Profiles (Page No. - 109)
13.1 Introduction
(Business Overview, Solutions Offered, Strength of Product Portfolio, Business Strategy Excellence, Recent Developments and Key Relationships)*
13.2 Bruel & Kjaer (Spectris PLC)
13.3 Extech Instruments (Flir Systems)
13.4 Cirrus Research PLC
13.5 3M
13.6 Larson Davis (PCB Piezotronics, Inc.)
13.7 PCE Instruments
13.8 01db (Acoem Group)
13.9 Pulsar Instruments
13.10 Sinus Messtechnik GmbH
13.11 Cesva Instruments SLU
13.12 Testo Se & Co. KGaA
13.13 Svantek
13.14 SKF
13.15 Rion Co. Ltd.
13.16 Casella Cel
13.17 Norsonic as
*Details on Business Overview, Solutions Offered, Strength of Product Portfolio, Business Strategy Excellence, Recent Developments and Key Relationships Might Not Be Captured in Case of Unlisted Companies.
14 Appendix (Page No. - 160)
14.1 Insights of Industry Experts
14.2 Discussion Guide
14.3 Knowledge Store: Marketsandmarkets’ Subscription Portal
14.4 Introducing RT: Real-Time Market Intelligence
14.5 Available Customizations
14.6 Related Reports
14.7 Author Details
List of Tables (63 Tables)
Table 1 Noise Monitoring Market, By Sampling Method, 2015–2023 (USD Million)
Table 2 Market for Short-Term Monitoring, By Precision Type, 2015–2023 (USD Million)
Table 3 Market for Long-Term Monitoring, By Precision Type, 2015–2023 (USD Million)
Table 4 Market for Permanent Monitoring, By Precision Type, 2015–2023 (USD Million)
Table 5 Precision Type Comparative Analysis
Table 6 Market, By Precision Type, 2015–2023 (USD Million)
Table 7 Market, By Precision Type, 2015–2023 (Thousand Units)
Table 8 Market for Class 1 Precision Type, By Monitoring Type, 2015–2023 (USD Million)
Table 9 Market for Class 1 Precision Type, By Monitoring Type, 2015–2023 (Thousand Units)
Table 10 Market for Class 2 Precision Type, By Monitoring Type, 2015–2023 (USD Million)
Table 11 Market for Class 2 Precision Type, By Monitoring Type, 2015–2023 (Thousand Units)
Table 12 Market, By Connectivity, 2015–2023 (USD Million)
Table 13 Market for Wi-Fi Connectivity, By Mounting Type, 2015–2023 (USD Million)
Table 14 Market for Cellular Connectivity, By Mounting Type, 2015–2023 (USD Million)
Table 15 Market for Ethernet Connectivity, By Mounting Type, 2015–2023 (USD Million)
Table 16 Market for USB Cable Connectivity, By Mounting Type, 2015–2023 (USD Million)
Table 17 Market, By Solution, 2015–2023 (USD Million)
Table 18 Noise Monitoring Hardware Market, By Mounting Type, 2015–2023 (USD Million)
Table 19 Noise Monitoring Hardware Market, By Mounting Type, 2015–2023 (Thousand Units)
Table 20 Noise Monitoring Hardware Market, By Application, 2015–2023 (USD Million)
Table 21 Noise Monitoring Hardware Market, By Region, 2015–2023 (USD Million)
Table 22 Noise Monitoring Software Market, By Application, 2015–2023 (USD Million)
Table 23 Noise Monitoring Software Market, By Region, 2015–2023 (USD Million)
Table 24 Noise Monitoring Service Market, By Application, 2015–2023 (USD Million)
Table 25 Noise Monitoring Service Market, By Region, 2015–2023 (USD Million)
Table 26 Market, By Application, 2015–2023 (USD Million)
Table 27 Market, By Application, 2015–2023 (Thousand Units)
Table 28 Noise Monitoring in Airports, By Solution, 2015–2023 (USD Million)
Table 29 Noise Monitoring in Airports, By Region, 2015–2023 (USD Million)
Table 30 Noise Monitoring in Airports, By Region, 2015–2023 (Thousand Units)
Table 31 Market for Hospitals, By Solution, 2015–2023 (USD Million)
Table 32 Market for Hospitals, By Region, 2015–2023 (USD Million)
Table 33 Market for Hospitals, By Region, 2015–2023 (Thousand Units)
Table 34 Market of Noise Monitoring at Residential Areas, By Solution, 2015–2023 (USD Million)
Table 35 Market for Residential Areas, By Region, 2015–2023 (USD Million)
Table 36 Market for Residential Areas, By Region, 2015–2023 (Thousand Units)
Table 37 Market for Road Traffic, By Solution, 2015–2023 (USD Million)
Table 38 Market for Road Traffic, By Region, 2015–2023 (USD Million)
Table 39 Market for Road Traffic, By Region, 2015–2023 (Thousand Units)
Table 40 Market for Railways, By Solution, 2015–2023 (USD Million)
Table 41 Market for Railways, By Region, 2015–2023 (USD Million)
Table 42 Market for Railways, By Region, 2015–2023 (Thousand Units)
Table 43 Market for Industries, By Solution, 2015–2023 (USD Million)
Table 44 Market for Industries, By Region, 2015–2023 (USD Million)
Table 45 Market for Industries, By Region, 2015–2023 (Thousand Units)
Table 46 Market for Construction Sites, By Solution, 2015–2023 (USD Million)
Table 47 Market for Construction Sites, By Region, 2015–2023 (USD Million)
Table 48 Market for Construction Sites, By Region, 2015–2023 (Thousand Units)
Table 49 Market for Recreational Areas, By Solution, 2015–2023 (USD Million)
Table 50 Market for Recreational Areas, By Region, 2015–2023 (USD Million)
Table 51 Market for Recreational Areas, By Region, 2015–2023 (Thousand Units)
Table 52 Market for Other Applications, By Solution, 2015–2023 (USD Million)
Table 53 Market for Other Applications, By Region, 2015–2023 (USD Million)
Table 54 Market for Other Applications, By Region, 2015–2023 (Thousand Units)
Table 55 Market Size, By Region, 2015–2023 (USD Million)
Table 56 Market, By Region, 2015–2023 (Thousand Units)
Table 57 Market in the Americas, By Country, 2015–2023 (USD Million)
Table 58 Market in Europe, By Country, 2015–2023 (USD Million)
Table 59 Market in APAC, By Country, 2015–2023 (USD Million)
Table 60 Market in RoW, By Country, 2015–2023 (USD Million)
Table 61 Top 5 Players in the Noise Monitoring Market, 2016
Table 62 10 Most Recent Product Launches in the Noise Monitoring Market
Table 63 5 Most Recent Acquisitions, Expansions, and Agreements in the Noise Monitoring Market
List of Figures (46 Figures)
Figure 1 Noise Monitoring Market Segmentation
Figure 2 Noise Monitoring Market: Research Design
Figure 3 Research Flow of Market Size Estimation
Figure 4 Market Size Estimation Methodology: Bottom-Up Approach
Figure 5 Market Size Estimation Methodology: Top-Down Approach
Figure 6 Data Triangulation
Figure 7 Assumptions of the Research Study
Figure 8 Permanent Noise Monitoring Market is Expected to Hold the Largest Market Compared to All Other Sampling Methods By 2023
Figure 9 Noise Monitoring Market in Industries to Hold the Largest Market During the Forecast Period
Figure 10 Class 1 Devices Expected to Grow at the Highest Rate During the Forecast Period
Figure 11 Cellular Connectivity for the Market Expected to Grow at the Highest Rate During the Forecast Period
Figure 12 Noise Monitoring Service Market Expected to Grow at the Highest Rate During the Forecast Period
Figure 13 Europe Likely to Be the Fastest-Growing Region in the Market During the Forecast Period
Figure 14 Rising Installation of All-In-One Environmental Monitoring Solutions and Need of Data Accessibility By Government Authorities and Consultants to Increase the Demand for Noise Monitoring During the Forecast Periodi
Figure 15 USB Cables to Hold the Largest Size of the Market By 2023
Figure 16 Noise Monitoring in Industries to Hold the Largest Share of the Market in Europe By 2023
Figure 17 Market in Europe to Grow at the Highest Rate Between 2017 and 2023
Figure 18 Market in Europe Expected to Grow at the Highest Rate During the Forecast Period
Figure 19 Market for Class 1 to Hold the Largest Size By 2023
Figure 20 Permanent Monitoring Sampling Method Expected to Hold the Largest Market Between 2017 and 2023
Figure 21 Class 1 Expected to Grow at the Highest Rate During the Forecast Period
Figure 22 Cellular Connectivity to Be the Fastest-Growing Market for Noise Monitoring During the Forecast Period
Figure 23 Noise Monitoring Service Market Expected to Grow at the Highest Rate During the Forecast Period
Figure 24 Noise Monitoring Application in Industries to Witness the Highest Growth in the Market During the Forecast Period
Figure 25 Noise Monitoring in Airports, By Solution, 2017 vs 2023 (USD Million)
Figure 26 Market for Hospitals, By Solution, 2017 vs 2023 (USD Million)
Figure 27 Market for Residential Areas, By Solution, 2017 vs 2023 (USD Million)
Figure 28 Market for Road Traffic, By Solution, 2017 vs 2023 (USD Million)
Figure 29 Market for Railways, By Solution, 2017 vs 2023 (USD Million)
Figure 30 Market for Industries, By Solution, 2017 vs 2023 (USD Million)
Figure 31 Market for Construction Sites, By Solution, 2017 vs 2023 (USD Million)
Figure 32 Market for Recreational Areas, By Solution, 2017 vs 2023 (USD Million)
Figure 33 Market for Other Applications, By Solution, 2017 vs 2023 (USD Million)
Figure 34 Market, By Region, 2017 vs 2023 (USD Million)
Figure 35 Geographic Snapshot for Noise Monitoring Market (2017–2023)
Figure 36 Snapshot of Noise Monitoring Market in the Americas
Figure 37 Snapshot of Noise Monitoring Market in Europe
Figure 38 Snapshot of Noise Monitoring Market in APAC
Figure 39 Snapshot of Noise Monitoring Market in RoW
Figure 40 Companies Adopted Product Developments as the Key Growth Strategy Between January 2014 and March 2017
Figure 41 Noise Monitoring Market Evaluation Framework
Figure 42 Battle for the Market Share
Figure 43 Bruel & Kjaer: Company Snapshot
Figure 44 Extech Instruments: Company Snapshot
Figure 45 3M: Company Snapshot
Figure 46 SKF: Company Snapshot
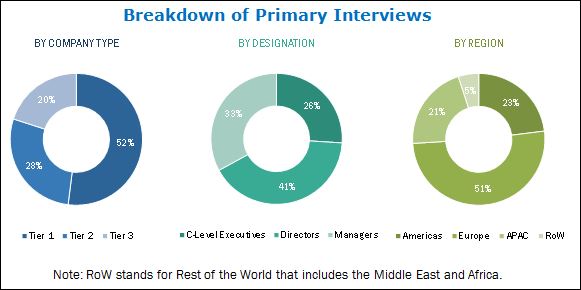
This research study involves the extensive use of secondary sources (Journal of Sound and Vibration, The Association of Noise Consultants, and Institute of Noise Control Engineering (INCE)), directories, and databases (such as annual reports, press releases, journals, company websites, and paid databases) to identify and collect information useful for this study. The entire procedure includes the study of the financial reports of the top market players. After arriving at the overall market size, the total noise monitoring market has been split into several segments and subsegments and confirmed with the key industry experts such as CEOs, VPs, directors, and marketing executives. The figure below shows the breakdown of primaries on the basis of the company type and designation conducted during the research.
To know about the assumptions considered for the study, download the pdf brochure
The noise monitoring market comprises business entities such as Svantek (Poland), RION Co. Ltd. (Japan), Bruel & Kjaer (Denmark), Cirrus Research Plc (UK), Extech Instruments (US), Pulsar Instruments (UK), 3M (US), Nti-Audio (Liechtenstein), Castle Group Ltd. (UK), SKF Group (Sweden), Kimo Instrument (Japan), B&K Precision Corporation (US), HT Instruments (Germany), 01dB (ACOEM Group) (France), SINUS Messtechnik GmbH (Germany), CESVA INSTRUMENTS SLU (Spain), Testo SE & Co. KGaA (Germany), and Casella Inc. (US).
The Target Audience:
- Raw material and manufacturing equipment suppliers
- Component manufacturers
- Original equipment manufacturers (OEMs)
- Original design manufacturers (ODMs)
- Technology, service, and solution providers
- Suppliers and distributors
- System Integrators
- Technology investors
- Research institutes and organizations
- Market research and consulting firms
The market in this report has been segmented as follows:
Noise Monitoring Market By Sampling Method:
- Short–term Monitoring
- Long–term Monitoring
- Permanent Monitoring
Noise Monitoring Market By Precision Type:
- Class 1
- Class 2
Noise Monitoring Market By Connectivity:
- Wi-Fi
- Cellular
- Ethernet
- USB Cable
Noise Monitoring Market By Solution:
- Hardware
- Software
- Service
Noise Monitoring Market By Application:
- Noise Monitoring in Airports
- Noise Monitoring in Hospitals
- Noise Monitoring in Residential Areas
- Noise Monitoring of Road Traffic
- Noise Monitoring in Railways
- Noise Monitoring in Industries
- Noise Monitoring in Construction Sites
- Noise Monitoring in Recreational Areas
- Noise Monitoring in Other Applications
Noise Monitoring Market By Geography
-
Americas
- US
- Canada
- Mexico
- Rest of America
-
Europe
- Germany
- UK
- France
- Rest of Europe
-
Asia Pacific (APAC)
- China
- Japan
- India
- Rest of APAC
-
Rest of the World
- Middle East
- Africa
Available Customizations:
With the given market data, MarketsandMarkets offers customizations according to the company’s specific needs. The following customization options are available for the report:
Geographic Information
- Further breakdown of the geography segment country by application and solution
Company Information
- Detailed analysis and profiling of additional market players on the basis of various blocks of the value chain













Growth opportunities and latent adjacency in Noise Monitoring Market