
Occupancy Sensor Market Size, Share & Analysis

Occupancy Sensor Market by Type (Wall Mount, Ceiling Mount, Desk), Operation (Indoor, Outdoor), Connectivity (Wireless, ZigBee, Z-wave), Technology (Passive Infrared, Ultrasonic, Dual Technology, Image Processing), Installation - Global Forecast to 2030


OCCUPANCY SENSOR MARKET OVERVIEW
The occupancy sensor market is projected to reach USD 5.20 billion by 2030 from USD 2.75 billion in 2024, at a CAGR of 11.2% from 2024 to 2030. Occupancy sensor demand is growing due to the rising need for energy-efficient buildings that automatically control lighting, HVAC, and security systems. Additionally, smart home adoption and stringent building energy regulations are accelerating the integration of advanced sensing technologies.
OCCUPANCY SENSOR MARKET KEY TAKEAWAYS
-
By RegionThe North America in occupancy sensor Market market dominated with a share of 38.2% in 2023.
-
By OperationBy operation, the outdoor segment is expected to register the highest CAGR of 14.3%.
-
By Installation TypeBy installation type, the new segment is projected to grow at the fastest rate from 2024 to 2030.
-
By TechnologyBy technology, the PIR segment is expected to dominate the market.
-
By End UserBy end user, the commercial building segment will grow the fastest during the forecast period.
-
Competitive LandscapeLegrand, Johnson Controls, Eaton, Honeywell, Acuity Brands, and Leviton Manufacturing were identified as some of the star players in the ocupancy sensor market (global), given their strong market share and product footprint.
-
Competitive LandscapeEnerlits Inc., Avuity, Butlr,XY Sense and Density among others, have distinguished themselves among startups and SMEs by securing strong footholds in specialized niche areas, underscoring their potential as emerging market leaders
Occupancy sensors market are witnessing steady growth driven by the increasing focus on energy efficiency and automated building management systems. Growing adoption of smart homes, IoT-enabled devices, and stricter building energy codes further accelerates their demand across residential, commercial, and industrial spaces.

Source: Secondary Research, Interviews with Experts, MarketsandMarkets Analysis
TRENDS & DISRUPTIONS IMPACTING CUSTOMERS' CUSTOMERS
The occupancy sensor industry is evolving rapidly as buildings become smarter and more connected. IoT-enabled and networked sensors are enabling real-time monitoring and seamless integration with building management systems. Multi-technology sensing—combining PIR, ultrasonic, and microwave—improves accuracy in complex indoor environments. Disruptive innovations such as AI-powered presence detection and mmWave radar are enhancing precision by detecting micro-movements. At the same time, wireless, battery-efficient designs and cloud-based analytics are transforming space optimization, safety, and energy management.

Source: Secondary Research, Interviews with Experts, MarketsandMarkets Analysis
OCCUPANCY SENSOR MARKET DYNAMICS
Level
-
Growing demand for energy-efficient devices

-
Increasing deployment of lighting controllers in smart homes

Level
-
Technical limitations of occupancy sensors

-
Inconsistency issues related to wireless network systems

Level
-
Growing initiatives of governments for green buildings

-
Increasing demand for smart buildings in urban areas

Level
-
Lack of awareness regarding benefits of occupancy sensors.

-
Privacy concerns, particularly with camera-based or AI-powered sensors used in offices and public spaces.

Source: Secondary Research, Interviews with Experts, MarketsandMarkets Analysis
Driver: Growing demand for energy-efficient devices.
The growing demand for energy-efficient devices is a major driver for the occupancy sensor market, as buildings increasingly prioritize automation to reduce electricity consumption and operational costs. Occupancy sensors help eliminate unnecessary lighting and HVAC usage by ensuring systems run only when spaces are in use, making them essential for meeting modern energy-efficiency goals. With governments enforcing stricter energy codes and businesses aiming to cut carbon emissions, these sensors are becoming a standard feature in both new constructions and retrofitted buildings. This push toward sustainable infrastructure continues to accelerate adoption across residential, commercial, and industrial environments.
Restraint: Technical limitations of occupancy sensors.
Occupancy sensors face several technical limitations that can affect their accuracy and reliability. PIR sensors struggle with detecting stationary occupants and require a clear line of sight, leading to missed detections in obstructed or partitioned spaces. Ultrasonic and microwave sensors, while more sensitive, can cause false triggers due to vibrations, airflow, or movement outside the intended detection zone. Multi-technology sensors improve accuracy but introduce higher complexity, calibration needs, and cost. Additionally, environmental factors such as temperature changes, reflective surfaces, and background noise can interfere with sensor performance, making consistent detection challenging in diverse real-world conditions.
Opportunity: Growing initiatives of governments for green buildings.
Government initiatives promoting green buildings are creating strong momentum for the occupancy sensor market, as policies increasingly mandate energy-efficient lighting and automated building controls. Many countries have introduced building energy codes, green certification programs, and incentives that require or encourage the use of smart sensors to reduce electricity consumption in commercial and residential structures. These initiatives support the shift toward sustainable infrastructure by driving the adoption of intelligent lighting, HVAC optimization, and real-time energy management. As governments push for lower carbon emissions and smarter urban development, occupancy sensors are becoming a critical component of compliant and eco-friendly building designs.
Challenge: Lack of awareness regarding benefits of occupancy sensors.
A key challenge for the occupancy sensor market is the lack of awareness regarding their long-term benefits. Many building owners and small enterprises are still unfamiliar with how occupancy sensors can significantly reduce energy costs, improve automation, and enhance overall building efficiency. This limited understanding often leads to hesitation in adoption, especially in regions where upfront cost sensitivity is high. As a result, potential users may overlook the substantial operational savings and sustainability advantages these sensors provide, slowing market growth.
OCCUPANCY SENSOR MARKET SIZE, SHARE & ANALYSIS: COMMERCIAL USE CASES ACROSS INDUSTRIES
| COMPANY | USE CASE DESCRIPTION | BENEFITS |
|---|---|---|
 |
Deployment of PIR, ultrasonic, and dual-technology occupancy sensors in commercial buildings, office spaces, and educational institutions. | Enhances energy efficiency by automating lighting and HVAC, reduces operational costs, and improves overall building comfort. |
 |
Integration of smart occupancy sensors with building management systems (BMS) for real-time monitoring of space usage and automated environmental control | Improves space optimization, increases energy savings, and enables intelligent facility management through data-driven insights. |
 |
Use of wired and wireless occupancy sensors in industrial facilities and commercial lighting systems for automated control and safety compliance. | Reduces energy waste in large facilities, enhances worker safety, and supports compliance with energy and building codes |
 |
Advanced occupancy and presence sensors integrated into HVAC, security, and smart building platforms for industrial, commercial, and healthcare environments | Increases operational efficiency, enables predictive building control, and enhances comfort with precise occupancy-based adjustments. |
 |
Deployment of networked lighting control sensors and ceiling-mounted occupancy detectors in retail, office, and residential applications. | Delivers high energy savings, supports smart lighting ecosystems, and enhances user experience with seamless automation. |
Logos and trademarks shown above are the property of their respective owners. Their use here is for informational and illustrative purposes only.
OCCUPANCY SENSOR MARKET ECOSYSTEM
The ecosystem of occupancy sensor includes raw material suppliers, manufacturers, and distributors. Raw material suppliers provide key components such as PIR elements, ultrasonic transducers, microwave modules, lenses, circuit boards, and casings that form the core of occupancy sensor technology. Manufacturers design and assemble occupancy sensors by integrating detection technologies, control circuits, and communication modules into complete, ready-to-install products. Distributors bridge the gap between manufacturers and customers by ensuring efficient regional availability of occupancy sensors through retail, wholesale, and project-based supply channels.

Logos and trademarks shown above are the property of their respective owners. Their use here is for informational and illustrative purposes only.
OCCUPANCY SENSOR MARKET SEGMENTS

Source: Secondary Research, Interviews with Experts, MarketsandMarkets Analysis
Occupancy Sensor Market, By Type
Ceiling-mount occupancy sensors dominate the market because they provide the widest and most uniform coverage, enabling a single sensor to accurately monitor large or irregular rooms. Their elevated position reduces blind spots and enhances detection reliability for both motion and presence sensing. They are also easier to integrate into modern building layouts, especially in commercial spaces with standardized ceiling grids. Additionally, they require fewer units per room, lowering installation and maintenance costs for end users.
Occupancy Sensor Market, By Technology
PIR (Passive Infrared) occupancy sensors dominate because they offer high reliability and low false-trigger rates by detecting actual body heat movement rather than noise or vibrations. They are also cost-effective, energy efficient, and easy to install, making them the preferred choice across residential and commercial buildings. Additionally, PIR technology performs well in enclosed indoor spaces where temperature contrast helps deliver accurate detection, strengthening its adoption in mainstream applications.
Occupancy Sensor Market, By End User
Commercial buildings dominate the occupancy sensor market due to their high demand for automated lighting and HVAC systems aimed at reducing energy consumption and operating costs. These spaces—such as offices, retail stores, and educational institutions—have frequent foot traffic and varying occupancy patterns, making sensors essential for efficient control. Additionally, stricter building energy codes and green certification requirements drive widespread adoption of occupancy sensors in new and retrofitted commercial infrastructures.
OCCUPANCY SENSOR MARKET BY REGION
Asia Pacific to be fastest-growing region in global occupancy sensor market during forecast period
Asia Pacific is growing the fastest in the occupancy sensor market because the region is experiencing rapid construction of commercial buildings, smart homes, and industrial facilities driven by urbanization and digitalization. Governments are increasingly enforcing energy-efficiency regulations and promoting green building standards, which accelerates sensor adoption. The strong presence of electronics manufacturing, lower installation costs, and expanding smart city projects in China, India, Japan, and Southeast Asia further boost demand. Additionally, rising awareness of automation and energy savings is pushing both residential and commercial users to deploy occupancy sensors at a faster pace.

OCCUPANCY SENSOR MARKET SIZE, SHARE & ANALYSIS: COMPANY EVALUATION MATRIX
In the occupancy sensor companies matrix, Legrand (Star) leads with a strong global footprint and a versatile range of high-precision sensors that integrate seamlessly into modern lighting control and building automation systems. Its reliability, breadth of solutions, and focus on energy efficiency solidify its dominant position. Schneider Electric (Emerging Leader) is rapidly gaining traction with its IoT-enabled, data-driven sensing technologies that support smart-building analytics and dynamic energy optimization. While Legrand maintains a clear lead, Schneider Electric shows strong potential to move toward the leaders’ quadrant as demand grows for connected, intelligent occupancy sensing solutions.

Source: Secondary Research, Interviews with Experts, MarketsandMarkets Analysis
OCCUPANCY SENSOR MARKET KEY PLAYERS
- Legrand (France)
- Johnson Controls Inc (US)
- Eaton (Ireland)
- Honeywell International Inc (US)
- Schneider Electric (France)
- Acuity Brands (US)
- Signify Holdings (Netherlands)
- Hubbell (US)
- Leviton Manufacturing Co Inc. (US)
- Lutron Electronics Co Inc. (US)
OCCUPANCY SENSOR MARKET SCOPE
| REPORT METRIC | DETAILS |
|---|---|
| Market Size in 2023 (Value) | USD 2.53 Billion |
| Market Forecast in 2030 (Value) | USD 5.20 Billion |
| Growth Rate | CAGR of 11.2% from 2024-2030 |
| Years Considered | 2020-2030 |
| Base Year | 2023 |
| Forecast Period | 2024-2030 |
| Units Considered | Value (USD Million/Billion), Volume (Million Units) |
| Report Coverage | Revenue forecast, company ranking, competitive landscape, growth factors, and trends |
| Segments Covered |
|
| Regions Covered | North America, Asia Pacific, Europe, South America, Middle East & Africa |
WHAT IS IN IT FOR YOU: OCCUPANCY SENSOR MARKET SIZE, SHARE & ANALYSIS REPORT CONTENT GUIDE

DELIVERED CUSTOMIZATIONS
We have successfully delivered the following deep-dive customizations:
| CLIENT REQUEST | CUSTOMIZATION DELIVERED | VALUE ADDS |
|---|---|---|
| Leading Building Automation OEM |
|
|
| Smart Lighting Solutions Provider |
|
|
| Commercial Real Estate Developer |
|
|
| Industrial Facility & Warehouse Operator |
|
|
RECENT DEVELOPMENTS
- May 2024 : Vantage, the Legrand brand for lighting control, announced its partnership with WALL-SMART, the provider of flush wall mount solutions. Through this cooperation, WALL-SMART will integrate the Vantage brand into its products to be seamlessly installed in any space, promoting an added aesthetic look and functionality
- April 2024 : Leviton has expanded its Smart Sensor line to include Smart Ceiling Mount Room Controllers (SRC) and Smart Ceiling Mount Sensors (CMS). These innovations make advanced lighting control easier to deploy. Advanced control strategies are combined into one device for cost-effectiveness and the ability to easily install them. By comparison, these solutions require only two devices against an industry standard four for code compliance, streamlining installation.
- February 2024 : Eaton has renewed its commitment to modernizing its manufacturing operations through the advancement of smart factories in Juarez, Mexico, and Changzhou, China. one a greenfield site and another a legacy site, each of them implemented Industry 4.0 technology into their processes to facilitate their respective upgrading and digitization
Table of Contents
 Exclusive indicates content/data unique to MarketsandMarkets and not available with any competitors.
Methodology
The study used four major activities to estimate the market size of the occupancy sensor. Exhaustive secondary research was conducted to gather information on the market and its peer and parent markets. The next step was to validate these findings, assumptions, and sizing with industry experts across the value chain through primary research. Both top-down and bottom-up approaches were employed to estimate the total market size. Finally, market breakdown and data triangulation methods were utilized to estimate the market size for different segments and subsegments.
Secondary Research
The research methodology used to estimate and forecast the size of the occupancy sensor market began with the acquisition of data related to the revenues of key vendors in the market through secondary research. Various secondary sources have been referred to in the secondary research process for identifying and collecting information for this study. Secondary sources include annual reports, press releases, and investor presentations of companies; white papers, journals, certified publications, and articles by recognized authors; websites; directories; and databases. Secondary research has mainly been used to obtain key information about the value chain of the occupancy sensor market, key players, market classification, and segmentation according to the industry trends to the bottom-most level, geographic markets, and key developments from both market and technology-oriented perspectives. Secondary data has been collected and analyzed to determine the overall market size, further validated through primary research. The secondary research referred to for this research study involves the Semiconductor Industry Association (SIA), Electronic System Design Alliance (ESD Alliance), Institute of Electrical and Electronics Engineers (IEEE), Taiwan Semiconductor Industry Association (TSIA), European Semiconductor Industry Association (ESIA), and Korea Semiconductor Industry Association (KSIA). Moreover, the study involved extensive use of secondary sources, directories, and databases, such as Hoovers, Bloomberg Businessweek, Factiva, and OneSource, to identify and collect valuable information for a technical, market-oriented, and commercial study of the occupancy sensor market. Vendor offerings have been taken into consideration to determine market segmentation.
Primary Research
In the primary research, various primary sources from both the supply and demand sides have been interviewed to obtain the qualitative and quantitative information relevant to this report. Primary sources from the supply side include the key industry participants, subject-matter experts (SMEs), and C-level executives and consultants from various key companies and organizations in the occupancy sensor ecosystem. After the complete market engineering (including calculations for the market statistics, the market breakdown, the market size estimations, the market forecasting, and the data triangulation), extensive primary research has been conducted to verify and validate the critical market numbers obtained. Extensive qualitative and quantitative analyses have been performed during the market engineering process to list key information/insights throughout the report. Extensive primary research has been conducted after understanding the occupancy sensor market scenario through secondary research. Several primary interviews have been conducted with market experts from the demand and supply-side players across key regions, namely, North America, Europe, Asia Pacific, and the Rest of the World (Middle East, Africa, and South America). Various primary sources from both the supply and demand sides of the market have been interviewed to obtain qualitative and quantitative information. Following is the breakdown of the primary respondents.
Primary data has been collected through questionnaires, emails, and telephonic interviews. In the canvassing of primaries, various departments within organizations, such as sales, operations, and administration, were covered to provide a holistic viewpoint in our report. After interacting with industry experts, brief sessions were conducted with highly experienced independent consultants to reinforce the findings from our primaries. This and the in-house subject matter experts’ opinions have led us to the findings described in the remainder of this report.
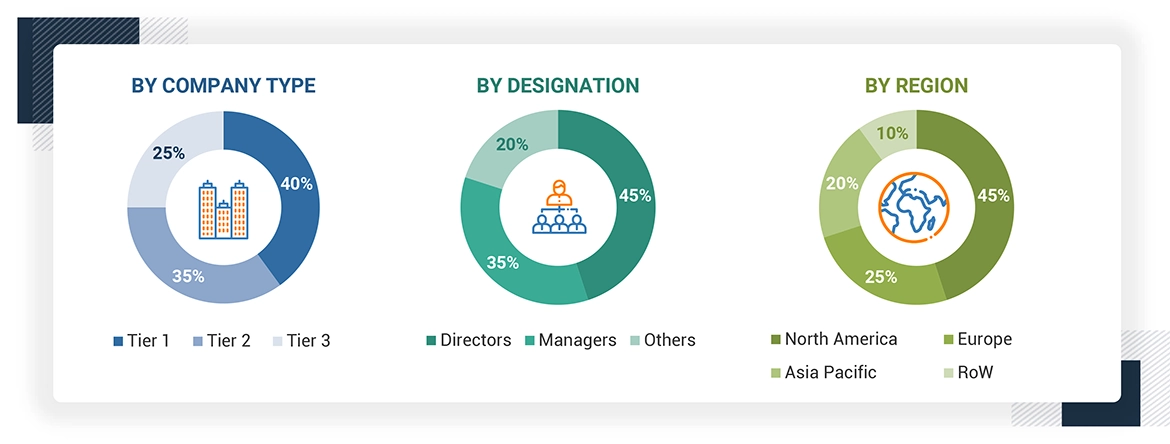
Note: The three tiers of the companies are defined based on their total revenue in 2023: Tier 1 - revenue greater than or equal to USD 1 billion; Tier 2 - revenue between USD 100 million and USD 1 billion; and Tier 3 revenue less than or equal to USD 100 million. Other designations include sales managers, marketing managers, and product managers.
About the assumptions considered for the study, To know download the pdf brochure
Market Size Estimation
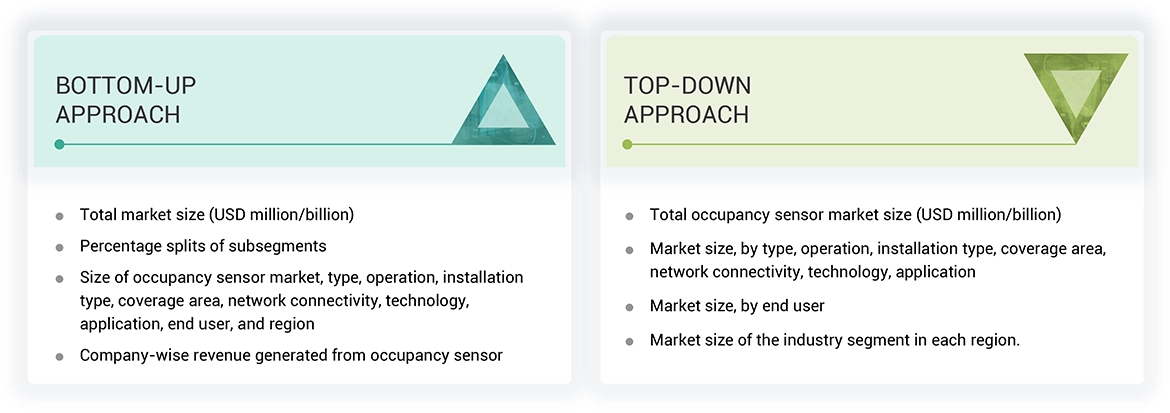
To estimate and validate the size of the occupancy sensor market and its submarkets, both top-down and bottom-up approaches were utilized. Secondary research was conducted to identify the key players in the market, and primary and secondary research was used to determine their market share in specific regions. The entire process involved studying top players' annual and financial reports and conducting extensive interviews with industry leaders such as CEOs, VPs, directors, and marketing executives. Secondary sources were used to determine all percentage shares and breakdowns, which were verified through primary sources. All parameters that could impact the markets covered in this research study were accounted for, analyzed in detail, verified through primary research, and consolidated to obtain the final quantitative and qualitative data.
Occupancy Sensor Market : Top-Down and Bottom-Up Approach
Data Triangulation
Once the overall size of the occupancy sensor market was determined using the methods described above, it was divided into multiple segments and subsegments. Market engineering was performed for each segment and subsegment using market breakdown and data triangulation methods, as applicable, to obtain accurate statistics. To triangulate the data, various factors and trends from the demand and supply sides were studied. The market was validated using both top-down and bottom-up approaches.
Market Definition
Occupancy sensor a device that detects the presence of people in a given area and controls devices such as lighting, HVAC (heating, ventilation, and air conditioning), or security related to whether it is occupied or vacant. These sensors automatically perform certain functions to prevent energy wastage, increase safety, and increase efficiency. They work based on the use of technologies of passive infrared (PIR) and ultrasonic detection. Occupancy sensors are controlling devices on energy use for many applications such as lighting, HVAC, and security systems. They can be mounted in walls, such as corner post or as wall switches, or on ceilings in order to detect the occupancy of a space. It can be deployed in residential and commercial settings to save energy and enhance automation systems. The sensors, by adjusting parameters automatically based on real time detection of an individual's presence, save operational cost and promote user comfort and security.
Key Stakeholders
- Raw material & manufacturing equipment suppliers
- Property and building developers
- Original equipment manufacturers (end-user applications/electronic product manufacturers)
- Distributors and retailers
- Network providers
- Research organizations
- System integrators
- Technology investors
- Lighting companies
Report Objectives
- To describe and forecast the occupancy sensor market, by type, operation, installation type, coverage area, network connectivity, technology, application, end user and region, in terms of value
- To describe and forecast the market for various segments across four central regions, namely, North America, Europe, Asia Pacific, and Rest of the World (RoW), in terms of value
- To strategically analyze the micro markets with regard to the individual growth trends, prospects, and contribution to the market
- To provide detailed information regarding drivers, restraints, opportunities, and challenges influencing the growth of the market
- To analyze opportunities for stakeholders by identifying high-growth segments in the market
- To provide a detailed overview of the value chain
- To strategically analyze the ecosystem, regulatory landscape, patent landscape, Porter’s five forces, import and export scenarios trade landscape, and case studies pertaining to the market under study
- To strategically profile key players in the occupancy sensor market and comprehensively analyze their market shares and core competencies
- To strategically profile the key players and provide a detailed competitive landscape of the market
- To analyze competitive developments such as partnerships, acquisitions, expansions, collaborations, and product launches, along with research and development (R&D) in the occupancy sensor market
Available Customizations
With the given market data, MarketsandMarkets offers customizations according to the specific requirements of companies. The following customization options are available for the report:
- Detailed analysis and profiling of additional market players (up to 5)
- Additional country-level analysis of the occupancy sensor market
Product Analysis
- Product matrix, which provides a detailed comparison of the product portfolio of each company in the occupancy sensor market.
Need a Tailored Report?
Customize this report to your needs
Get 10% FREE Customization
Customize This ReportPersonalize This Research
- Triangulate with your Own Data
- Get Data as per your Format and Definition
- Gain a Deeper Dive on a Specific Application, Geography, Customer or Competitor
- Any level of Personalization
Let Us Help You
- What are the Known and Unknown Adjacencies Impacting the Occupancy Sensor Market
- What will your New Revenue Sources be?
- Who will be your Top Customer; what will make them switch?
- Defend your Market Share or Win Competitors
- Get a Scorecard for Target Partners

Custom Market Research Services
We Will Customise The Research For You, In Case The Report Listed Above Does Not Meet With Your Requirements
Get 10% Free CustomisationTESTIMONIALS

Tetsuya Ohhira
Business Development Manager-Technology Business
Nikon Corporation,
Leading Japanese MNC specializing in optics and imaging productswww.nikon.com
MarketsandMarkets™ response
is quick. Their attitude is flexible and positive. Analyst Insights are globally considered and
significant. Client Services quickly respond to our inquiry and demand. Their wide range of global
surveys help us make our strategic plan.
We hope Knowledge Store will be easier to search
for a report.
VP - Marketing & Business Development
Leading Provider of Process Control Solutions
We engaged with MarketsandMarkets on a study to perform an analysis and recommend a Go-To-Market strategy for metrology and process control in the semiconductor market. The study was tailored to our targets and needs with well-defined milestones. Our overall experience with the MarketsandMarkets team was very good throughout the project in all aspects including the analysis methodologies used, the quality and depth of primary and secondary data sets, the professionalism and flexibility of the team and the ability to meet the target schedule and milestones. We want to thank MarketsandMarkets team for a job well done.
Growth opportunities and latent adjacency in Occupancy Sensor Market


Gavin
Apr, 2026
Does the report profile key players based on product offerings, strategies, and future growth positioning?.
Terry
Apr, 2026
Does the report provide insights into demand drivers across offices, healthcare, education, and retail environments?.
Jan, 2015
Dear Ms./Sir, we are interested in Microwave sensor and Occupancy Sensor Market Technology. .
Ingar
Nov, 2015
Does this report tell me volume split of occupancy sensors for each technology? Does the report also split into technologies used for occupancy sensing vs application?.
Michael
Oct, 2016
I am interested to purchase only the market share for the occupancy sensors report. How much would be the cost?.