Oncology Nutrition Market by Cancer Type (Head & Neck, Stomach & Gastrointestinal, Liver, Pancreatic, Esophageal, Lung, Breast, Blood) - Global Forecast to 2023


[92 Pages Report] The oncology nutrition market was valued at USD 1.34 Billion in 2017 and is expected to reach USD 2.21 Billion by 2023, at a CAGR of 8.7% during the forecast period. Factors such as the development of elemental formulas and product innovation in terms of non-GMO-based formulas present significant opportunities for the growth of oncology-based nutrition formulas.
Years considered for this report
- 2017 – Base Year
- 2018–2023 – Forecast Period
Objectives of the Study
- To define, describe, segment, and forecast the oncology nutrition market for different types of cancer
- To provide detailed information regarding the major factors influencing the growth of the market (drivers, restraints, and industry-specific opportunities)
- To forecast the size of the oncology nutrition market, in four main regions —North America (along with countries), Europe (along with countries), Asia Pacific, and the Rest of the World
- To identify and profile key players in the global oncology nutrition market and comprehensively analyze their core competencies and market shares
- To track and analyze competitive developments such as mergers and acquisitions; new product launches; expansions; collaborations and agreements; and R&D activities of the leading players in the global oncology nutrition market
Research Methodology
This study estimates the market size for 2018 and projects its demand till 2023. Top-down and bottom-up approaches were used to validate the size of this market and estimate the size of other dependent submarkets. Various secondary sources such as directories, industry journals, databases (such as D&B Hoovers, Bloomberg Business, and Factiva), and annual reports of companies have been used to identify and collect information useful for the study of the oncology nutrition market. Primary sources such as experts from both supply and demand sides have been interviewed to obtain and validate information as well as to assess dynamics of this market. The breakdown of profiles of primaries is shown in the figure below:
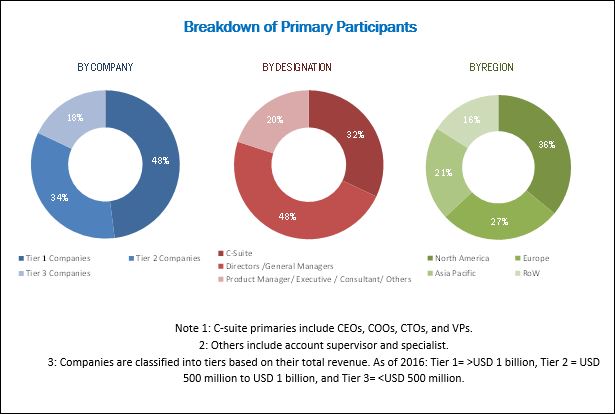
To know about the assumptions considered for the study, download the pdf brochure
The major players in the oncology nutrition market are Abbott Laboratories (US), Nestle S.A. (Switzerland), Danone (France), Fresenius Kabi AG (Germany), and B.Braun Melsungen AG (Germany). The other players in this market include Mead Johnson Nutrition Company (US), Hormel Foods (US), Meiji Holdings (Japan), Victus (US), and Global Health Products (US).
Target Audience:
- Manufacturers and vendors of enteral feeding formulas
- Research associations related to enteral nutrition and oncology
- Hospitals, nursing homes, and LTC facilities
- Various research and consulting firms
- Distributors of enteral feeding formulas
- Healthcare institutions
- Research institutes
- Venture capitalists and investors
“The study answers several questions for stakeholders, primarily which market segments to focus in the next five years for prioritizing efforts & investments and competitive landscape of the market.”
Scope of the Report:
The research report categorizes the oncology nutrition market into the following segments:
Global Oncology Nutrition Market, by Cancer Type
- Head and Neck Cancers
- Stomach and Gastrointestinal Cancers
- Liver Cancer
- Pancreatic Cancer
- Esophageal Cancer
- Lung Cancer
- Breast Cancer
- Blood Cancer
- Other Cancers
Global Oncology Nutrition Market, by Geography
-
North America
- US
- Canada
-
Europe
- Germany
- France
- UK
- Italy
- Spain
- Rest of Europe (RoE)
- Asia Pacific
- Rest of the World (RoW)
Available Customizations
With the given market data, MarketsandMarkets offers customizations as per the company’s specific needs. The following customization options are available for the report:
-
Geographic Analysis
- Further breakdown of the Asia Pacific oncology nutrition market into Japan, China, India, and Rest of Asia Pacific
- Further breakdown of the Rest of the World oncology nutrition market into Latin America and the Middle East & Africa
-
Company Information
- Detailed analysis and profiling of additional market players (Up to 5)
The global oncology nutrition market is expected to reach USD 2.21 Billion by 2023 from USD 1.46 Billion in 2018, at a CAGR of 8.7%. Factors such as shifting focus from parenteral to enteral nutrition, increasing incidence of cancer, growing demand for nutritional feeding in the homecare sector, rising number of patients being treated for malnutrition, and increasing quality of clinical research on nutritional interventions are driving the market growth.
The report analyzes the oncology nutrition market by type of cancer and region. Based on cancer type, the head and neck cancers segment accounted for the largest share of the market in 2017. Patients with head and neck cancers suffer from severe problems associated with oral nutritional intake. Thus, the enteral route is used for nutrition support. With the increasing number of such cancers cases, the uptake of tube feeding formulas has increased. Also, conditions such as severe mucositis, xerostomia, dysgeusia, and nausea & vomiting limit nutritional intake, adding to the adoption of oncology nutritional feeding formulas.
Although, tube feeding is an effective and cost-efficient option for providing clinical nutrition, certain complications associated with the use of these devices can result in additional healthcare costs. Also, the limited reimbursement associated with its use pose significant restraint for greater adoption of these feeding formulas.
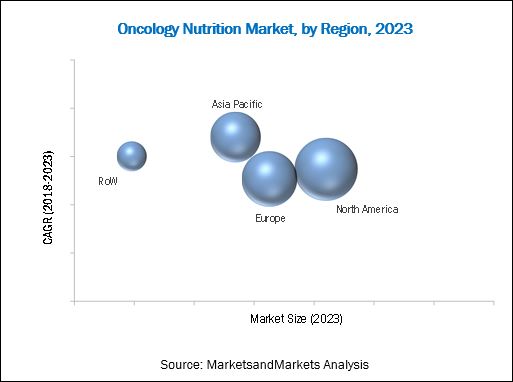
Geographically, the oncology nutrition market is segmented into North America, Europe, Asia Pacific, and the Rest of the World. In 2017, North America accounted for the largest share of this market. However, the Asia Pacific region is expected to witness the highest CAGR during the forecast period of 2018 to 2023. The growth of this segment can be attributed to the increased awareness and accessibility to advanced healthcare facilities, rising healthcare spending, large population base, and rapid improvements in the health insurance sector.
To speak to our analyst for a discussion on the above findings, click Speak to Analyst
 Exclusive indicates content/data unique to MarketsandMarkets and not available with any competitors.
Table of Contents
1 Introduction (Page No. - 9)
1.1 Objectives of the Study
1.2 Market Covered
1.3 Market Definition
1.4 Years Considered
2 Research Methodology (Page No. - 11)
2.1 Secondary Research
2.2 Primary Research
2.3 Analysis
3 Market Dynamics (Page No. - 17)
3.1 Drivers
3.2 Restraints
3.3 Opportunities
4 Industry Insights (Page No. - 26)
4.1 Clinical Challenges
4.2 Market Challenges
4.3 Product Attributes Assessment
4.4 Insights of Industry Experts
5 Global Oncology Nutritional Feeding Formulas Market, By Cancer Type (Page No. - 31)
5.1 Overview – Cancer
5.2 Market Size, By Cancer Type
5.3 Head and Neck Cancer
5.4 Stomach and Gastrointestinal Cancers
5.5 Liver Cancer
5.6 Pancreatic Cancer
5.7 Esophageal Cancer
5.8 Lung Cancer
5.9 Breast Cancer
5.1 Blood Cancer
5.11 Other Cancers
6 Product Portfolio Assessment (Page No. - 59)
7 Company Profiles (Page No. - 64)
(Business Overview, Company Snapshot, Financial Review, Products Offered, Recent Developments, MnM View)
7.1 Abbott Laboratories
7.2 Nestlé
7.3 Danone
7.4 Fresenius Kabi
7.5 B. Braun
8 Market Share Analysis (Page No. - 92)
List of Tables(11 Tables)
Table 1 Global Oncology Nutritional Feeding Formulas Market, By Cancer Type, 2016–2023 (USD Million)
Table 2 Global Nutritional Feeding Formulas Market, By Country, 2016–2023 (USD Million)
Table 3 Global Nutritional Feeding Formulas Market for Head & Neck Cancers, By Country, 2016–2023 (USD Million)
Table 4 Global Nutritional Feeding Formulas Market for Stomach & Gastrointestinal Cancers, By Country, 2016–2023 (USD Million)
Table 5 Global Nutritional Feeding Formulas Market for Liver Cancer, By Country, 2016–2023 (USD Million)
Table 6 Global Nutritional Feeding Formulas Market for Pancreatic Cancer, By Country, 2016–2023 (USD Million)
Table 7 Global Nutritional Feeding Formulas Market for Esophageal Cancer, By Country, 2016–2023 (USD Million)
Table 8 Global Nutritional Feeding Formulas Market for Lung Cancer, By Country, 2016–2023 (USD Million)
Table 9 Global Nutritional Feeding Formulas Market for Breast Cancer, By Country, 2016–2023 (USD Million)
Table 10 Global Nutritional Feeding Formulas Market for Blood Cancer, By Country, 2016–2023 (USD Million)
Table 11 Global Nutritional Feeding Formulas Market for Other Cancers, By Country, 2016–2023 (USD Million)
List of Figures (23 Figures)
Figure 1 Global Cancer Incidence, 2008–2030
Figure 2 Cancer Incidence Across Key Countries, 2012
Figure 3 Share of Geriatric Population Among New Cancer Cases
Figure 4 Smoking Prevalence, By Country, 2015 (% of Total Population)
Figure 5 Estimated Number of New Cancer Cases
Figure 6 Global Oncology Nutritional Feeding Formulas Market, By Cancer Type, 2018 vs 2023
Figure 7 Head & Neck Cancers Incidence, 2012–2030
Figure 8 Head & Neck Cancers Incidence Across Key Regions, 2012
Figure 9 Stomach Cancer Incidence, 2012–2030
Figure 10 Stomach Cancer Incidence Across Key Regions, 2012
Figure 11 Liver Cancer Incidence, 2012–2030
Figure 12 Liver Cancer Incidence Across Key Regions, 2012
Figure 13 Pancreatic Cancer Incidence, 2012–2030
Figure 14 Pancreatic Cancer Incidence Across Key Regions, 2012
Figure 15 Esophageal Cancer Incidence, 2012–2030
Figure 16 Esophageal Cancer Incidence Across Key Regions, 2012
Figure 17 Lung Cancer Incidence, 2012–2030
Figure 18 Lung Cancer Incidence Across Key Regions, 2012
Figure 19 Breast Cancer Incidence, 2012–2030
Figure 20 Breast Cancer Incidence Across Key Regions, 2012
Figure 21 Blood Cancer Incidence, 2012–2030
Figure 22 Blood Cancer Incidence Across Key Regions, 2012
Figure 23 Nutritional Feeding Formulas: Market Share Assessment, 2015 vs 2017 vs 2023

 Generating Response ...


Growth opportunities and latent adjacency in Oncology Nutrition Market