Open Source Services Market by Service (Professional Services, Managed Services), Organization Size (Large Enterprises, SMEs), Vertical (IT and ITeS, Healthcare and Life Sciences, Education, Retail and eCommerce) and Region - Global Forecast to 2027
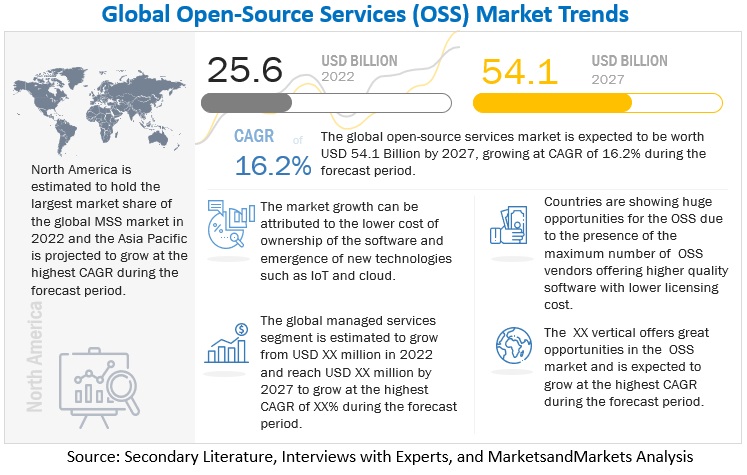
[246 Pages Report] MarketsandMarkets forecasts the global OSS market size to grow from an estimated value of USD 25.6 billion in 2022 to 54.1 billion USD by 2027 at a Compound Annual Growth Rate (CAGR) of 16.2%. Some factors driving market growth include the growing adoption of OSS due to the offered agility, flexibility, and reliability of the services along with lower total cost of ownership. Moreover, the higher adoption is a result of increased substantial support from the open source community and the suppliers offering the services. However, the hidden cost associated with the OSS integration and implementation along with exploitation caused due to the advent of malicious users are expected to hinder market growth.
To know about the assumptions considered for the study, Request for Free Sample Report
Open Source Services Market Dynamics
Driver: Gamut of low-cost open source services
Obtaining an open source version to replace a software package that is being paid for can be extremely beneficial for a company. Open source encourages everyone to have access to a product's design or blueprint through a free or open source license to redistribute it widely. Creating customized software without reinventing the wheel is feasible because open source software is often free. Unlike closed proprietary software, open source software can be altered and extended by any developer familiar with a source code. When organizations use open source software, they would no longer need to worry about licenses. Open source software enables them to install it several times and use it from any location. Organizations will be free from monitoring, tracking, or counting license compliance.
Typically, open source software is compatible with a wide range of systems. It enables the customer to select the platform that best suits their requirements. Cheaper alternatives enable customers to save a significant amount of money. Nevertheless, the quality is not compromised. Open source is generally much more cost-effective than a proprietary solution. Not only are open source solutions typically much more inexpensive in an enterprise environment for equivalent or superior capability, but they also give enterprises the ability to start small and scale up.
Restraint: Open source services adoption to hinder due to the malicious users exploiting loopholes
IT leaders have good reason to be concerned about the open source community's ongoing software modifications. Open source software increases the complexity of software maintenance, making it easier for unscrupulous users to take advantage of existing security flaws to infect technology, steal identities, and cause other problems with cybersecurity, which is worrisome for end users. These rarely happen with commercially produced software since the companies who make them have stringent quality control check processes and ensure that the program is almost perfect when released to the market.
Opportunity: Amalgamation of technical support and maintenance boosting OSS vendor offerings
Some open source applications may be tricky to set up and use. Others may lack user-friendly interfaces or features that organizations’ staff may be familiar with. This can affect productivity and prevent their staff from adopting or using programs with ease. When using open source software, it is common to experience technical issues. Unlike proprietary software, open source software does not offer extensive support. To fix this, people look for support services online. Since open source software is created by numerous developers, there is not just one person liable for an error. The only option available is to contact the provider or rely on third-party support services. This is where the open source service vendors come into action.
Having people with expertise in the software is a must. There isn’t any readily available tech support or properly documented help available. Making the software user-friendly isn’t a top priority for developers. Additional training may be required to fill the skills gap. Organizations hire their dedicated team of open source service providers to manage the software. This is driving the OSS market; at the same time, it is proving to be a great opportunity for open source service vendors to grow positively.
Free Open Source Software (FOSS) enterprises are attracting more attention due to their lower TCO for their customers as well as the fact that they have expanded their support services and service level agreements to compete with traditional vendors. These developments imply that the leading FOSS companies and products will keep growing as technology buyers get more comfortable using these new services introduced to the software industry.
Challenge: Compatibility issues with available platforms
There is a shortage of applications that run both on open source and proprietary software; therefore, switching to an open source platform involves a compatibility analysis of all the other software that runs on proprietary platforms. In addition, there are many ongoing parallel developments on open source software. This creates confusion on what functionalities are present in which versions. Much of the latest hardware is incompatible with the open source platform; therefore, users must rely on third-party drivers. However, that cannot guarantee that the hardware will work on the host machine. Hence, before purchasing hardware, it is recommended to check it is supported by the open source application. Compatibility problems can also arise when the organization has employees unfamiliar with the software in question and prefer a closed-source alternative, in addition to problems with some closed-source programs not cooperating well with open source ones.
Open Source Services Market Ecosystem
To know about the assumptions considered for the study, download the pdf brochure
By service, managed services to grow at highest CAGR during the forecast period
Managed services offer IT assistance to improve the client experience. Companies employ Managed Service Providers to perform specific IT responsibilities on their behalf (MSPs). These basic outsourcing tasks include keeping IT infrastructure and other services operational by entirely outsourcing the IT personnel. Companies may find it challenging to manage these services while focusing on their primary business operations. As a result, businesses rely heavily on external partners to provide managed services. Every technology domain needs managed services that are effectively supplied. Regardless of the location of the clients, vendors must offer technological know-how, dependable service, and flexibility. The "open core model" theory is the foundation for open source managed services. In this model, the product or service's fundamental functionality is made available as open source, and additional proprietary fee-based features or services are added on top. The ability to maintain and upgrade solutions, which are crucial in open source contexts, is provided through managed services. The managed services division takes care of client demands and pre- and post-deployment inquiries. During the forecast period, these elements are anticipated to drive the adoption of managed services.
By professional services, implementation and integration segment to hold largest highest market size during the forecast period
Enterprise solutions are highly developed and popular. Since each organization has unique installation, module, feature, and packaging requirements, these applications are difficult to administer and maintain. Open source integration can meet all perfection and efficiency requirements. The proper connectors and back-end integration capabilities are necessary for open source software solutions because they must be integrated with the current systems. System integration services are becoming more and more popular among end users all over the world because they guarantee effective system communication, which improves the proper operation of the entire production process. Customers' requirements are first gathered through system integration services, which are followed by the deployment, integration, testing, and rollout of solutions. By integrating open source software with their clients' current IT infrastructure, system integration service providers help companies in creating a connected environment.
By vertical, Healthcare and Life Sciences segment to grow at the highest CAGR during the forecast period
In the healthcare industry, speed, efficiency, and accuracy are critical elements for providing the best care for patients. Physicians, nurses, and support staff need access to vast amounts of data and information at their fingertips, including patient information, medications, Electronic Medical Records (EMRs), physician notes, and lab results. The ability to collect and interpret patient data is critical in driving success for today’s modern healthcare organizations. However, organizations must also ensure that the massive amount of data available is secure and meets Health Insurance Portability and Accountability Act (HIPAA) and other government standards. Open source software solutions and services provide tools to help prevent, detect, and mitigate security threats. For instance, Red Hat worked with the National Institute of Standards and Technology (NIST) to develop the Security Content Automation Protocol (SCAP). By combining OpenSCAP and Red Hat automation, organizations can use a security hardening solution for the operating environment that provides fast, verifiable, and repeatable security for HIPAA compliance.
By region, North America to hold largest highest market size during the forecast period
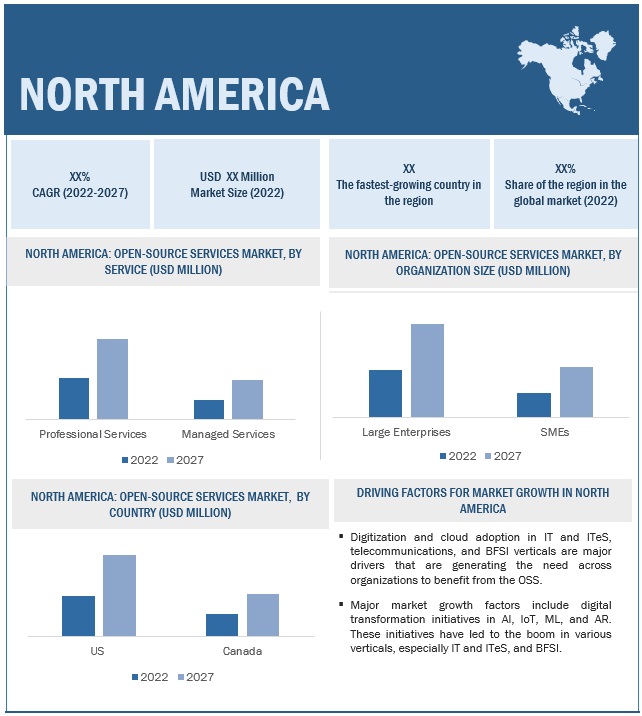
North America is one of the most technologically advanced regions in the world. It comprises the US and Canada and holds the largest share of the global OSS market due to the US market's early adoption of cloud and digital technologies. North American countries have sustainable and well-established economies, enabling them to invest strongly in R&D activities, thereby contributing to developing new technologies. Owing to the early adoption of trending technologies, such as IoT, big data, AI, and ML, manufacturers are keen on integrating industrial IoT technologies with their manufacturing processes. On June 24, 2019, the Federal government of the US issued the Cloud Smart Strategy to provide agencies with implementation guidance to achieve the potential of cloud-based technologies.
The region's leading OSS vendors include IBM, Percona, MuleSoft, Evoke Technologies, Cisco Systems, HPE, ViSolve, Chetu, HashiCorp, and Databricks. These vendors are investing heavily in OSS technology by introducing new launches in the OSS market and making organic and inorganic growth. For instance, in May 2021, Databricks launched its fifth open source project, a new tool called Delta Sharing designed to be a vendor-neutral way to share data with any cloud infrastructure or SaaS product that is a part of the broader Databricks open source Delta Lake project. In January 2021, Percona, one of the leading US software and services companies in open source databases, collaborated with NessPRO to provide the best service to ensure the optimal operation of databases. Percona works with NessPRO to enable companies and organizations in Israel to get the most out of their open source databases, allowing them to achieve their business goals quickly and cost-effectively.
Key Market Players
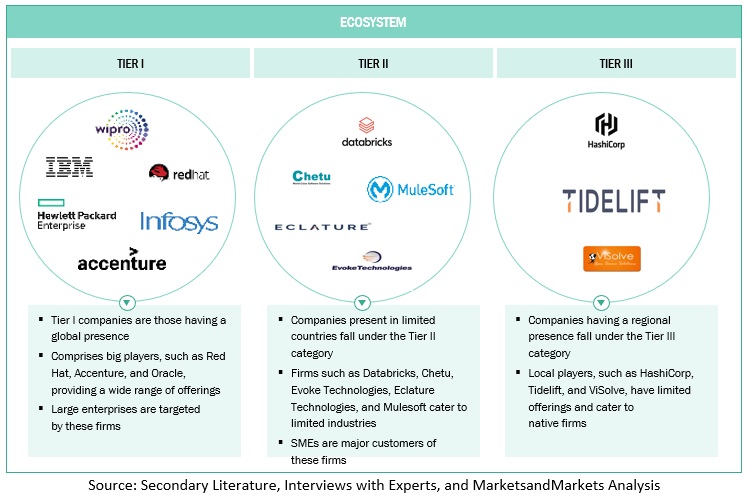
Key players in the global OSS market include IBM (US), Accenture (Ireland), Mulesoft (US), Wipro (India), Databricks (US), Suse (Germany), Cisco (US), Percona (US), Infosys (India), HPE (US), HCL Infosystems (India), Happiest Minds Technologies (India), Quansight (US), Swan Solutions & Services (India), Nous Infosystems (India), Charter Global (US), ViSolve (US), Chetu (US), Evoke Technologies (US), HashiCorp (US), Confluent (US), C Ahead Technologies (US), Puppet (US), Eclature Technologies (UK), Tidelift (US) and Collabora (UK).
Scope of the Report
|
Report Metrics |
Details |
| Market size available for years | 2019–2027 |
| Base year considered | 2021 |
| Forecast period | 2022–2027 |
| Forecast units | Value (USD) |
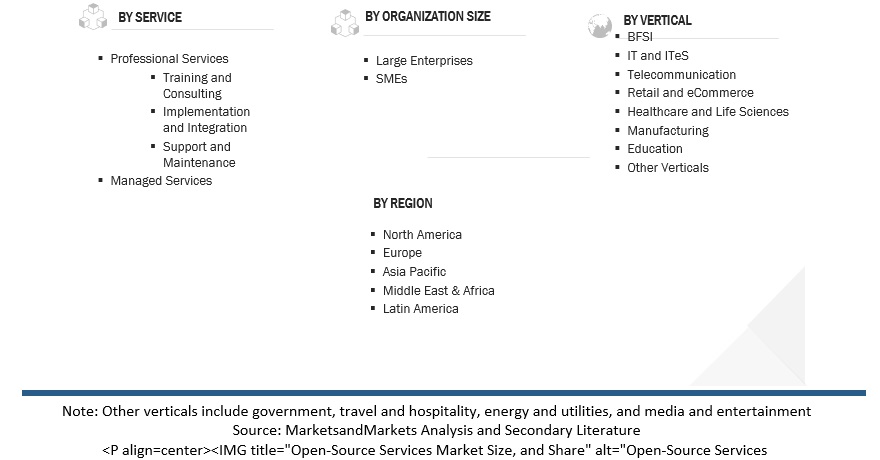
| Segments covered | Service Type, Professional Services Type, Organization Size, Vertical, and Region |
| Geographies covered | North America, Europe, Asia Pacific, Middle East & Africa, and Latin America |
| Major companies covered | IBM (US), Accenture (Ireland), Mulesoft (US), Wipro (India), Databricks (US), Suse (Germany), Cisco (US), Percona (US), Infosys (India), HPE (US), HCL Infosystems (India), Happiest Minds Technologies (India), Quansight (US), Swan Solutions & Services (India), Nous Infosystems (India), Charter Global (US), ViSolve (US), Chetu (US), Evoke Technologies (US), HashiCorp (US), Confluent (US), C Ahead Technologies (US), Puppet (US), Eclature Technologies (UK), Tidelift (US) and Collabora (UK). |
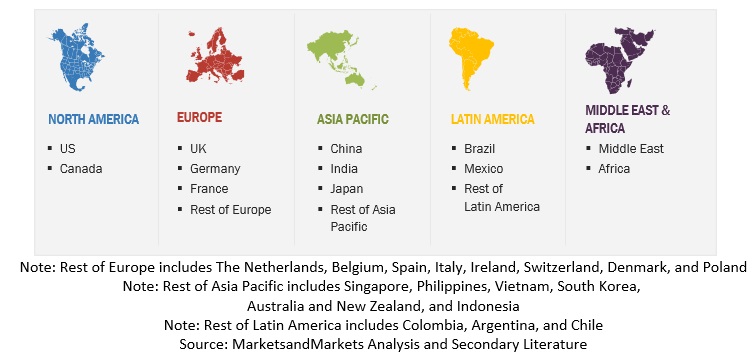
Market Segmentation
Recent Developments
- In September 2022, IBM collaborated with IIT Madras to further explore quantum computing technologies. The Centre for Quantum Information, Communication and Computing (CQuICC) at IIT Madras will concentrate on developing fundamental algorithms in fields, including finance applications research and quantum ML. They will investigate topics, such as quantum algorithms, quantum ML, quantum error correction, and error mitigation, quantum tomography, and quantum chemistry, as well as advance and expand the nation's quantum computing ecosystem, using IBM Quantum services in conjunction with the open-source Qiskit framework.
- In March 2022, to help combat the growing threat to the software supply chain, Wipro declared that it partnered with the Open Source Security Foundation's (OpenSSF) governing board. The OpenSSF is a cross-industry organization based at the Linux Foundation that aims to enhance tooling, training, research, best practices, and vulnerability disclosure guidelines in addition to helping find and fix security problems in open source software.
- In July 2021, HPE acquired Ampool to accelerate hybrid analytics for customers. With the addition of the Ampool team, HPE Ezmeral adds new expertise to deliver a best-in-class, open source SQL cloud service on-premises and hybrid cloud.
Frequently Asked Questions (FAQ):
What is the definition of Open Source Services?
How big is the global open source services market?
Which are the key companies influencing the growth of the open source services market?
Which vertical segment is expected to grow at the highest CAGR during the forecast period?
Which country in Asia Pacific region is expected to hold the largest market size during the forecast period?
To speak to our analyst for a discussion on the above findings, click Speak to Analyst

This study involved multiple steps in estimating the current size of the OSS market. Exhaustive secondary research was carried out to collect information on the OSS industry. The next step was to validate these findings, assumptions, and sizing with industry experts across the value chain using primary research. The top-down and bottom-up approaches were employed to estimate the total market size. After that, the market breakup and data triangulation procedures were used to estimate the market size of the segments and subsegments of the OSS market.
Secondary Research
In the secondary research process, various sources were referred to for identifying and collecting information related to the study. Secondary sources included annual reports, press releases, and investor presentations of OSS vendors, forums, certified publications, and whitepapers. This research was used to obtain key information related to the industry’s value chain, the total pool of key players, market classification, and segmentation from the market- and technology-oriented perspectives.
Factors Considered to Estimate Regional-Level Market Size:
- Gross Domestic Product (GDP) Growth
- Information and Communication Technology (ICT) Security Spending
- Recent Market Developments
- Market Ranking Analysis of Major OSS Providers
Primary Research
Various primary sources from both, the supply and demand sides were interviewed to obtain qualitative and quantitative information for this report. These sources from the supply side included various industry experts, including Chief Executive Officers (CEOs), Vice Presidents (VPs), marketing directors, technology and innovation directors, and related key executives from various key companies and organizations operating in the OSS market.
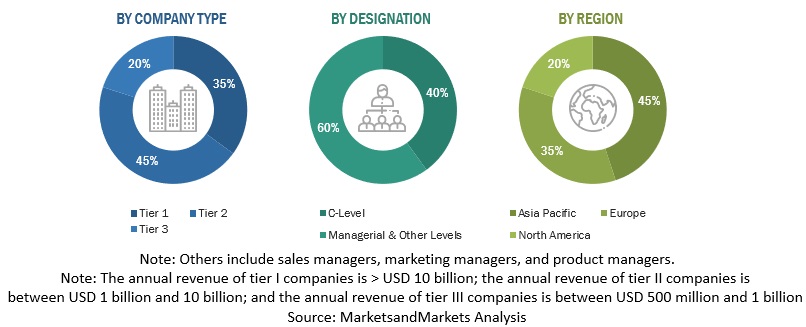
Following is the breakup of the primary interviews:
To know about the assumptions considered for the study, download the pdf brochure
Market Size Estimation
To know about the assumptions considered for the study, Request for Free Sample Report
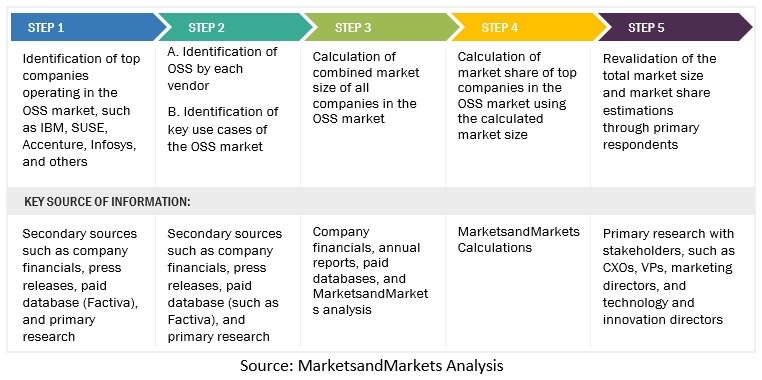
Top-down and bottom-up approaches were used to estimate and validate the size of the global open source services market and estimate the size of various other dependent subsegments. The research methodology used to estimate the market size included the following details.
- Key players in the market were identified through secondary research, and their revenue contributions in the respective regions were determined through primary and secondary research.
- This entire procedure included the study of the annual and financial reports of top market players and extensive interviews for key insights from industry leaders, such as CEOs, VPs, directors, and marketing executives.
- All percentage splits and breakdowns were determined using secondary sources and verified through primary sources.
- All the possible parameters that impact the market covered in this research study have been accounted for, viewed in extensive detail, verified through primary research, and analyzed to obtain the final quantitative and qualitative data. This data is consolidated and enhanced with detailed inputs and analysis from MarketsandMarkets.
Data Triangulation
After arriving at the overall market size using the market size estimation processes explained above, the market was split into several segments and subsegments. The data triangulation and market breakup procedures were employed, wherever applicable, to complete the overall market engineering process and arrive at the exact statistics of each market segment and subsegment. The data was triangulated by studying various factors and trends from both, the demand and supply sides.
Report Objectives
- To define, describe, and forecast the Open Source Services (OSS) market based on services, organization sizes, verticals, and regions
- To provide detailed information about the major factors (drivers, opportunities, restraints, and challenges) influencing the growth of the OSS market
- To forecast the OSS market size across five main regions: North America, Europe, Asia Pacific, Middle East & Africa, and Latin America
- To analyze subsegments of the market with respect to individual growth trends, prospects, and contributions to the overall market
- To profile the key players of the OSS market and comprehensively analyze their market size and core competencies
- To profile key players and comprehensively analyze their market rankings and core competencies
- To map the companies to get competitive intelligence based on company profiles, key player strategies, and game-changing developments such as product developments, collaborations, and acquisitions
- To track and analyze the competitive developments, such as product enhancements and new product launches; acquisitions; and partnerships and collaborations, in the OSS market globally.
Available Customization
With the given market data, MarketsandMarkets offers customizations based on company-specific needs. The following customization options are available for the report:
Geographic Analysis
- Further breakup of the Asia Pacific market into countries contributing 75% to the regional market size
- Further breakup of the North American market into countries contributing 75% to the regional market size
- Further breakup of the Latin American market into countries contributing 75% to the regional market size
- Further breakup of the Middle Eastern and African market into countries contributing 75% to the regional market size
- Further breakup of the European market into countries contributing 75% to the regional market size
Company Information
- Detailed analysis and profiling of additional market players (up to 5)


 Generating Response ...


Growth opportunities and latent adjacency in Open Source Services Market