Packaging Resins Market by Type (LDPE, PP, HDPE, PET, PS, PVC), Application (Food & Beverage, Consumer Goods, Healthcare, Industrial), and Region (North America, Europe, Asia Pacific, Middle East & Africa, and South America) - Global Forecast to 2022


Packaging Resins Market Size And Forecast
The packaging resins market was valued at USD 166.30 billion in 2016 and is projected to reach USD 277.13 billion by 2022, at a cagr 7.6% during the forecast period. The high demand for packaging resins is due to the changing consumer preference for plastic packaged products, which is the most influencing factor transforming the packaging industry.
Objectives of The Study
- To analyze and forecast the market size for packaging resins, in terms of value and volume
- To provide detailed information about the key factors influencing the growth of the market (drivers, restraints, opportunities, and challenges)
- To define, describe, and forecast the packaging resins market on the basis of type and application
- To forecast the packaging resins market size with respect to 5 main regions, namely, North America, Europe, Asia Pacific, Middle East & Africa, and South America
- To strategically analyze micromarkets with respect to individual growth trends, prospects, and their contribution to the overall market
- To analyze competitive developments, such as joint ventures, mergers & acquisitions, new product launches, regional expansions, and R&D in the packaging resins market
- To analyze the opportunities in the market for stakeholders and provide a competitive landscape for market leaders
- To strategically profile key players and comprehensively analyze their market shares and core competencies
Years considered for this report
- 2016 – Base Year
- 2017 – Estimated Year
- 2022 – Projected Year
Research Methodology
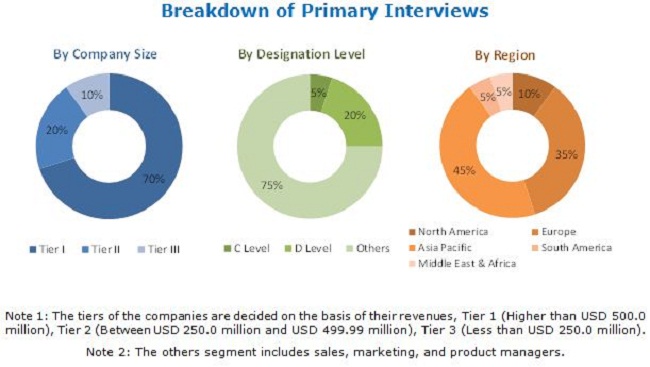
This study estimates the size of the packaging resins market for 2017 and projects its growth by 2022. It provides a detailed qualitative and quantitative analysis of the packaging resins market. Secondary sources, such as D&B Hoovers, Bloomberg Business Week, and Factiva, among others were used to identify and collect information useful for this extensive, commercial study of the packaging resins market. Primary sources, such as experts from related industries and suppliers of packaging resins were interviewed to obtain and verify critical information and assess prospects of the packaging resins market.
To know about the assumptions considered for the study, download the pdf brochure
Key players profiled in the report include ExxonMobil Corporation (US), Sinopec Corporation (China), LyondellBasell Industries Holdings B.V. (Netherlands), SABIC (Saudi Arabia), PetroChina Company Ltd.(China), and DowDupont Inc. (US).
Target Audience:
- Manufacturers of Packaging Resins
- Chemical Suppliers
- Traders, Distributors, and Suppliers of Packaging Resins
- Raw Material Suppliers
- Government and Research Organizations
- Industry Associations
This study answers several questions for stakeholders, primarily which market segments they should focus upon during the next 2 to 5years to prioritize their efforts and investments. It also provides a competitive landscape of the packaging resins market.
Scope of the Report:
The packaging resins market has been segmented as follows:
Packaging Resins Market, by Type:
- Low Density Polyethylene (LDPE)
- Polypropylene (PP)
- High Density Polyethylene (HDPE)
- Polyethylene Terephthalate (PET)
- Polystyrene (PS) & Expanded Polystyrene (EPS)
- Polyvinyl Chloride (PVC)
- Others
Packaging Resins Market, by Application:
- Food & Beverage
- Consumer Goods
- Healthcare
- Industrial
- Others
Packaging Resins Market, by Region:
- Asia Pacific
- Europe
- North America
- Middle East & Africa
- South America
The market has further been analyzed for the key countries in each of these regions.
Available Customizations
Along with the market data, MarketsandMarkets offers customizations as per the specific needs of companies. The following customization options are available for this report:
Product Analysis
- A product matrix that provides a detailed comparison of the product portfolio of each company
Regional Analysis
- Further breakdown of the Rest of Asia Pacific packaging resins market into Australia and New Zealand
The packaging resins market is estimated at USD 192.17 Billion in 2017 and is projected to reach USD 277.13 Billion by 2022, at a CAGR of 7.6% from 2017 to 2022. The high demand for packaging resins in various applications, such as food & beverage, consumer goods, healthcare, industrial, and others are expected to drive the packaging resins market.
Based on type, the packaging resins market has been segmented into LDPE, PP, HDPE, PET, PS & EPS, PVC, and others. LDPE is expected to be the largest type due to its properties, such as flexibility, moisture barrier, toughness, and chemical resistance. The availability of LDPE resins at cheap rates and wide usage in various industries are expected to be the major reasons for the high growth of the packaging resins market.
Based on application, the packaging resins market has been segmented into food & beverage, consumer goods, healthcare, industrial, and others. Packaging resins are widely used in the food & beverage sector, as these increase the shelf life of products, thus protecting food products for longer periods. These factors are expected to drive demand for packaging resins in the food & beverage application.
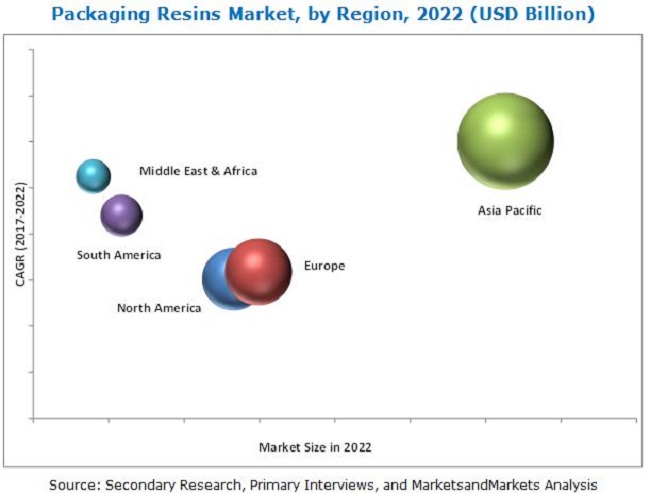
Based on region, the packaging resins market has been segmented into Asia Pacific, North America, Europe, Middle East & Africa, and South America. The packaging resins market in the Asia Pacific is projected to be the largest and fastest-growing, owing to the growing demand from FMCG and food & beverage industries in the region.
The key restraining factor in the packaging resins market is the stringent regulations imposed on plastics due to the landfill issue. Companies, such as ExxonMobil Corporation (US), Sinopec Corporation (China), LyondellBasell Industries Holdings B.V. (Netherlands), SABIC (Saudi Arabia), PetroChina Company Ltd.(China), DowDupont Inc. (US) and others have adopted the new product launches, agreements & partnerships, mergers & acquisitions, and investments & expansions strategies to enhance their foothold in the market.
To speak to our analyst for a discussion on the above findings, click Speak to Analyst
 Exclusive indicates content/data unique to MarketsandMarkets and not available with any competitors.
Table of Contents
1 Introduction (Page No. - 13)
1.1 Objectives of the Study
1.2 Market Definition
1.3 Market Scope
1.3.1 Years Considered for the Study
1.4 Currency
1.5 Units Considered
1.6 Stakeholders
2 Research Methodology (Page No. - 16)
2.1 Research Data
2.1.1 Secondary Data
2.1.1.1 Key Data From Secondary Sources
2.1.2 Primary Data
2.1.2.1 Key Data From Primary Sources
2.1.2.2 Key Industry Insights
2.2 Market Size Estimation
2.3 Data Triangulation
2.4 Research Assumptions
2.5 Limitations
3 Executive Summary (Page No. - 23)
4 Premium Insights (Page No. - 26)
4.1 Significant Opportunities in the Packaging Resins Market
4.2 Packaging Resins Market, By Application
4.3 APAC: Packaging Resins Market, By Application and Country
4.4 Packaging Resins Market, By Type
4.5 Packaging Resins Market, By Region
5 Market Overview (Page No. - 29)
5.1 Introduction
5.2 Market Dynamics
5.2.1 Drivers
5.2.1.1 Downsizing of Packaging Materials
5.2.1.2 Cost-Effectiveness & Increased Shelf-Life of Products
5.2.2 Restraints
5.2.2.1 Rising Concerns Pertaining to Plastic Disposal
5.2.3 Opportunities
5.2.3.1 Growing Demand for Sustainable Packaging Solutions
5.2.3.2 Modern Packaging Technologies
5.2.4 Challenges
5.2.4.1 Recyclability of Flexible Plastics
5.3 Porter’s Five Forces Analysis
5.3.1 Threat of New Entrants
5.3.2 Threat of Substitutes
5.3.3 Bargaining Power of Buyers
5.3.4 Bargaining Power of Suppliers
5.3.5 Intensity of Competitive Rivalry
5.4 Macroeconomic Indicators
5.4.1 Trends in Plastic Industry
6 Packaging Resins Market, By Type (Page No. - 37)
6.1 Introduction
6.2 LDPE
6.3 PP
6.4 HDPE
6.5 PET
6.6 PS & EPS
6.7 PVC
6.8 Others
7 Packaging Resins Market, By Application (Page No. - 41)
7.1 Introduction
7.2 Food & Beverage
7.3 Consumer Goods
7.4 Healthcare
7.5 Industrial
7.6 Others
8 Packaging Resins Market, By Region (Page No. - 45)
8.1 Introduction
8.2 North America
8.2.1 US
8.2.2 Canada
8.2.3 Mexico
8.3 Europe
8.3.1 Germany
8.3.2 Russia
8.3.3 Italy
8.3.4 France
8.3.5 UK
8.3.6 Rest of Europe
8.4 APAC
8.4.1 China
8.4.2 Japan
8.4.3 India
8.4.4 South Korea
8.4.5 Indonesia
8.4.6 Rest of APAC
8.5 Middle East & Africa
8.5.1 Turkey
8.5.2 Iran
8.5.3 Rest of Middle East & Africa
8.6 South America
8.6.1 Brazil
8.6.2 Argentina
8.6.3 Rest of South America
9 Competitive Landscape (Page No. - 76)
9.1 Overview
9.2 Market Ranking
9.3 Competitive Scenario
9.3.1 New Product Launch
9.3.2 Investment & Expansion
9.3.3 Agreement & Partnership
9.3.4 Merger & Acquisition
10 Company Profiles (Page No. - 82)
(Business Overview, Products Offered, SWOT Analysis, and MnM View)*
10.1 Sinopec Corporation
10.2 Exxonmobil Chemical
10.3 Lyondellbasell Industries Holdings B.V
10.4 SABIC
10.5 Petrochina Ltd.
10.6 Borealis AG
10.7 Braskem S.A.
10.8 Dowdupont Inc.
10.9 Indorama Ventures Public Company Ltd.
10.10 M&G Chemicals
*Details on Business Overview, Products Offered, SWOT Analysis, and MnM View Might Not Be Captured in Case of Unlisted Companies.
10.11 Other Market Players
10.11.1 Arkema S.A.
10.11.2 BASF SE
10.11.3 Borouge
10.11.4 DAK Americas LLC
10.11.5 Far Eastern New Century Corporation
10.11.6 Ineos Group AG
10.11.7 Jiangsu Sanfangxiang Group Co., Ltd.
10.11.8 Reliance Industries Ltd.
10.11.9 Styrolution Group GmbH
10.11.10 Total S.A.
11 Appendix (Page No. - 102)
11.1 Insights From Industry Experts
11.2 Discussion Guide
11.3 Knowledge Store: Marketsandmarkets Subscription Portal
11.4 Introducing RT: Real-Time Market Intelligence
11.5 Available Customizations
11.6 Related Reports
11.7 Author Details
List of Tables (73 Tables)
Table 1 Plastic Industry Demand, By Country (Kiloton)
Table 2 Packaging Resins By Market Size, By Type, 2015–2022 (USD Million)
Table 3 Packaging Resins By Market Size, By Type, 2015–2022 (Kiloton)
Table 4 Packaging Resins By Market Size, By Application, 2015–2022 (USD Million)
Table 5 Packaging Resins By Market Size, By Application, 2015–2022 (Kiloton)
Table 6 Global Packaging Resins Market Size, By Region, 2015–2022 (USD Million)
Table 7 Global Packaging Resins Market Size, By Region, 2015–2022 (Kiloton)
Table 8 North America: By Market Size, By Country, 2015–2022 (USD Million)
Table 9 North America: By Market Size, By Country, 2015–2022 (Kiloton)
Table 10 North America: By Market Size, By Application, 2015–2022 (USD Million)
Table 11 North America: By Market Size, By Application, 2015–2022 (Kiloton)
Table 12 US: By Market Size, By Application, 2015–2022 (USD Million)
Table 13 US: By Market Size, By Application, 2015–2022 (Kiloton)
Table 14 Canada: By Market Size, By Application, 2015–2022 (USD Million)
Table 15 Canada: By Market Size, By Application, 2015–2022 (Kiloton)
Table 16 Mexico: By Market Size, By Application, 2015–2022 (USD Million)
Table 17 Mexico: By Market Size, By Application, 2015–2022 (Kiloton)
Table 18 Europe: By Market Size, By Country, 2015–2022 (USD Million)
Table 19 Europe: By Market Size, By Country, 2015–2022 (Kiloton)
Table 20 Europe: By Market Size, By Application, 2015–2022 (USD Million)
Table 21 Europe: By Market Size, By Application, 2015–2022 (Kiloton)
Table 22 Germany: By Market Size, By Application, 2015–2022 (USD Million)
Table 23 Germany: By Market Size, By Application, 2015–2022 (Kiloton)
Table 24 Russia: By Market Size, By Application, 2015–2022 (USD Million)
Table 25 Russia: By Market Size, By Application, 2015–2022 (Kiloton)
Table 26 Italy: By Market Size, By Application, 2015–2022 (USD Million)
Table 27 Italy: By Market Size, By Application, 2015–2022 (Kiloton)
Table 28 France: By Market Size, By Application, 2015–2022 (USD Million)
Table 29 France: By Market Size, By Application, 2015–2022 (Kiloton)
Table 30 UK: By Market Size, By Application, 2015–2022 (USD Million)
Table 31 UK: By Market Size, By Application, 2015–2022 (Kiloton)
Table 32 Rest of Europe: By Market Size, By Application, 2015–2022 (USD Million)
Table 33 Rest of Europe: By Market Size, By Application, 2015–2022 (Kiloton)
Table 34 APAC: By Market Size, By Country, 2015–2022 (USD Million)
Table 35 APAC: By Market Size, By Country, 2015–2022 (Kiloton)
Table 36 APAC: By Market Size, By Application, 2015–2022 (USD Million)
Table 37 APAC: By Market Size, By Application, 2015–2022 (Kiloton)
Table 38 China: By Market Size, By Application, 2015–2022 (USD Million)
Table 39 China: By Market Size, By Application, 2015–2022 (Kiloton)
Table 40 Japan: By Market Size, By Application, 2015–2022 (USD Million)
Table 41 Japan: By Market Size, By Application, 2015–2022 (Kiloton)
Table 42 India: By Market Size, By Application, 2015–2022 (USD Million)
Table 43 India: By Market Size, By Application, 2015–2022 (Kiloton)
Table 44 South Korea: By Market Size, By Application, 2015–2022 (USD Million)
Table 45 South Korea: By Market Size, By Application, 2015–2022 (Kiloton)
Table 46 Indonesia: By Market Size, By Application, 2015–2022 (USD Million)
Table 47 Indonesia: By Market Size, By Application, 2015–2022 (Kiloton)
Table 48 Rest of APAC: By Market Size, By Application, 2015–2022 (USD Million)
Table 49 Rest of APAC: By Market Size, By Application, 2015–2022 (Kiloton)
Table 50 Middle East & Africa: By Market Size, By Country, 2015–2022 (USD Million)
Table 51 Middle East & Africa: By Market Size, By Country, 2015–2022 (Kiloton)
Table 52 Middle East & Africa: By Market Size, By Application, 2015–2022 (USD Million)
Table 53 Middle East & Africa: By Market Size, By Application, 2015–2022 (Kiloton)
Table 54 Turkey: By Market Size, By Application, 2015–2022 (USD Million)
Table 55 Turkey: By Market Size, By Application, 2015–2022 (Kiloton)
Table 56 Iran: By Market Size, By Application, 2015–2022 (USD Million)
Table 57 Iran: By Market Size, By Application, 2015–2022 (Kiloton)
Table 58 Rest of Middle East & Africa: By Market Size, By Application, 2015–2022 (USD Million)
Table 59 Rest of Middle East & Africa: By Market Size, By Application, 2015–2022 (Kiloton)
Table 60 South America: By Market Size, By Country, 2015–2022 (USD Million)
Table 61 South America: By Market Size, By Country, 2015–2022 (Kiloton)
Table 62 South America: By Market Size, By Application, 2015–2022 (USD Million)
Table 63 South America: By Market Size, By Application, 2015–2022 (Kiloton)
Table 64 Brazil: By Market Size, By Application, 2015–2022 (USD Million)
Table 65 Brazil: By Market Size, By Application, 2015–2022 (Kiloton)
Table 66 Argentina: By Market Size, By Application, 2015–2022 (USD Million)
Table 67 Argentina: By Market Size, By Application, 2015–2022 (Kiloton)
Table 68 Rest of South America: By Market Size, By Application, 2015–2022 (USD Million)
Table 69 Rest of South America: By Market Size, By Application, 2015–2022 (Kiloton)
Table 70 New Product Launch, 2015–2018
Table 71 Investment & Expansion, 2015–2018
Table 72 Agreement & Partnership, 2015–2018
Table 73 Merger & Acquisition, 2015–2018
List of Figures (36 Figures)
Figure 1 Packaging Resins By Market Segmentation
Figure 2 Packaging Resins By Market: Research Design
Figure 3 Breakdown of Primary Interviews
Figure 4 Market Size Estimation: Bottom-Up Approach
Figure 5 Market Size Estimation: Top-Down Approach
Figure 6 Packaging Resins Market: Data Triangulation
Figure 7 LDPE to Lead the Packaging Resins Market
Figure 8 Food & Beverage Application to Dominate the Packaging Resins Market
Figure 9 APAC Led the Packaging Resins Market in 2016
Figure 10 Emerging Economies to Offer Lucrative Growth Opportunities to Market Players
Figure 11 Healthcare to Be the Fastest-Growing Application in Packaging Resins Market
Figure 12 Food & Beverage to Be the Largest Application in the Packaging Resins Market
Figure 13 LDPE to Account for the Largest Market Share
Figure 14 APAC Accounted for the Largest Share in the Packaging Resins Market
Figure 15 Drivers, Restraints, Opportunities, and Challenges in the Packaging Resins Market
Figure 16 Packaging Resins Market: Porter’s Five Forces Analysis
Figure 17 LDPE to Lead the Packaging Resins Market
Figure 18 Food & Beverage Application to Dominate the Packaging Resins Market
Figure 19 India to Register Fastest Growth in Packaging Resins Market Between 2017 and 2022
Figure 20 North America: Packaging Resins Market Snapshot
Figure 21 APAC: Packaging Resins Market Snapshot
Figure 22 Companies Adopted New Product Launch as the Key Growth Strategy
Figure 23 Ranking of Key Market Players, 2016
Figure 24 Sinopec Corporation: Company Snapshot
Figure 25 Sinopec Corporation: SWOT Analysis
Figure 26 Exxonmobil Chemical: Company Snapshot
Figure 27 Exxonmobil Chemical: SWOT Analysis
Figure 28 Lyondellbasell Industries Holdings B.V: Company Snapshot
Figure 29 Lyondellbasell Industries Holdings B.V: SWOT Analysis
Figure 30 SABIC: Company Snapshot
Figure 31 SABIC: SWOT Analysis
Figure 32 Petrochina Ltd.: Company Snapshot
Figure 33 Petrochina Ltd.: SWOT Analysis
Figure 34 Borealis AG : Company Snapshot
Figure 35 Braskem S.A.: Company Snapshot
Figure 36 Indorama Ventures Public Company Ltd.: Company Snapshot


Growth opportunities and latent adjacency in Packaging Resins Market