Extensive secondary sources, directories, and databases such as Hoovers, Bloomberg BusinessWeek, Factiva, and OneSource have been used to identify and collect information for this technical, market-oriented, and commercial study of the protective packaging market. In-depth interviews were conducted with various primary respondents, which included key industry participants, subject matter experts (SMEs), C-level executives of key industry players, and industry consultants, among other experts, to obtain and verify critical qualitative and quantitative information and to assess prospects.
Secondary Research
In the secondary research process, various secondary sources have been referred to for identifying and collecting information for this study. Secondary sources included annual reports, press releases, and investor presentations of companies; white papers; publications from recognized websites; and databases. Secondary research has mainly been used to obtain key information about the supply chain of the industry, the total pool of key players, market classification & segmentation according to the industry trends to the bottom-most level, regional markets, and key developments from both market- and technology-oriented perspectives.
The market size of protective packaging has been estimated based on secondary data available through paid and unpaid sources and by analyzing the product portfolios of key companies. This data has been further validated through various primary sources.
Primary Research
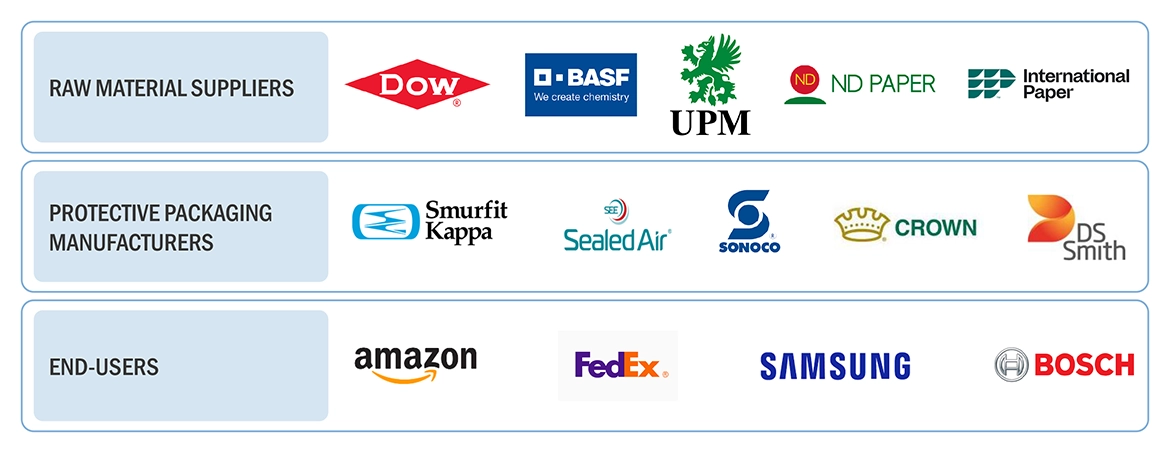
The protective packaging market comprises various stakeholders in the supply chain and includes suppliers, manufacturers, and end-users. Various primary sources from the supply and demand sides of the protective packaging market have been interviewed to obtain qualitative and quantitative information. Primary participants from the supply side include key opinion leaders, executives, vice presidents, and CEOs of companies in the market. Primary sources from the demand side include experts from end-use industries, associations and institutions involved in the market, and key opinion leaders.
Following is the breakdown of primary respondents

To know about the assumptions considered for the study, download the pdf brochure
Market Size Estimation
The supply-side and demand-side approaches have been extensively used, along with several data triangulation methods, for market size estimation and forecast of the overall market segments listed in this report. Extensive qualitative and quantitative data were analyzed to list key information/insights throughout the report. The research methodology used to estimate the market size includes the following:
-
The bottom-up and top-down approaches have been used to estimate the protective packaging market by type, material, application, function, and region. The research methodology used to calculate the market size includes the following steps:
-
The key players in the protective packaging market have been identified through secondary research, and their revenues have been determined through primary and secondary research.
-
The market size of protective packaging has been derived from the aggregation of the market shares of the leading players, and the forecast is based on the analysis of market trends, such as the pricing and consumption of protective packaging in various end-use industries.
-
The market size of protective packaging, by region, has been calculated using the market sizes of each material in each application segment.
-
The market size for protective packaging for each material, in terms of value, has been calculated by multiplying the average price of the product types with their volumes
Approach 1: Market Size Estimation: Bottom-Up Approach

To know about the assumptions considered for the study, Request for Free Sample Report
Approach 2: Market Size Estimation: Top-Down Approach

Data Triangulation
After arriving at the overall market size, the overall market has been split into several segments. To complete the market engineering process and arrive at the exact statistics for all segments, the data triangulation and market breakdown procedures have been employed, wherever applicable. The data has been triangulated by studying various factors and trends from the demand and supply sides. Along with this, the market has been validated using both the top-down and bottom-up approaches. It has been then verified through primary interviews. Hence, for every data segment, there are three sources — the top-down approach, the bottom-up approach, and expert interviews. The data is assumed correct only when the values arrived at from these three sources match.
Market Definition
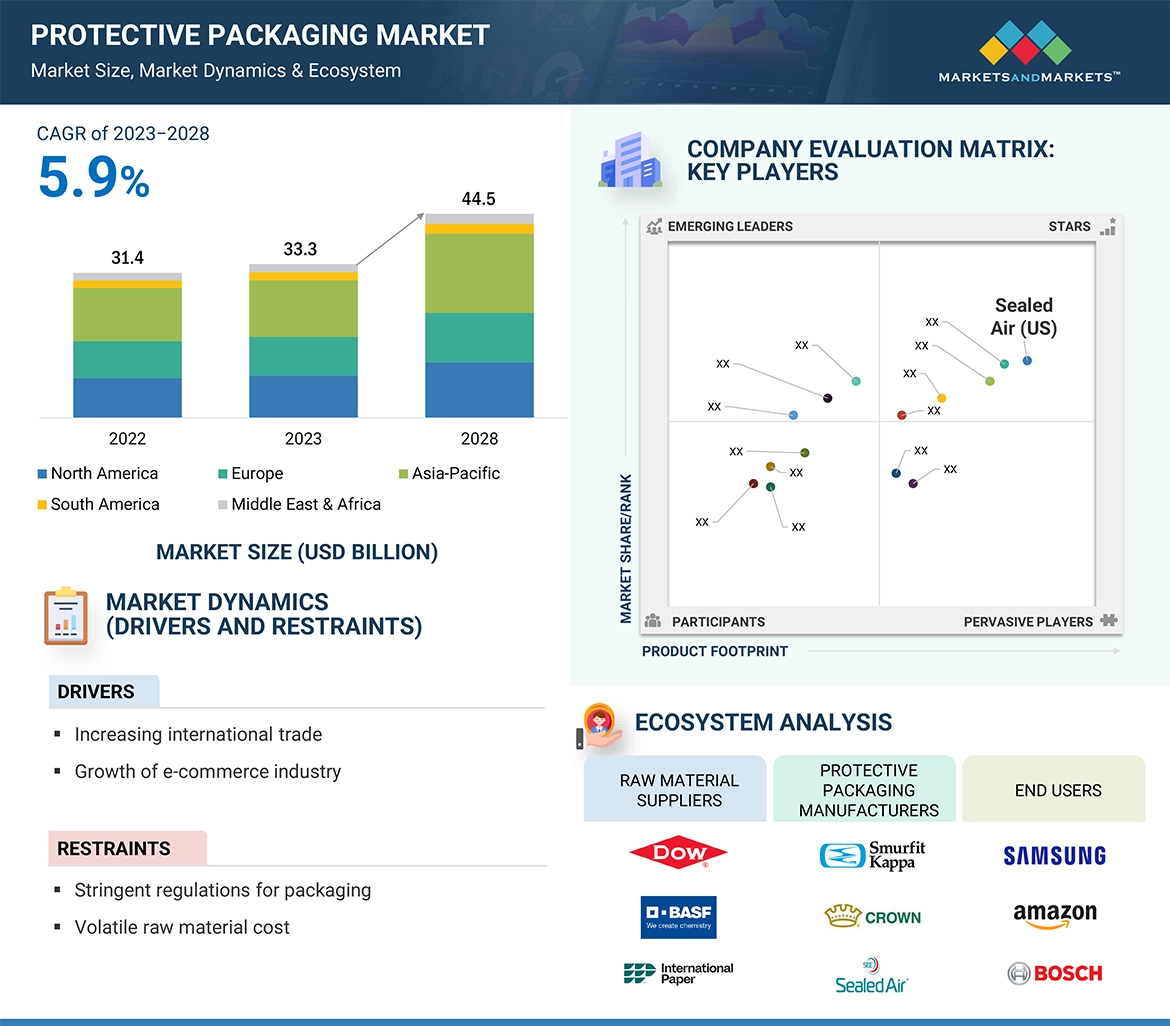
Protective packaging is used to protect the product from damages such as shock, vibration, moisture, and compression during transportation, handling, and storage of products at warehouses. It offers features such as thermal & electrical insulation, shock dampening, fireproofing, and atmospheric protection to packed products.
Key stakeholders
-
Raw material suppliers and producers
-
Protective packaging manufacturers, dealers, and suppliers
-
Regulatory bodies
-
Protective packaging distributors/suppliers
-
Local government
-
Industry associations
-
Investment banks
-
Consulting companies/Consultants in Packaging Sectors
-
Raw material providers
Report Objectives
-
To define, describe, and forecast the protective packaging market in terms of value and volume
-
To elaborate drivers, restraints, opportunities, and challenges in the market
-
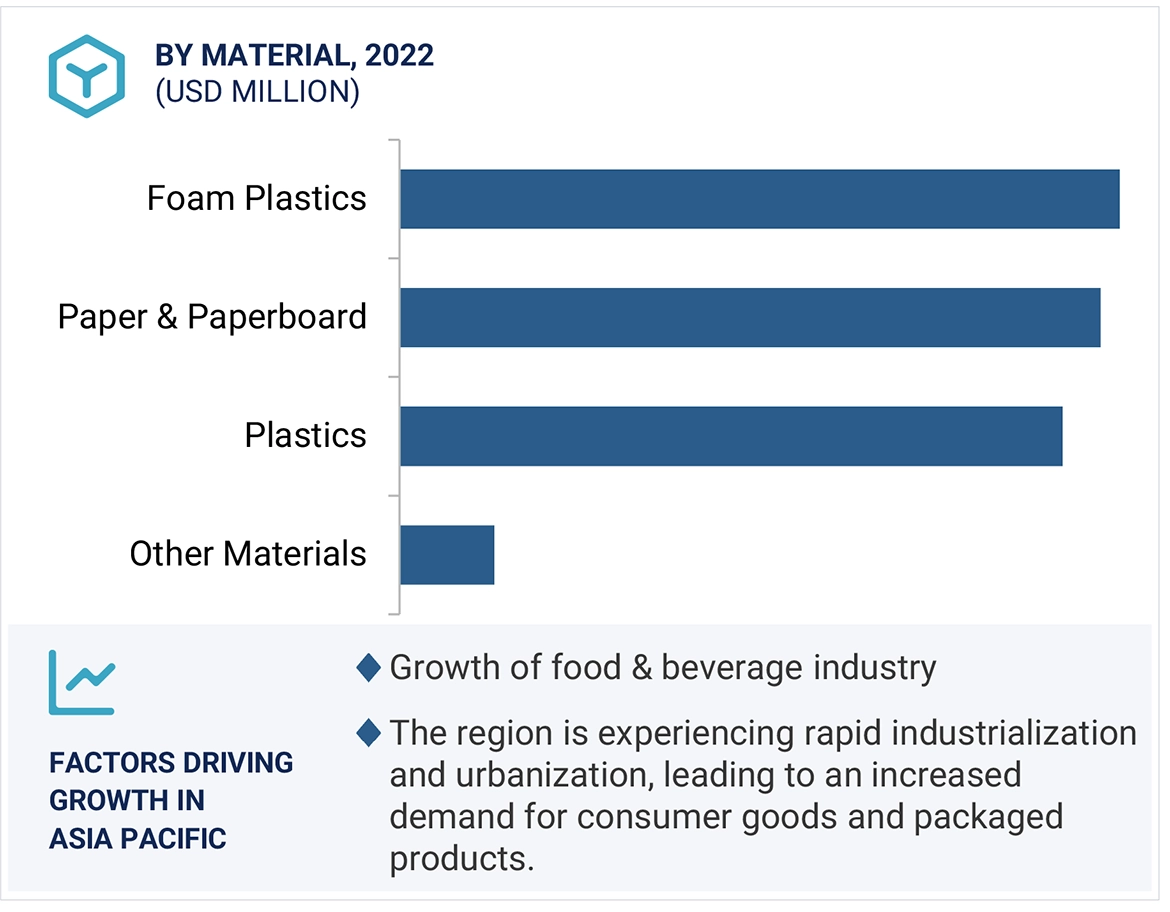
To analyze and forecast the market size, based on type, material, application, and function
-
To forecast the market size, along with segments and submarkets, in key regions: North America, Europe, Asia Pacific, the Middle East & Africa, and South America with their key countries
-
To strategically analyze micromarkets with respect to individual growth trends, prospects, and their contribution to the total market
-
To analyze growth opportunities in the market for stakeholders and provide details on the competitive landscape for market leaders
-
To strategically profile key players and comprehensively analyze their market shares and core competencies
-
To analyze competitive developments such as merger & acquisition, expansion & investment, agreement, partnership & joint venture, and new product development in the market
Available Customizations:
Along with the given market data, MarketsandMarkets offers customizations as per the specific needs of the companies. The following customization options are available for the report:
Product Analysis:
-
Product Matrix, which gives a detailed comparison of the product portfolio of each company
Regional Analysis:
-
Further breakdown of the Rest of the Asia Pacific, protective packaging market
-
Further breakdown of the Rest of Europe, protective packaging market
-
Further breakdown of the Rest of South America, protective packaging market
-
Further breakdown of the Rest of Middle East & Africa, protective packaging market
Company Information:
-
Detailed analysis and profiling of additional market players (up to 5)


Growth opportunities and latent adjacency in Protective Packaging Market