PEGylated Proteins Market by Consumables (PEGylation Kits, Reagents), Services, Protein Type (mAbs, Interferons), Application (Cancer Treatment, Chronic Kidney Diseases), End-User (Pharmaceutical & Biotechnology Companies)- Global Forecast to 2021


The global PEGylated proteins market size is projected to grow at a CAGR of 10.5%. PEGylation of therapeutic proteins is becoming increasingly essential because of PEG's ability to protect against protein enzymatic degradation and increasing half-life of drugs.
Increase in R&D spending of pharmaceutical & biotechnology companies, growth in biologics sector, high prevalence of lifestyle disease, increasing in adoption of protein based drugs over non-protein based drugs and increase of protein stability and circulating half-life with the help of PEGylation are the major drivers of market. On the other hand drug failure and recalls is the major factor restraining the growth of this market.
This report segments the PEGylated proteins market by product, protein type, application, end-user, and geography. By product, the market includes consumables, and services. The consumables segment is further divided into PEGylation reagents and PEGylation kits. The protein type segments included in this report are colony stimulating factors, interferons, erythropoietin, mAbs, and recombinant factor VIII. The application segments include cancer treatment, hepatitis, chronic kidney diseases, hemophilia, multiple sclerosis, and gastrointestinal disorders. The end-user segments included in this report are pharmaceutical & biotechnology companies, CROs, and academic research institutes.
A combination of bottom-up and top-down approaches was used to calculate the market sizes and growth rates of the global PEGylated proteins market and its subsegments. All percentage shares, splits, and breakdowns were determined using secondary sources and verified through primary sources. All possible parameters that affect the markets covered in this research study have been accounted for, viewed in extensive detail, verified through primary research, and analyzed to get the final quantitative and qualitative data. Primary interviews with key opinion leaders were also used to determine the percentage shares of each subsegment and the relative differences in growth rates.
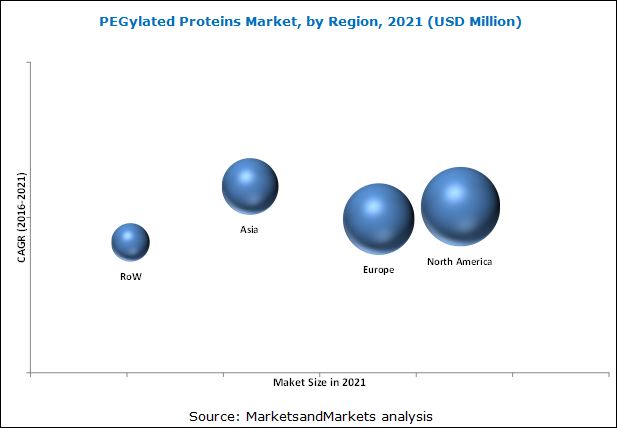
Geographic analysis reveals that North America accounted for the largest share of the PEGylation proteins market. Growth in this market can be attributed to the increasing adoption of biologics drugs such as monoclonal antibodies, erythropoietin and interferon for the treatment of chronic diseases, increasing government funding and grants for research activities, and increase in R&D spending for drug discovery at early stages.
The major players in PEGylated proteins market include Merck Millipore (U.S.), Thermo Fisher Scientific, Inc. (U.S.), NOF Corporation (Japan), JenKem Technology USA, Inc. (U.S.), Creative PEGworks (U.S), Celares GmbH (Germany), Quanta BioDesign, Ltd. (U.S.), Biomatrik, Inc, (China), Iris Biotech GmbH (Germany) , Laysan Bio, Ltd. (U.S.).
Target audience for this report
- Academic research institutes
- Pharmaceutical companies
- Biotechnology Companies
- PEGylation products manufacturing companies
- Contract research organizations (CROs)
- Market research & consulting firms
PEGylated Proteins Market Report Scope
This research report categorizes the global PEGylated proteins market into the following segments and subsegments:
By Product
-
Consumables
-
PEGylation Reagents
- Monofunctional Linear PEGs
- Bifunctional PEGs
- Multi-Arm PEGs
- Branched PEGs
- Other PEGylation Reagents
- PEGylation Kits
-
PEGylation Reagents
- Services
By Protein Type
- Colony Stimulating Factors
- Interferons
- Erythropoietin
- mAbs
- Recombinant Factor VIII
- Other Protein Type
By Application
- Cancer Treatment
- Hepatitis
- Chronic Kidney Diseases
- Hemophilia
- Multiple Sclerosis
- Gastrointestinal Disorders
- Other Applications
By End-User
- Pharmaceutical & Biotechnology Companies
- CROs
- Academic Research Institutes
By Geography
-
North America
- U.S.
- Canada
- Europe
- Asia
- Rest of the World
Available Customizations
With the given market data, MarketsandMarkets offers customizations as per the company’s specific needs. The following customization options are available for the report:
Geographic Analysis
- Further breakdown of the PEGylated proteins market into specific countries/regions in Asia, Europe, and Rest of The World
Company Information
- Detailed analysis and profiling of additional market players (Up to 5)
The report provides a granular understanding of the market. This report segments the global PEGylation of proteins market, on the basis of product, protein type, application, end-user and geography. The product segments included in this report are consumables and services. The consumables segment is further segmented into PEGylation reagents, and PEGylation kits. The consumables segment accounts for the largest share of the global market owing to the increasing adoption of kit-based PEGylation products.
The protein type segment includes colony stimulating factors, interferons, erythropoietin, mAbs, and recombinant factor VIII. The colony stimulating factors segment is expected to grow at the highest rate among the protein type segments, owing to the increasing incidence of cancer across the globe and also to enhance the chemotherapy process. The application segment is segmented into cancer treatment, hepatitis, chronic kidney diseases, hemophilia, multiple sclerosis, and gastrointestinal disorders. The end-user segments included in this report are pharmaceutical & biotechnology companies, CROs, and academic research institutes.
The geographic segments included in this report are North America, Europe, Asia, and the Rest of the World (RoW). The report maps each product, protein type, application and end-user segment in 6 geographic and regional segments. Geographic analysis reveals that North America accounted for the largest share of the global PEGylated proteins market. Growth in this market can be attributed to the increased adoption of biologics drugs such as monoclonal antibodies, erythropoietin and interferon for the treatment of chronic diseases; increasing government funding and grants for research activities, and increasing R&D spending for drug discovery at early stages. Similarly Asia is estimated to be the fastest growing market of the global market. The wide applications of PEGylated proteins in treating cancer, blood disorder, chronic and autoimmune disease are expected to drive the demand for market in this region.
The major players in PEGylated proteins market include Merck Millipore (U.S.), Thermo Fisher Scientific, Inc. (U.S.), NOF Corporation (Japan), JenKem Technology USA, Inc. (U.S.), Creative PEGworks (U.S), Celares GmbH (Germany), Quanta BioDesign, Ltd. (U.S.), Biomatrik, Inc, (China), Iris Biotech GmbH (Germany), Laysan Bio, Ltd. (U.S.).
Frequently Asked Questions (FAQ):
What is the size of PEGylated Proteins Market ?
The global PEGylated Proteins Market size is growing at a CAGR of 10.5%
What are the major growth factors of PEGylated Proteins Market ?
Increase in R&D spending of pharmaceutical & biotechnology companies, growth in biologics sector, high prevalence of lifestyle disease, increasing in adoption of protein based drugs over non-protein based drugs and increase of protein stability and circulating half-life with the help of PEGylation are the major drivers of market. On the other hand drug failure and recalls is the major factor restraining the growth of this market.
Who all are the prominent players of PEGylated Proteins Market ?
The major players in PEGylated proteins market include Merck Millipore (U.S.), Thermo Fisher Scientific, Inc. (U.S.), NOF Corporation (Japan), JenKem Technology USA, Inc. (U.S.), Creative PEGworks (U.S), Celares GmbH (Germany), Quanta BioDesign, Ltd. (U.S.), Biomatrik, Inc, (China), Iris Biotech GmbH (Germany), Laysan Bio, Ltd. (U.S.). .
To speak to our analyst for a discussion on the above findings, click Speak to Analyst
 Exclusive indicates content/data unique to MarketsandMarkets and not available with any competitors.
Table of Contents
1 Introduction (Page No. - 10)
1.1 Objectives of the Study
1.2 Market Definition
1.3 Market Scope
1.3.1 Markets Covered
1.3.2 Years Considered in the Report
1.4 Currency
1.5 Limitations
1.6 Stakeholders
2 Research Methodology (Page No. - 14)
2.1 Market Size Estimation
2.2 Market Breakdown and Data Triangulation
2.3 Market Share Estimation
2.3.1 Key Data From Secondary Sources
2.3.2 Key Data From Primary Sources
2.3.3 Assumptions for the Study
3 Executive Summary (Page No. - 21)
3.1 Introduction
3.2 Current Scenario
3.3 Future Outlook
3.4 Conclusion
4 Premium Insights (Page No. - 28)
4.1 Global PEGylated Proteins Market Overiew
4.2 PEGylated Proteins Market: By End-User & Region
4.3 PEGylated Proteins Market: Geographic Snapshot
4.4 Life Cycle Analysis, By Region (2016)
5 Industry Insights (Page No. - 32)
5.1 Introduction
5.2 Market Indicators
5.2.1 Increasing R&D Spending in Pharmaceutical and Biotechnology Sector
5.3 Strategic Benchmarking
5.3.1 Agreement & Collaboration
5.4 Porter’s Five Forces Analysis
5.4.1 Threat From New Entrants
5.4.2 Threat From Substitutes
5.4.3 Bargaining Power of Suppliers
5.4.4 Bargaining Power of Buyers
5.4.5 Intensity of Competitive Rivalry
5.5 Regulatory Scenario
5.6 Pipeline Analysis
6 Global PEGylation of Proteins Market, Overview (Page No. - 41)
6.1 Introduction
6.2 Market Dynamics
6.2.1 Drivers
6.2.1.1 Increase in R&D Spending
6.2.1.2 Growth in Biologics Sector to Propel the PEGylated Proteins Market
6.2.1.3 Increase in Adoption of Protein-Based Drugs Over Non-Protein-Based Drugs
6.2.1.4 Increasing Protein’s Stability and Circulating Half-Life
6.2.1.5 High Prevalence Rate of Lifestyle Diseases
6.2.2 Restraints
6.2.2.1 Drug Failure and Recalls Hinders Market Growth
6.2.3 Opportunities
6.2.3.1 Rising Opportunities in Emerging Markets
6.2.3.2 Top-Selling Biologics Drugs Going Off–Patent in the Near Future
6.2.4 Challenge
6.2.4.1 Increasing Market Consolidation Increases Entry Barriers and Restraints Market Growth
7 PEGylated Proteins Market, By Product (Page No. - 48)
7.1 Introduction
7.2 Consumbales
7.2.1 Pegylation Kits
7.2.2 Pegylation Reagents
7.2.2.1 Monofunctional Linear Pegs
7.2.2.2 Bifunctional Pegs
7.2.2.3 Multi-Arm Pegs
7.2.2.4 Branched Pegs
7.2.2.5 Other Pegylation Reagents
7.3 Services
7.3.1 Development of PEGylated Biosimilars
7.3.2 Process Development of Peg-Drug Conjugate Manufacturing
7.3.3 Pilot Production of Peg Drug Conjugate
7.3.4 Development of Analytical Methods
7.3.5 Pegylation Feasibility Studies
8 PEGylated Proteins Market, By Protein Type (Page No. - 66)
8.1 Key Findings
8.2 Introduction
8.3 Colongy Stimulating Factors
8.4 Interferons
8.5 Erythropoietin (EPO)
8.6 Recombinant Factor Viii
8.7 Monoclonal Antibodies
8.8 Other Protein Type
9 PEGylated Proteins Market, By Application (Page No. - 77)
9.1 Key Findings
9.2 Introduction
9.3 Cancer Treatment
9.4 HEPAtitis
9.5 Chronic Kidney Disease
9.6 Hemophilia
9.7 Multiple Sclerosis
9.8 Gastrointestinal Disorder
9.9 Other Application
10 Global PEGylation of Proteins Market, By End-User (Page No. - 89)
10.1 Key Findings
10.2 Introduction
10.3 Pharmaceutical & Biotechnology Companies
10.4 Contract Research Organization
10.5 Academic Research Institutes
11 PEGylated Proteins Market, By Region (Page No. - 96)
11.1 Introduction
11.2 North America
11.2.1 U.S.
11.2.2 Canada
11.3 Europe
11.4 Asia
11.5 Rest of the World
12 Global PEGylation of Proteins Market, Competitive Landscape (Page No. - 135)
12.1 Introduction
12.2 Strategic Analysis
12.3 Market Share Analysis
12.4 Competitive Situation and Trends
12.4.1 Agreements & Collaboration
12.4.2 New Product Launches and Product Showcase
12.4.3 Acquisitions
12.4.4 Product Upgradation
13 Company Profiles (Page No. - 142)
13.1 Introduction
13.2 Merck Millipore
13.2.1 Business Overview
13.2.2 Products Offered
13.2.3 Recent Developments
13.2.4 MnM View
13.2.4.1 Financial Analysis
13.2.4.2 Strategic Analysis
13.3 Thermo Fisher Scientific Inc.
13.3.1 Business Overview
13.3.2 Products Offered
13.3.3 Recent Developments
13.3.4 MnM View
13.3.4.1 Financial Analysis
13.3.4.2 Strategic Analysis
13.4 NOF American Corporation (A Subsidiary of NOF Corporation)
13.4.1 Business Overview
13.4.2 Products Offered
13.4.3 Recent Developments
13.4.4 MnM View
13.4.4.1 Financial Analysis
13.4.4.2 Strategic Analysis
13.5 Jenkem Technology
13.5.1 Business Overview
13.5.2 Products Offered
13.5.3 Recent Developments
13.5.3.1 Strategic Analysis
13.6 Creative Pegworks
13.6.1 Business Overview
13.6.2 Products Offered
13.6.3 Recent Developments
13.7 Celares GmbH
13.7.1 Business Overview
13.7.2 Products Offered
13.7.3 Recent Developments
13.8 Quanta Biodesign, Ltd
13.8.1 Business Overview
13.8.2 Products Offered
13.8.3 Recent Developments
13.9 Biomatrik, Inc.
13.9.1 Business Overview
13.9.2 Products Offered
13.9.3 Recent Developments
13.10 Iris Biotech GmbH
13.10.1 Business Overview
13.10.2 Products Offered
13.10.3 Recent Developments
13.11 Laysan Bio, Inc.
13.11.1 Business Overview
13.11.2 Products Offered
13.11.3 Recent Developments
14 Appendix (Page No. - 168)
14.1 Insights of Industry Experts
14.2 Discussion Guide
14.3 Knowledge Store: Marketsandmarkets’ Subscription Portal
14.4 Introducing RT: Real-Time Market Intelligence
14.5 Available Customizations
14.6 Related Reports
List of Tables (87 Tables)
Table 1 PEGylated Proteins Market Summary
Table 2 PEGylation of Proteins Market Size, By Product, 2014–2021 (USD Million)
Table 3 Market Size for Consumables, By Type, 2014–2021 (USD Million)
Table 4 Market Size for Consumables, By Region, 2014–2021 (USD Million)
Table 5 North America: Market Size for Consumables, By Region, 2014–2021 (USD Million)
Table 6 Market Size for Pegylation Kits, By Region, 2014–2021 (USD Million)
Table 7 North America: Market Size for Pegylation Kits, By Region, 2014–2021 (USD Million)
Table 8 Market Size for Pegylation Reagents, By Region, 2014–2021 (USD Million)
Table 9 North America: Market Size for Pegylation Reagents, By Region, 2014–2021 (USD Million)
Table 10 Market Size for Services, By Region, 2014–2021 (USD Million)
Table 11 North America: Market Size for Services, By Region, 2014–2021 (USD Million)
Table 12 Market Size for Development of PEGylated Biosimilars, By Region, 2014–2021 (USD Million)
Table 13 North America: Market Size for Development of PEGylated Biosimilars, By Region, 2014–2021 (USD Million)
Table 14 PEGylation of Proteins Market Size for Process Development of Peg-Conjugate Manufactuirng , By Region, 2014–2021 (USD Million)
Table 15 North America: Market Size for Process Development of Peg-Conjugate Manufactuirng, By Region, 2014–2021 (USD Million)
Table 16 Market Size for Pilot Production of Peg Drug Conjugate, By Region, 2014–2021 (USD Million)
Table 17 North America: Market Size for Pilot Production of Peg Drug Conjugate, By Region, 2014–2021 (USD Million)
Table 18 Market Size for Development of Analytical Methods, By Region, 2014–2021 (USD Million)
Table 19 North America: Market Size for Development of Analytical Methods, By Region, 2014–2021 (USD Million)
Table 20 Market Size for PEGylation Feasibility Studies , By Region, 2014–2021 (USD Million)
Table 21 North America: Market Size for PEGylation Feasibility Studies, By Region, 2014–2021 (USD Million)
Table 22 Colony Stimulating Factors Market Size, By Protein Type, 2014–2021 (USD Million)
Table 23 Market Size for Colony Stimulating Factors, By Region, 2014–2021 (USD Million)
Table 24 North America: Market Size for Colony Stimulating Factors, By Region, 2014–2021 (USD Million)
Table 25 Market Size for Interferon, By Region, 2014–2021 (USD Million)
Table 26 North America: Market Size for Interferon, By Region, 2014–2021 (USD Million)
Table 27 Market Size for Erythropoietin, By Region, 2014–2021 (USD Million)
Table 28 North America: Market Size for Erythropoietin, By Region, 2014–2021 (USD Million)
Table 29 PEGylation of Proteins Market Size for Recombinant Factor Viii, By Region, 2014–2021 (USD Million)
Table 30 North America: Market Size for Recombinant Factor Viii, By Region, 2014–2021 (USD Million)
Table 31 Market Size for Monoclonal Antibodies, By Region, 2014–2021 (USD Million)
Table 32 North America: Market Size for Monoclonal Antibodies, By Region, 2014–2021 (USD Million)
Table 33 Market Size for Other Protein Type, By Region, 2014–2021 (USD Million)
Table 34 North America: PEPylated Proteins Market Size for Other Protein Type, By Region, 2014–2021 (USD Million)
Table 35 Cancer Treatment Market Size, By Application, 2014–2021 (USD Million)
Table 36 Market Size for Cancer Treatment, By Region, 2014–2021 (USD Million)
Table 37 North America: Market Size for Cancer Treatment, By Region, 2014–2021 (USD Million)
Table 38 Market Size for Hepatitis, By Region, 2014–2021 (USD Million)
Table 39 North America: Market Size for Hepatitis, By Region, 2014–2021 (USD Million)
Table 40 Market Size for Chronic Kidney Disease, By Region, 2014–2021 (USD Million)
Table 41 North America: PEGylation of Proteins Market Size for Chronic Kidney Disease, By Region, 2014–2021 (USD Million)
Table 42 Market Size for Hemophilia, By Region, 2014–2021 (USD Million)
Table 43 North America: Market Size for Hemophilia, By Region, 2014–2021 (USD Million)
Table 44 Market Size for Multiple Sclerosis, By Region, 2014–2021 (USD Million)
Table 45 North America: Market Size for Multiple Sclerosis, By Region, 2014–2021 (USD Million)
Table 46 Market Size for Gastrointestinal Disorder, By Region, 2014–2021 (USD Million)
Table 47 North America: Market Size for Gastrointestinal Disorder , By Region, 2014–2021 (USD Million)
Table 48 Market Size for Other Applications, By Region, 2014–2021 (USD Million)
Table 49 North America: Market Size for Other Application, By Region, 2014–2021 (USD Million)
Table 50 Market Size, By End-User, 2014–2021 (USD Million)
Table 51 Market Size for Pharmaceutical & Biotechnology Companies Segment, By Region, 2014–2021 (USD Million)
Table 52 North America: Market Size for Pharmaceutical & Biotechnology Companies , By Region, 2014–2021 (USD Million)
Table 53 Market Size for Contract Research Organizations Segment, By Region, 2014–2021 (USD Million)
Table 54 North America: Market Size for Contract Research Organizations, By Region, 2014–2021 (USD Million)
Table 55 PEGylated Proteins Market Size for Academic Research Institutes, By Region, 2014–2021 (USD Million)
Table 56 North America: Market Size for Academic Research Institutes, By Region, 2014–2021 (USD Million)
Table 57 Market Size, By Region, 2014–2021 (USD Million)
Table 58 North America: PEGylated Proteins Market Size, By Region, 2014–2021 (USD Million)
Table 59 North America: Market Size, By Product, 2014–2021 (USD Million)
Table 60 North America: Market Size, By Protein Type, 2014–2021 (USD Million)
Table 61 North America: Market Size, By Application, 2014–2021 (USD Million)
Table 62 North America: Market Size, By End User, 2014–2021 (USD Million)
Table 63 U.S: Market Size, By Product, 2014–2021 (USD Million)
Table 64 U.S: Market Size, By Protein Type, 2014–2021 (USD Million)
Table 65 U.S: Market Size, By Application, 2014–2021 (USD Million)
Table 66 U.S: Market Size, By End User, 2014–2021 (USD Million)
Table 67 Canada: PEGylated Proteins Market Size, By Product, 2014–2021 (USD Million)
Table 68 Canada: Market Size, By Protein Type, 2014–2021 (USD Million)
Table 69 Canada: Market Size, By Application, 2014–2021 (USD Million)
Table 70 Canada: Market Size, By End User, 2014–2021 (USD Million)
Table 71 Europe: Market Size, By Product, 2014–2021 (USD Million)
Table 72 Europe: Market Size, By Protein Type, 2014–2021 (USD Million)
Table 73 Europe: Market Size, By Application, 2014–2021 (USD Million)
Table 74 Europe: Market Size, By End User, 2014–2021 (USD Million)
Table 75 Asia: PEGylated Proteins Market Size, By Product, 2014–2021 (USD Million)
Table 76 Asia: Market Size, By Protein Type, 2014–2021 (USD Million)
Table 77 Asia: Market Size, By Application, 2014–2021 (USD Million)
Table 78 Asia: Market Size, By End User, 2014–2021 (USD Million)
Table 79 RoW: Market Size, By Product, 2014–2021 (USD Million)
Table 80 RoW: Market Size, By Protein Type, 2014–2021 (USD Million)
Table 81 RoW: Market Size, By Application, 2014–2021 (USD Million)
Table 82 RoW: Market Size, By End User, 2014–2021 (USD Million)
Table 83 Market Developments Between January 2013 and May 2016
Table 84 Agreements & Collaborations, 2013–2016
Table 85 New Product Launches and Product Showcase, 2013–2016
Table 86 Acquisitions, 2013–2016
Table 87 Product Upgradation, 2013–2016
List of Figures (65 Figures)
Figure 1 PEGylated Proteins Market
Figure 2 Research Design
Figure 3 Global Market Size Estimation Methodology: Bottom-Up Approach
Figure 4 PEGylated Proteins Market Size Estimation Methodology: Top-Down Approach
Figure 5 Breakdown of Primary Interviews: By Company Type, Designation, and Region
Figure 6 Data Triangulation Methodology
Figure 7 PEGylation of Proteins Market Size, By Product, 2016 vs 2021 (USD Million)
Figure 8 Global Market Size, By Protein Type, 2016 vs 2021 (USD Million)
Figure 9 Market Size, By Application, 2016 vs 2021 (USD Million)
Figure 10 Market Size, By End-User, 2016 vs 2021 (USD Million)
Figure 11 PEGylated Proteins Market, By Region, 2016 (USD Million)
Figure 12 Market Size, By Region, 2016 vs 2021 (USD Million)
Figure 13 Increase in R&D Spending to Drive Market Growth
Figure 14 Pharmaceutical & Biotechnology Companies to Command the Largest Market Share in 2016
Figure 15 Asia to Register Highest Growth During the Forecast Period
Figure 16 Asia Holds Lucrative Growth Opportunities in the PEGylated Proteins Market
Figure 17 Increasing R&D Investments in Pharma Industry Boosting the Growth of the Global Market
Figure 18 Market Leaders Adopted the Inorganic Growth Strategy of Agreement & Collaboration
Figure 19 Porter’s Five Forces Analysis (2016)
Figure 20 Increase in R&D Spending Will Drive the Global Market
Figure 21 Patent Application By Region, 2013
Figure 22 Consumables Segment Commands the Largest Share of the PEGylated Proteins Market in 2016
Figure 23 Pegylation Kits Segment Commands the Largest Share of the Consumables Market in 2016
Figure 24 Pegylation Reagents, By Type
Figure 25 Development of PEGylated Biosimilars Segment Commands the Largest Share of the Services Market in 2016
Figure 26 Colony Stimulating Factors to Command the Largest Share of the PEGylated Proteins Type Market in 2016
Figure 27 Cancer Treatment to Command the Largest Share of the PEGylated Protein Application Market in 2016
Figure 28 Pharmaceutical & Biotechnology Companies to Command the Largest Share of the PEGylated Proteins End-User Market in 2016
Figure 29 PEGylated Proteins Market Segmentation, By Region: Market Size and Growth Rate, 2016-2021
Figure 30 Asian Market for PEGylated Proteins Expected to Grow at the Highest Rate (2016 to 2021)
Figure 31 North America: Market Snapshot
Figure 32 Canada to Grow at the Highest Rate in North America
Figure 33 Consumables, the Largest Product Segment in North America
Figure 34 Colony Stimulating Factors Protein Type Segment Dominates the North American PEGylated Proteins Market
Figure 35 Cancer Treatment, the Largest Application Segment in North America
Figure 36 Pharmaceutical & Biotechnology Companies Segment Commands Largest Share of the North American Market
Figure 37 Consumables, the Largest Product Segment in U.S
Figure 38 Colony Stimulating Factors Protein Type Segment Dominates the U.S PEGylated Proteins Market
Figure 39 Cancer Treatment, the Largest Application Segment in U.S
Figure 40 Pharmaceutical & Biotechnology Companies Segment Commands Largest Share of the U.S Market
Figure 41 Consumables, the Largest Product Segment in Canada
Figure 42 Colony Stimulating Factors Protein Type Segment Dominates the Canada Market
Figure 43 Cancer Treatment, the Largest Application Segment in Canada
Figure 44 Pharmaceutical & Biotechnology Companies Segment Commands Largest Share of the Canada Market
Figure 45 Europe: PEGylated Proteins Market Snapshot (2016)
Figure 46 Consumables, the Largest Product Segment in Europe
Figure 47 Colony Stimulating Factors Type Segment Dominates the European Market
Figure 48 Cancer Treatment, the Largest Application Segment in Europe
Figure 49 Pharmaceutical & Biotechnology Companies Segment Commands Largest Share of the European Market
Figure 50 Asia: PEGylated Proteins Market Snapshot
Figure 51 Consumables, the Largest Product Segment in Asia
Figure 52 Colony Stimulating Factors Protein Type Segment Dominates the Asia Market
Figure 53 Cancer, the Largest Application Segment in Asia
Figure 54 Pharmaceutical & Biotechnology Companies Segment Commands Largest Share of the Asia Market
Figure 55 RoW: PEGylated Proteins Market Snapshot (2016)
Figure 56 Consumables, the Largest Product Segment in RoW
Figure 57 Colony Stimulating Factors Protein Type Segment Dominates the RoW Market
Figure 58 Cancer Treatment, the Largest Application Segment in RoW
Figure 59 Pharmaceutical & Biotechnology Companies Segment Commands Largest Share of the RoW Market
Figure 60 Key Developments in the PEGylated Proteins Market, 2013–2016
Figure 61 PEGylated Proteins Market Share Analysis, By Key Player, 2016
Figure 62 Financial Performances of the Leading Market Players
Figure 63 Company Snapshot: Merck Millipore
Figure 64 Thermo Fisher Scientific: Company Snapshot
Figure 65 Company Snapshot: NOF American Corporation (A Subsidiary of NOF Corporation)

 Generating Response ...


Growth opportunities and latent adjacency in PEGylated Proteins Market