2
RESEARCH METHODOLOGY
66
5
MARKET OVERVIEW
Explore excipient market growth driven by innovation, strategic collaborations, and emerging economy opportunities.
87
5.2.1.1
SURGING DEMAND FOR GENERIC MEDICATIONS AND PHARMACEUTICAL FORMULATIONS.
5.2.1.2
INCREASED R&D INVESTMENTS TO DEVELOP NOVEL EXCIPIENTS
5.2.1.3
GROWING FOCUS ON PATIENT-CENTRIC DRUG FORMULATIONS
5.2.1.4
STRATEGIC COLLABORATIONS AND PARTNERSHIPS AMONG PHARMACEUTICAL FIRMS
5.2.2.1
STRICT AND COMPLEX REGULATORY FRAMEWORKS
5.2.2.2
HIGH COST OF EXCIPIENT DEVELOPMENT AND MANUFACTURING
5.2.3.1
INCREASING INTEREST IN FUNCTIONAL AND MULTIFUNCTIONAL EXCIPIENTS
5.2.3.2
TECHNOLOGICAL ADVANCEMENTS IN NANOTECHNOLOGY
5.2.3.3
MARKET OPPORTUNITIES IN EMERGING ECONOMIES
5.2.4.1
ONGOING CONCERNS ABOUT EXCIPIENT SAFETY AND QUALITY STANDARDS
5.2.4.2
LIMITED AVAILABILITY AND FLUCTUATING COSTS OF KEY RAW MATERIALS
5.3
TRENDS/DISRUPTIONS IMPACTING CUSTOMER BUSINESS
5.4.1
INDICATIVE PRICING ANALYSIS, BY KEY PLAYER
5.4.2
INDICATIVE PRICING ANALYSIS, BY REGION
5.6
SUPPLY CHAIN ANALYSIS
5.8
INVESTMENT AND FUNDING SCENARIO
5.9.1.1
CO-PROCESSED EXCIPIENT TECHNOLOGY
5.9.1.2
NANOTECHNOLOGY-BASED EXCIPIENTS
5.9.2
COMPLEMENTARY TECHNOLOGIES
5.9.2.1
3D PRINTING/ADDITIVE MANUFACTURING
5.9.2.2
PROCESS ANALYTICAL TECHNOLOGY (PAT)
5.9.3
ADJACENT TECHNOLOGIES
5.9.3.1
ARTIFICIAL INTELLIGENCE IN FORMULATION DESIGN
5.9.3.2
GREEN CHEMISTRY/SUSTAINABILITY TECH
5.11.1
TRADE DATA FOR HS CODE 290545
5.11.1.1
IMPORT DATA FOR HS CODE 290545
5.11.1.2
EXPORT DATA FOR HS CODE 290545
5.11.2
TRADE DATA FOR HS CODE 350510
5.11.2.1
IMPORT DATA FOR HS CODE 350510
5.11.2.2
EXPORT DATA FOR HS CODE 350510
5.11.3
TRADE DATA FOR HS CODE 290532
5.11.3.1
IMPORT DATA FOR HS CODE 290532
5.11.3.2
EXPORT DATA FOR HS CODE 290532
5.11.4
TRADE DATA FOR HS CODE 283650
5.11.4.1
IMPORT DATA FOR HS CODE 283650
5.11.4.2
EXPORT DATA FOR HS CODE 283650
5.11.5
TRADE DATA FOR HS CODE 250100
5.11.5.1
IMPORT DATA FOR HS CODE 250100
5.11.5.2
EXPORT DATA FOR HS CODE 250100
5.11.6
TRADE DATA FOR HS CODE 290543
5.11.6.1
IMPORT DATA FOR HS CODE 290543
5.11.6.2
EXPORT DATA FOR HS CODE 290543
5.11.7
TRADE DATA FOR HS CODE 3912
5.11.7.1
IMPORT DATA FOR HS CODE 3912
5.11.7.2
EXPORT DATA FOR HS CODE 3912
5.12
KEY CONFERENCES AND EVENTS, 2025–2026
5.13
REGULATORY LANDSCAPE
5.13.1
REGULATORY FRAMEWORK
5.13.2
REGULATORY BODIES, GOVERNMENT AGENCIES, AND OTHER ORGANIZATIONS
5.14
PORTER’S FIVE FORCES ANALYSIS
5.14.1
BARGAINING POWER OF SUPPLIERS
5.14.2
BARGAINING POWER OF BUYERS
5.14.3
THREAT OF NEW ENTRANTS
5.14.4
THREAT OF SUBSTITUTES
5.14.5
INTENSITY OF COMPETITIVE RIVALRY
5.15
KEY STAKEHOLDERS AND BUYING CRITERIA
5.15.1
KEY STAKEHOLDERS IN BUYING PROCESS
5.15.2
KEY BUYING CRITERIA
5.16
IMPACT OF AI/GEN AI ON PHARMACEUTICAL EXCIPIENTS MARKET
5.16.2
MARKET POTENTIAL OF AI ON PHARMACEUTICAL EXCIPIENTS
5.16.4
KEY COMPANIES IMPLEMENTING AI
5.16.5
FUTURE OF GENERATIVE AI IN PHARMACEUTICAL EXCIPIENT ECOSYSTEM
5.17
IMPACT OF 2025 US TARIFF ON PHARMACEUTICAL EXCIPIENTS MARKET
5.17.3
PRICE IMPACT ANALYSIS
5.17.4
IMPACT ON COUNTRY/REGION
5.17.5
IMPACT ON END-USE INDUSTRIES
6
PHARMACEUTICAL EXCIPIENTS MARKET, BY PRODUCT
Market Size & Growth Rate Forecast Analysis to 2030 in USD Million | 295 Data Tables
142
6.2.1.1.1
NEED FOR IMPROVED DRUG ABSORPTION TO AUGMENT GROWTH
6.2.1.2
MINERAL STEARATES
6.2.1.2.1
WIDE USE OF MAGNESIUM STEARATES AS EXCIPIENTS IN NUTRACEUTICAL AND PHARMACEUTICAL FORMULATIONS TO DRIVE MARKET
6.2.1.3.1
NON-TOXIC, COLORLESS, AND ODORLESS PROPERTIES TO ENCOURAGE GROWTH
6.2.1.4
OTHER OLEOCHEMICALS
6.2.2.1.3
ARTIFICIAL SWEETENERS
6.2.2.2.1
MICROCRYSTALLINE CELLULOSE
6.2.2.2.2
CELLULOSE ETHERS
6.2.2.2.3
CMC & CROSCARMELLOSE SODIUM
6.2.2.2.4
CELLULOSE ESTERS
6.2.2.3.1
MODIFIED STARCH
6.2.2.3.3
CONVERTED STARCH
6.2.3.1.1
POLYETHYLENE GLYCOL
6.2.3.1.2
PROPYLENE GLYCOL
6.2.3.2.1
INCREASING DEMAND FOR FAST-DISSOLVING TABLETS TO SPUR GROWTH
6.2.3.3
MINERAL HYDROCARBONS
6.2.3.4.1
WIDE USE OF ACRYLIC POLYMERS IN CONTROLLED-RELEASE DRUG FORMULATIONS TO DRIVE MARKET
6.2.3.5
OTHER PETROCHEMICALS
6.2.4.1
GROWING APPLICATIONS OF PROTEINS AS CARRIERS FOR MICROPARTICLES AND NANOPARTICLES TO PROPEL MARKET
6.2.5
OTHER ORGANIC CHEMICALS
6.3.1.1
CHEMICAL PURITY AND LOW INCOMPATIBILITY WITH DRUGS TO AID GROWTH
6.3.2.1
AVAILABILITY OF SILICON OXIDES IN THE HYDROPHOBIC, HYDROPHILIC, AND GRANULATED FORMS TO AID MARKET GROWTH
6.3.3.1
INCREASED UTILIZATION OF HALITES IN VACCINES AND CONTROLLED-RELEASE FORMULATIONS TO FOSTER GROWTH
6.3.4.1
SHORT DISINTEGRATION TIME AND EXCELLENT MECHANICAL STRENGTH TO EXPEDITE GROWTH
6.3.5.1
HIGH QUALITY AND COST EFFECTIVENESS TO AID GROWTH
6.3.6
OTHER INORGANIC CHEMICALS
7
PHARMACEUTICAL EXCIPIENTS MARKET, BY FUNCTIONALITY
Market Size & Growth Rate Forecast Analysis to 2030 in USD Million | 67 Data Tables
263
7.2.1
IMPROVED COHESION AND DIRECT COMPRESSION TO AMPLIFY GROWTH
7.3
SUSPENDING & VISCOSITY AGENTS
7.3.1
DRUG STABILITY AND TASTE MASKING ADVANTAGES TO SUSTAIN GROWTH
7.4.1
INCREASING USE OF SUSTAINED-RELEASE FORMULATIONS IN PHARMA INDUSTRY TO DRIVE MARKET
7.5.1
HIGHER FLUIDITY AND COMPRESSIBILITY TO STIMULATE GROWTH
7.6
FLAVORING AGENTS & SWEETENERS
7.6.1
NEED TO IMPROVE DRUG PALATABILITY TO ADVANCE GROWTH
7.7.1
NEED FOR RAPID BREAK-UP OF SOLID DOSAGE FORMS TO FOSTER GROWTH
7.8.1
INCREASING USE OF COLORING IN HARD AND SOFT GELATIN CAPSULES, TABLETS, ORAL LIQUIDS, AND TOPICAL CREAMS TO BOOST MARKET
7.9
LUBRICANTS & GLIDANTS
7.9.1
NON-TOXIC PROPERTIES TO FAVOR GROWTH
7.10.1
GROWING USE OF PRESERVATIVES IN PHARMACEUTICAL AND NUTRACEUTICAL INDUSTRY TO DRIVE MARKET
7.11.1
RISING USE OF SOLUBILITY ENHANCEMENT EXCIPIENTS IN LIQUID DRUG FORMULATIONS TO PROMOTE GROWTH
7.12
OTHER FUNCTIONALITIES
8
PHARMACEUTICAL EXCIPIENTS MARKET, BY FORMULATION
Market Size & Growth Rate Forecast Analysis to 2030 in USD Million | 66 Data Tables
297
8.2.1.1
HIGH PALATABILITY AND PORTABILITY TO SUPPORT GROWTH
8.2.2.1
HARD-GELATIN CAPSULES
8.2.2.1.1
EASE OF MANUFACTURING AND VERSATILITY TO BOOST MARKET
8.2.2.2
SOFT-GELATIN CAPSULES
8.2.2.2.1
QUICK-RELEASE PROPERTIES TO CONTRIBUTE TO GROWTH
8.2.3
LIQUID FORMULATIONS
8.2.3.1
RAPID ABSORPTION FROM STOMACH AND INTESTINES TO FOSTER GROWTH
8.2.4
OTHER ORAL FORMULATIONS
8.3.1
GROWING DEMAND FOR TRANSDERMAL PATCHES AND SELF-ADHERING TRANSDERMAL DRUG DELIVERY SYSTEMS TO FUEL MARKET
8.4
PARENTERAL FORMULATIONS
8.4.1
EMERGENCE OF BIOLOGICAL MOLECULES TO EXPEDITE GROWTH
9
PHARMACEUTICAL EXCIPIENTS MARKET, BY FUNCTIONALITY APPLICATION
Market Size & Growth Rate Forecast Analysis to 2030 in USD Million | 31 Data Tables
326
9.2.1
IMPROVED DRUG SHELF LIFE AND LESSER MANUFACTURING DEFECTS TO PROMOTE GROWTH
9.3.1
GROWING PREFERENCE FOR BETTER-TASTING SOLID DOSAGE FORMS TO PROPEL MARKET
9.4.1
INCREASING USE OF MODIFIED-RELEASE FORMULATIONS IN PHARMA INDUSTRY TO FOSTER GROWTH
9.5
SOLUBILITY & BIOAVAILABILITY ENHANCEMENT
9.5.1
INCREASING PREFERENCE FOR SOLUBLE COMPOUNDS TO ACCELERATE GROWTH
10
PHARMACEUTICAL EXCIPIENTS MARKET, BY REGION
Comprehensive coverage of 7 Regions with country-level deep-dive of 13 Countries | 444 Data Tables.
342
10.2.1
MACROECONOMIC ANALYSIS FOR EUROPE
10.2.2.1
BOOMING PHARMACEUTICAL MANUFACTURING SECTOR TO AID GROWTH
10.2.3.1
GROWING ADOPTION OF GENERICS AND DEVELOPMENT OF NOVEL EXCIPIENTS TO FUEL MARKET
10.2.4.1
LARGE GERIATRIC POPULATION TO SUPPORT GROWTH
10.2.5.1
BUDGETARY CONSTRAINTS AND RESTRICTED HEALTHCARE SPENDING TO IMPEDE GROWTH
10.2.6.1
HIGH CONSUMPTION OF BIOLOGICS TO FOSTER GROWTH
10.3.1
MACROECONOMIC ANALYSIS FOR NORTH AMERICA
10.3.2.1
WELL-DEVELOPED HEALTHCARE INFRASTRUCTURE AND RESEARCH BASES TO AID GROWTH
10.3.3.1
RISING PREVALENCE OF CANCER TO CONTRIBUTE TO GROWTH
10.4.1
MACROECONOMIC ANALYSIS FOR ASIA PACIFIC
10.4.2.1
EMPHASIS ON GENERICS AND OFF-PATENT DRUGS TO DRIVE MARKET
10.4.3.1
RAPID GROWTH OF ELDERLY POPULATION TO AUGMENT GROWTH
10.4.4.1
HIGH DOMESTIC DEMAND FOR PHARMACEUTICALS AND EXPORT VOLUME TO BOOST MARKET
10.4.5.1
PRESENCE OF LEADING CONTRACT RESEARCH AND DEVELOPMENT ORGANIZATIONS TO PROPEL MARKET
10.4.6
REST OF ASIA PACIFIC
10.5.1
GROWING GERIATRIC POPULATION AND RISING DISEASE PREVALENCE ARE DRIVING MARKET GROWTH
10.5.2
MACROECONOMIC ANALYSIS FOR LATIN AMERICA
10.5.3.1
EMERGING OPPORTUNITIES FOR EXCIPIENT MANUFACTURERS TO DRIVE MARKET
10.5.4.1
GROWING DEMAND FOR AFFORDABLE THERAPIES TO BOOST MARKET
10.5.5
REST OF LATIN AMERICA
10.6.1
GROWING FOCUS ON UNSATURATED MARKETS TO DRIVE MARKET
10.6.2
MACROECONOMIC ANALYSIS FOR MIDDLE EAST
10.6.3.1
EXPANDING HEALTHCARE INFRASTRUCTURE EXPANSION AND LOCALIZATION OF DRUG MANUFACTURING TO BOLSTER GROWTH
10.6.4
REST OF MIDDLE EAST
10.7.1
INCREASING PRESENCE OF MAJOR PHARMACEUTICAL COMPANIES TO AUGMENT GROWTH
10.7.2
MACROECONOMIC ANALYSIS FOR AFRICA
11
COMPETITIVE LANDSCAPE
Uncover key strategies driving leader dominance in the pharmaceutical excipients market.
520
11.2
KEY PLAYER STRATEGIES/RIGHT TO WIN
11.2.1
OVERVIEW OF STRATEGIES ADOPTED BY KEY PLAYERS IN PHARMACEUTICAL EXCIPIENTS MARKET, 2022−2024
11.3
REVENUE ANALYSIS, 2020–2024
11.4
MARKET SHARE ANALYSIS, 2024
11.5
COMPANY VALUATION AND FINANCIAL METRICS
11.6
BRAND/PRODUCT COMPARISON
11.7
COMPANY EVALUATION MATRIX: KEY PLAYERS, 2024
11.7.5
COMPETITIVE BENCHMARKING: KEY PLAYERS, 2024
11.7.5.1
COMPANY FOOTPRINT
11.7.5.2
REGION FOOTPRINT
11.7.5.3
PRODUCT FOOTPRINT
11.7.5.4
FUNCTIONALITY FOOTPRINT
11.7.5.5
FUNCTIONALITY APPLICATION FOOTPRINT
11.8
COMPANY EVALUATION MATRIX: STARTUPS/SMES, 2024
11.8.1
PROGRESSIVE COMPANIES
11.8.2
RESPONSIVE COMPANIES
11.8.5
COMPETITIVE BENCHMARKING: STARTUPS/SMES, 2024
11.8.5.1
DETAILED LIST OF KEY STARTUPS/SMES
11.8.5.2
COMPETITIVE BENCHMARKING OF KEY STARTUPS/SMES
11.9
COMPETITIVE SCENARIO
11.9.1
PRODUCT LAUNCHES AND APPROVALS
12
COMPANY PROFILES
In-depth Company Profiles of Leading Market Players with detailed Business Overview, Product and Service Portfolio, Recent Developments, and Unique Analyst Perspective (MnM View)
542
12.1.1
INTERNATIONAL FLAVORS & FRAGRANCES INC.
12.1.1.1
BUSINESS OVERVIEW
12.1.1.2
PRODUCTS OFFERED
12.1.1.3
RECENT DEVELOPMENTS
12.1.1.4.2
STRATEGIC CHOICES
12.1.1.4.3
WEAKNESSES AND COMPETITIVE THREATS
12.1.9
ASSOCIATED BRITISH FOODS PLC
12.1.13
BERKSHIRE HATHAWAY (LUBRIZOL CORPORATION)
12.1.17
CRODA INTERNATIONAL PLC
12.1.20
J. RETTENMAIER & SÖHNE GMBH + CO KG
12.1.21
SHIN-ETSU CHEMICAL CO., LTD.
12.2.2
MEGGLE GMBH & CO. KG
12.2.3
FUJI CHEMICAL INDUSTRIES CO., LTD.
12.2.6
NITIKA PHARMACEUTICAL SPECIALTIES PVT. LTD.
12.2.7
R.T. VANDERBILT HOLDING COMPANY, INC.
12.2.9
SIAGACHI INDUSTRIES
12.2.10
JH NANHANG LIFE SCIENCES CO., LTD.
13.2
KNOWLEDGESTORE: MARKETSANDMARKETS’ SUBSCRIPTION PORTAL
13.3
CUSTOMIZATION OPTIONS
TABLE 1
PHARMACEUTICAL EXCIPIENTS MARKET: INCLUSIONS AND EXCLUSIONS
TABLE 2
IMPACT ANALYSIS OF SUPPLY-SIDE AND DEMAND-SIDE FACTORS
TABLE 3
PHARMACEUTICAL EXCIPIENTS MARKET: RISK ANALYSIS
TABLE 4
PHARMACEUTICAL EXCIPIENTS MARKET: IMPACT ANALYSIS OF MARKET DYNAMICS
TABLE 5
IMPENDING AND ONGOING PATENT EXPIRY OF BLOCKBUSTER THERAPEUTICS, 2023–2035
TABLE 6
LIST OF MULTIFUNCTIONAL EXCIPIENTS
TABLE 7
INDICATIVE PRICING ANALYSIS OF EXCIPIENT PRODUCTS, BY KEY PLAYER, 2024
TABLE 8
INDICATIVE PRICING ANALYSIS OF EXCIPIENT PRODUCTS, BY REGION, 2024
TABLE 9
AVERAGE SELLING PRICE FOR CMC, CCS AND L-HPC EXCIPIENT
TABLE 10
PHARMACEUTICAL EXCIPIENTS MARKET: ROLE OF COMPANIES IN ECOSYSTEM
TABLE 11
PHARMACEUTICAL EXCIPIENTS MARKET: NUMBER OF PATENTS FILED, 2014–2024
TABLE 12
INNOVATIONS AND PATENT REGISTRATIONS, 2022–2023
TABLE 13
IMPORT DATA FOR HS CODE 290545 (GLYCEROL), 2020–2024 (USD)
TABLE 14
IMPORT DATA FOR HS CODE 290545 (GLYCEROL), 2020–2024 (TONS)
TABLE 15
EXPORT DATA FOR HS CODE 290545 (GLYCEROL), 2020–2024 (USD)
TABLE 16
EXPORT DATA FOR HS CODE 290545 (GLYCEROL), 2020–2024 (TONS)
TABLE 17
IMPORT DATA FOR HS CODE 350510 (DEXTRINS AND OTHER MODIFIED STARCHES, E.G. PREGELATINISED OR ESTERIFIED STARCHES), 2020–2024 (USD)
TABLE 18
IMPORT DATA FOR HS CODE 350510 (DEXTRINS AND OTHER MODIFIED STARCHES, E.G. PREGELATINISED OR ESTERIFIED STARCHES), 2020–2024 (TONS)
TABLE 19
EXPORT DATA FOR HS CODE 350510 (DEXTRINS AND OTHER MODIFIED STARCHES, E.G. PREGELATINISED OR ESTERIFIED STARCHES), 2020–2024 (USD)
TABLE 20
EXPORT DATA FOR HS CODE 350510 (DEXTRINS AND OTHER MODIFIED STARCHES, E.G. PREGELATINISED OR ESTERIFIED STARCHES), 2020–2024 (TONS)
TABLE 21
IMPORT DATA FOR HS CODE 290532 (PROPYLENE GLYCOL "PROPANE-1,2-DIOL), 2020–2024 (USD)
TABLE 22
IMPORT DATA FOR HS CODE 290532 (PROPYLENE GLYCOL "PROPANE-1,2-DIOL), 2020–2024 (TONS)
TABLE 23
EXPORT DATA FOR HS CODE 290532 (PROPYLENE GLYCOL "PROPANE-1,2-DIOL), 2020–2024 (USD)
TABLE 24
EXPORT DATA FOR HS CODE 290532 (PROPYLENE GLYCOL "PROPANE-1,2-DIOL), 2020–2024 (TONS)
TABLE 25
IMPORT DATA FOR HS CODE 283650 (CALCIUM CARBONATE), 2020–2024 (USD)
TABLE 26
IMPORT DATA FOR HS CODE 283650 (CALCIUM CARBONATE), 2020–2024 (TONS)
TABLE 27
EXPORT DATA FOR HS CODE 283650 (CALCIUM CARBONATE), 2020–2024 (USD)
TABLE 28
EXPORT DATA FOR HS CODE 283650 (CALCIUM CARBONATE), 2020–2024 (TONS)
TABLE 29
IMPORT DATA FOR HS CODE 250100 (SALTS, INCL. TABLE SALT AND DENATURED SALT, AND PURE SODIUM CHLORIDE), 2020–2024 (USD)
TABLE 30
IMPORT DATA FOR HS CODE 250100 (SALTS, INCL. TABLE SALT AND DENATURED SALT, AND PURE SODIUM CHLORIDE), 2020–2024 (TONS)
TABLE 31
EXPORT DATA FOR HS CODE 250100 (SALTS, INCL. TABLE SALT AND DENATURED SALT, AND PURE SODIUM CHLORIDE), 2020–2024 (USD)
TABLE 32
EXPORT DATA FOR HS CODE 250100 (SALTS, INCL. TABLE SALT AND DENATURED SALT, AND PURE SODIUM CHLORIDE), 2020–2024 (TONS)
TABLE 33
IMPORT DATA FOR HS CODE 290543 (MANNITOL), 2020–2024 (USD)
TABLE 34
IMPORT DATA FOR HS CODE 290543 (MANNITOL), 2020–2024 (TONS)
TABLE 35
EXPORT DATA FOR HS CODE 290543 (MANNITOL), 2020–2024 (USD)
TABLE 36
EXPORT DATA FOR HS CODE 290543 (MANNITOL), 2020–2024 (TONS)
TABLE 37
IMPORT DATA FOR HS CODE: 3912 (CELLULOSE AND ITS CHEMICAL DERIVATIVES, N.E.S., IN PRIMARY FORMS), 2020–2024 (USD)
TABLE 38
IMPORT DATA FOR HS CODE: 3912 (CELLULOSE AND ITS CHEMICAL DERIVATIVES, N.E.S., IN PRIMARY FORMS), 2020–2024 (TONS)
TABLE 39
EXPORT DATA FOR HS CODE: 3912 (CELLULOSE AND ITS CHEMICAL DERIVATIVES, N.E.S., IN PRIMARY FORMS), 2020–2024 (USD)
TABLE 40
EXPORT DATA FOR HS CODE: 3912 (CELLULOSE AND ITS CHEMICAL DERIVATIVES, N.E.S., IN PRIMARY FORMS), 2020–2024 (TONS)
TABLE 41
PHARMACEUTICAL EXCIPIENTS MARKET: KEY CONFERENCES AND EVENTS, 2025–2026
TABLE 42
NORTH AMERICA: REGULATORY BODIES, GOVERNMENT AGENCIES, AND OTHER ORGANIZATIONS
TABLE 43
EUROPE: REGULATORY BODIES, GOVERNMENT AGENCIES, AND OTHER ORGANIZATIONS
TABLE 44
ASIA PACIFIC: REGULATORY BODIES, GOVERNMENT AGENCIES, AND OTHER ORGANIZATIONS
TABLE 45
LATIN AMERICA: REGULATORY BODIES, GOVERNMENT AGENCIES, AND OTHER ORGANIZATIONS
TABLE 46
MIDDLE EAST & AFRICA: REGULATORY BODIES, GOVERNMENT AGENCIES, AND OTHER ORGANIZATIONS
TABLE 47
PHARMACEUTICAL EXCIPIENTS MARKET: PORTER’S FIVE FORCES ANALYSIS
TABLE 48
INFLUENCE OF KEY STAKEHOLDERS ON BUYING PROCESS, BY PRODUCT (%)
TABLE 49
KEY BUYING CRITERIA, BY END USER
TABLE 50
US ADJUSTED RECIPROCAL TARIFF RATES
TABLE 51
COMPARATIVE PRICING ON KEY EXCIPIENT PRE AND POST US 2025 TARIFF
TABLE 52
IMPACT ANALYSIS ON END-USE INDUSTRIES
TABLE 53
PHARMACEUTICAL EXCIPIENTS MARKET, BY PRODUCT, 2023–2030 (USD MILLION)
TABLE 54
PHARMACEUTICAL EXCIPIENTS MARKET FOR ORGANIC CHEMICALS, BY TYPE, 2023–2030 (USD MILLION)
TABLE 55
PHARMACEUTICAL EXCIPIENTS MARKET FOR ORGANIC CHEMICALS, BY REGION, 2023–2030 (USD MILLION)
TABLE 56
NORTH AMERICA: PHARMACEUTICAL EXCIPIENTS MARKET FOR ORGANIC CHEMICALS, BY COUNTRY, 2023–2030 (USD MILLION)
TABLE 57
EUROPE: PHARMACEUTICAL EXCIPIENTS MARKET FOR ORGANIC CHEMICALS, BY COUNTRY, 2023–2030 (USD MILLION)
TABLE 58
ASIA PACIFIC: PHARMACEUTICAL EXCIPIENTS MARKET FOR ORGANIC CHEMICALS, BY COUNTRY, 2023–2030 (USD MILLION)
TABLE 59
LATIN AMERICA: PHARMACEUTICAL EXCIPIENTS MARKET FOR ORGANIC CHEMICALS, BY COUNTRY, 2023–2030 (USD MILLION)
TABLE 60
MIDDLE EAST: PHARMACEUTICAL EXCIPIENTS MARKET FOR ORGANIC CHEMICALS, BY REGION, 2023–2030 (USD MILLION)
TABLE 61
PHARMACEUTICAL EXCIPIENTS MARKET FOR OLEOCHEMICALS, BY TYPE, 2023–2030 (USD MILLION)
TABLE 62
PHARMACEUTICAL EXCIPIENTS MARKET FOR OLEOCHEMICALS, BY REGION, 2023–2030 (USD MILLION)
TABLE 63
NORTH AMERICA: PHARMACEUTICAL EXCIPIENTS MARKET FOR OLEOCHEMICALS, BY COUNTRY, 2023–2030 (USD MILLION)
TABLE 64
EUROPE: PHARMACEUTICAL EXCIPIENTS MARKET FOR OLEOCHEMICALS, BY COUNTRY, 2023–2030 (USD MILLION)
TABLE 65
ASIA PACIFIC: PHARMACEUTICAL EXCIPIENTS MARKET FOR OLEOCHEMICALS, BY COUNTRY, 2023–2030 (USD MILLION)
TABLE 66
LATIN AMERICA: PHARMACEUTICAL EXCIPIENTS MARKET FOR OLEOCHEMICALS, BY COUNTRY, 2023–2030 (USD MILLION)
TABLE 67
MIDDLE EAST: PHARMACEUTICAL EXCIPIENTS MARKET FOR OLEOCHEMICALS, BY REGION, 2023–2030 (USD MILLION)
TABLE 68
PHARMACEUTICAL EXCIPIENTS MARKET FOR FATTY ALCOHOLS, BY REGION, 2023–2030 (USD MILLION)
TABLE 69
NORTH AMERICA: PHARMACEUTICAL EXCIPIENTS MARKET FOR FATTY ALCOHOLS, BY COUNTRY, 2023–2030 (USD MILLION)
TABLE 70
EUROPE: PHARMACEUTICAL EXCIPIENTS MARKET FOR FATTY ALCOHOLS, BY COUNTRY, 2023–2030 (USD MILLION)
TABLE 71
ASIA PACIFIC: PHARMACEUTICAL EXCIPIENTS MARKET FOR FATTY ALCOHOLS, BY COUNTRY, 2023–2030 (USD MILLION)
TABLE 72
LATIN AMERICA: PHARMACEUTICAL EXCIPIENTS MARKET FOR FATTY ALCOHOLS, BY COUNTRY, 2023–2030 (USD MILLION)
TABLE 73
MIDDLE EAST: PHARMACEUTICAL EXCIPIENTS MARKET FOR FATTY ALCOHOLS, BY REGION, 2023–2030 (USD MILLION)
TABLE 74
PHARMACEUTICAL EXCIPIENTS MARKET FOR MINERAL STEARATES, BY REGION, 2023–2030 (USD MILLION)
TABLE 75
NORTH AMERICA: PHARMACEUTICAL EXCIPIENTS MARKET FOR MINERAL STEARATES, BY COUNTRY, 2023–2030 (USD MILLION)
TABLE 76
EUROPE: PHARMACEUTICAL EXCIPIENTS MARKET FOR MINERAL STEARATES, BY COUNTRY, 2023–2030 (USD MILLION)
TABLE 77
ASIA PACIFIC: PHARMACEUTICAL EXCIPIENTS MARKET FOR MINERAL STEARATES, BY COUNTRY, 2023–2030 (USD MILLION)
TABLE 78
LATIN AMERICA: PHARMACEUTICAL EXCIPIENTS MARKET FOR MINERAL STEARATES, BY COUNTRY, 2023–2030 (USD MILLION)
TABLE 79
MIDDLE EAST: PHARMACEUTICAL EXCIPIENTS MARKET FOR MINERAL STEARATES, BY REGION, 2023–2030 (USD MILLION)
TABLE 80
PHARMACEUTICAL EXCIPIENTS MARKET FOR GLYCERIN, BY REGION, 2023–2030 (USD MILLION)
TABLE 81
NORTH AMERICA: PHARMACEUTICAL EXCIPIENTS MARKET FOR GLYCERIN, BY COUNTRY, 2023–2030 (USD MILLION)
TABLE 82
EUROPE: PHARMACEUTICAL EXCIPIENTS MARKET FOR GLYCERIN, BY COUNTRY, 2023–2030 (USD MILLION)
TABLE 83
ASIA PACIFIC: PHARMACEUTICAL EXCIPIENTS MARKET FOR GLYCERIN, BY COUNTRY, 2023–2030 (USD MILLION)
TABLE 84
LATIN AMERICA: PHARMACEUTICAL EXCIPIENTS MARKET FOR GLYCERIN, BY COUNTRY, 2023–2030 (USD MILLION)
TABLE 85
MIDDLE EAST: PHARMACEUTICAL EXCIPIENTS MARKET FOR GLYCERIN, BY REGION, 2023–2030 (USD MILLION)
TABLE 86
PHARMACEUTICAL EXCIPIENTS MARKET FOR OTHER OLEOCHEMICALS, BY REGION, 2023–2030 (USD MILLION)
TABLE 87
NORTH AMERICA: PHARMACEUTICAL EXCIPIENTS MARKET FOR OTHER OLEOCHEMICALS, BY COUNTRY, 2023–2030 (USD MILLION)
TABLE 88
EUROPE: PHARMACEUTICAL EXCIPIENTS MARKET FOR OTHER OLEOCHEMICALS, BY COUNTRY, 2023–2030 (USD MILLION)
TABLE 89
ASIA PACIFIC: PHARMACEUTICAL EXCIPIENTS MARKET FOR OTHER OLEOCHEMICALS, BY COUNTRY, 2023–2030 (USD MILLION)
TABLE 90
LATIN AMERICA: PHARMACEUTICAL EXCIPIENTS MARKET FOR OTHER OLEOCHEMICALS, BY COUNTRY, 2023–2030 (USD MILLION)
TABLE 91
MIDDLE EAST: PHARMACEUTICAL EXCIPIENTS MARKET FOR OTHER OLEOCHEMICALS, BY REGION, 2023–2030 (USD MILLION)
TABLE 92
PHARMACEUTICAL EXCIPIENTS MARKET FOR CARBOHYDRATES, BY TYPE, 2023–2030 (USD MILLION)
TABLE 93
PHARMACEUTICAL EXCIPIENTS MARKET FOR CARBOHYDRATES, BY REGION, 2023–2030 (USD MILLION)
TABLE 94
NORTH AMERICA: PHARMACEUTICAL EXCIPIENTS MARKET FOR CARBOHYDRATES, BY COUNTRY, 2023–2030 (USD MILLION)
TABLE 95
EUROPE: PHARMACEUTICAL EXCIPIENTS MARKET FOR CARBOHYDRATES, BY COUNTRY, 2023–2030 (USD MILLION)
TABLE 96
ASIA PACIFIC: PHARMACEUTICAL EXCIPIENTS MARKET FOR CARBOHYDRATES, BY COUNTRY, 2023–2030 (USD MILLION)
TABLE 97
LATIN AMERICA: PHARMACEUTICAL EXCIPIENTS MARKET FOR CARBOHYDRATES, BY COUNTRY, 2023–2030 (USD MILLION)
TABLE 98
MIDDLE EAST: PHARMACEUTICAL EXCIPIENTS MARKET FOR CARBOHYDRATES, BY REGION, 2023–2030 (USD MILLION)
TABLE 99
PHARMACEUTICAL EXCIPIENTS MARKET FOR SUGARS, BY TYPE, 2023–2030 (USD MILLION)
TABLE 100
PHARMACEUTICAL EXCIPIENTS MARKET FOR SUGARS, BY REGION, 2023–2030 (USD MILLION)
TABLE 101
NORTH AMERICA: PHARMACEUTICAL EXCIPIENTS MARKET FOR SUGARS, BY COUNTRY, 2023–2030 (USD MILLION)
TABLE 102
EUROPE: PHARMACEUTICAL EXCIPIENTS MARKET FOR SUGARS, BY COUNTRY, 2023–2030 (USD MILLION)
TABLE 103
ASIA PACIFIC: PHARMACEUTICAL EXCIPIENTS MARKET FOR SUGARS, BY COUNTRY, 2023–2030 (USD MILLION)
TABLE 104
LATIN AMERICA: PHARMACEUTICAL EXCIPIENTS MARKET FOR SUGARS, BY COUNTRY, 2023–2030 (USD MILLION)
TABLE 105
MIDDLE EAST: PHARMACEUTICAL EXCIPIENTS MARKET FOR SUGARS, BY REGION, 2023–2030 (USD MILLION)
TABLE 106
PHARMACEUTICAL EXCIPIENTS MARKET FOR ACTUAL SUGARS, BY TYPE, 2023–2030 (USD MILLION)
TABLE 107
PHARMACEUTICAL EXCIPIENTS MARKET FOR ACTUAL SUGARS, BY REGION, 2023–2030 (USD MILLION)
TABLE 108
NORTH AMERICA: PHARMACEUTICAL EXCIPIENTS MARKET FOR ACTUAL SUGARS, BY COUNTRY, 2023–2030 (USD MILLION)
TABLE 109
EUROPE: PHARMACEUTICAL EXCIPIENTS MARKET FOR ACTUAL SUGARS, BY COUNTRY, 2023–2030 (USD MILLION)
TABLE 110
ASIA PACIFIC: PHARMACEUTICAL EXCIPIENTS MARKET FOR ACTUAL SUGARS, BY COUNTRY, 2023–2030 (USD MILLION)
TABLE 111
LATIN AMERICA: PHARMACEUTICAL EXCIPIENTS MARKET FOR ACTUAL SUGARS, BY COUNTRY, 2023–2030 (USD MILLION)
TABLE 112
MIDDLE EAST: PHARMACEUTICAL EXCIPIENTS MARKET FOR ACTUAL SUGARS, BY REGION, 2023–2030 (USD MILLION)
TABLE 113
PHARMACEUTICAL EXCIPIENTS MARKET FOR LACTOSE, BY REGION, 2023–2030 (USD MILLION)
TABLE 114
NORTH AMERICA: PHARMACEUTICAL EXCIPIENTS MARKET FOR LACTOSE, BY COUNTRY, 2023–2030 (USD MILLION)
TABLE 115
EUROPE: PHARMACEUTICAL EXCIPIENTS MARKET FOR LACTOSE, BY COUNTRY, 2023–2030 (USD MILLION)
TABLE 116
ASIA PACIFIC: PHARMACEUTICAL EXCIPIENTS MARKET FOR LACTOSE, BY COUNTRY, 2023–2030 (USD MILLION)
TABLE 117
LATIN AMERICA: PHARMACEUTICAL EXCIPIENTS MARKET FOR LACTOSE, BY COUNTRY, 2023–2030 (USD MILLION)
TABLE 118
MIDDLE EAST: PHARMACEUTICAL EXCIPIENTS MARKET FOR LACTOSE, BY REGION, 2023–2030 (USD MILLION)
TABLE 119
PHARMACEUTICAL EXCIPIENTS MARKET FOR SUCROSE, BY REGION, 2023–2030 (USD MILLION)
TABLE 120
NORTH AMERICA: PHARMACEUTICAL EXCIPIENTS MARKET FOR SUCROSE, BY COUNTRY, 2023–2030 (USD MILLION)
TABLE 121
EUROPE: PHARMACEUTICAL EXCIPIENTS MARKET FOR SUCROSE, BY COUNTRY, 2023–2030 (USD MILLION)
TABLE 122
ASIA PACIFIC: PHARMACEUTICAL EXCIPIENTS MARKET FOR SUCROSE, BY COUNTRY, 2023–2030 (USD MILLION)
TABLE 123
LATIN AMERICA: PHARMACEUTICAL EXCIPIENTS MARKET FOR SUCROSE, BY COUNTRY, 2023–2030 (USD MILLION)
TABLE 124
MIDDLE EAST: PHARMACEUTICAL EXCIPIENTS MARKET FOR SUCROSE, BY REGION, 2023–2030 (USD MILLION)
TABLE 125
PHARMACEUTICAL EXCIPIENTS MARKET FOR DEXTROSE (D-GLUCOSE), BY REGION, 2023–2030 (USD MILLION)
TABLE 126
NORTH AMERICA: PHARMACEUTICAL EXCIPIENTS MARKET FOR DEXTROSE (D-GLUCOSE), BY COUNTRY, 2023–2030 (USD MILLION)
TABLE 127
EUROPE: PHARMACEUTICAL EXCIPIENTS MARKET FOR DEXTROSE (D-GLUCOSE), BY COUNTRY, 2023–2030 (USD MILLION)
TABLE 128
ASIA PACIFIC: PHARMACEUTICAL EXCIPIENTS MARKET FOR DEXTROSE (D-GLUCOSE), BY COUNTRY, 2023–2030 (USD MILLION)
TABLE 129
LATIN AMERICA: PHARMACEUTICAL EXCIPIENTS MARKET FOR DEXTROSE (D-GLUCOSE), BY COUNTRY, 2023–2030 (USD MILLION)
TABLE 130
MIDDLE EAST: PHARMACEUTICAL EXCIPIENTS MARKET FOR DEXTROSE (D-GLUCOSE), BY REGION, 2023–2030 (USD MILLION)
TABLE 131
PHARMACEUTICAL EXCIPIENTS MARKET FOR SUGAR ALCOHOLS, BY TYPE, 2023–2030 (USD MILLION)
TABLE 132
PHARMACEUTICAL EXCIPIENTS MARKET FOR SUGAR ALCOHOLS, BY REGION, 2023–2030 (USD MILLION)
TABLE 133
NORTH AMERICA: PHARMACEUTICAL EXCIPIENTS MARKET FOR SUGAR ALCOHOLS, BY COUNTRY, 2023–2030 (USD MILLION)
TABLE 134
EUROPE: PHARMACEUTICAL EXCIPIENTS MARKET FOR SUGAR ALCOHOLS, BY COUNTRY, 2023–2030 (USD MILLION)
TABLE 135
ASIA PACIFIC: PHARMACEUTICAL EXCIPIENTS MARKET FOR SUGAR ALCOHOLS, BY COUNTRY, 2023–2030 (USD MILLION)
TABLE 136
LATIN AMERICA: PHARMACEUTICAL EXCIPIENTS MARKET FOR SUGAR ALCOHOLS, BY COUNTRY, 2023–2030 (USD MILLION)
TABLE 137
MIDDLE EAST: PHARMACEUTICAL EXCIPIENTS MARKET FOR SUGAR ALCOHOLS, BY REGION, 2023–2030 (USD MILLION)
TABLE 138
PHARMACEUTICAL EXCIPIENTS MARKET FOR SORBITOL, BY REGION, 2023–2030 (USD MILLION)
TABLE 139
NORTH AMERICA: PHARMACEUTICAL EXCIPIENTS MARKET FOR SORBITOL, BY COUNTRY, 2023–2030 (USD MILLION)
TABLE 140
EUROPE: PHARMACEUTICAL EXCIPIENTS MARKET FOR SORBITOL, BY COUNTRY, 2023–2030 (USD MILLION)
TABLE 141
ASIA PACIFIC: PHARMACEUTICAL EXCIPIENTS MARKET FOR SORBITOL, BY COUNTRY, 2023–2030 (USD MILLION)
TABLE 142
LATIN AMERICA: PHARMACEUTICAL EXCIPIENTS MARKET FOR SORBITOL, BY COUNTRY, 2023–2030 (USD MILLION)
TABLE 143
MIDDLE EAST: PHARMACEUTICAL EXCIPIENTS MARKET FOR SORBITOL, BY REGION, 2023–2030 (USD MILLION)
TABLE 144
PHARMACEUTICAL EXCIPIENTS MARKET FOR MANNITOL, BY REGION, 2023–2030 (USD MILLION)
TABLE 145
NORTH AMERICA: PHARMACEUTICAL EXCIPIENTS MARKET FOR MANNITOL, BY COUNTRY, 2023–2030 (USD MILLION)
TABLE 146
EUROPE: PHARMACEUTICAL EXCIPIENTS MARKET FOR MANNITOL, BY COUNTRY, 2023–2030 (USD MILLION)
TABLE 147
ASIA PACIFIC: PHARMACEUTICAL EXCIPIENTS MARKET FOR MANNITOL, BY COUNTRY, 2023–2030 (USD MILLION)
TABLE 148
LATIN AMERICA: PHARMACEUTICAL EXCIPIENTS MARKET FOR MANNITOL, BY COUNTRY, 2023–2030 (USD MILLION)
TABLE 149
MIDDLE EAST: PHARMACEUTICAL EXCIPIENTS MARKET FOR MANNITOL, BY REGION, 2023–2030 (USD MILLION)
TABLE 150
PHARMACEUTICAL EXCIPIENTS MARKET FOR OTHER SUGAR ALCOHOLS, BY REGION, 2023–2030 (USD MILLION)
TABLE 151
NORTH AMERICA: PHARMACEUTICAL EXCIPIENTS MARKET FOR OTHER SUGAR ALCOHOLS, BY COUNTRY, 2023–2030 (USD MILLION)
TABLE 152
EUROPE: PHARMACEUTICAL EXCIPIENTS MARKET FOR OTHER SUGAR ALCOHOLS, BY COUNTRY, 2023–2030 (USD MILLION)
TABLE 153
ASIA PACIFIC: PHARMACEUTICAL EXCIPIENTS MARKET FOR OTHER SUGAR ALCOHOLS, BY COUNTRY, 2023–2030 (USD MILLION)
TABLE 154
LATIN AMERICA: PHARMACEUTICAL EXCIPIENTS MARKET FOR OTHER SUGAR ALCOHOLS, BY COUNTRY, 2023–2030 (USD MILLION)
TABLE 155
MIDDLE EAST: PHARMACEUTICAL EXCIPIENTS MARKET FOR OTHER SUGAR ALCOHOLS, BY REGION, 2023–2030 (USD MILLION)
TABLE 156
PHARMACEUTICAL EXCIPIENTS MARKET FOR ARTIFICIAL SWEETENERS, BY REGION, 2023–2030 (USD MILLION)
TABLE 157
NORTH AMERICA: PHARMACEUTICAL EXCIPIENTS MARKET FOR ARTIFICIAL SWEETENERS, BY COUNTRY, 2023–2030 (USD MILLION)
TABLE 158
EUROPE: PHARMACEUTICAL EXCIPIENTS MARKET FOR ARTIFICIAL SWEETENERS, BY COUNTRY, 2023–2030 (USD MILLION)
TABLE 159
ASIA PACIFIC: PHARMACEUTICAL EXCIPIENTS MARKET FOR ARTIFICIAL SWEETENERS, BY COUNTRY, 2023–2030 (USD MILLION)
TABLE 160
LATIN AMERICA: PHARMACEUTICAL EXCIPIENTS MARKET FOR ARTIFICIAL SWEETENERS, BY COUNTRY, 2023–2030 (USD MILLION)
TABLE 161
MIDDLE EAST: PHARMACEUTICAL EXCIPIENTS MARKET FOR ARTIFICIAL SWEETENERS, BY REGION, 2023–2030 (USD MILLION)
TABLE 162
PHARMACEUTICAL EXCIPIENTS MARKET FOR CELLULOSE, BY TYPE, 2023–2030 (USD MILLION)
TABLE 163
PHARMACEUTICAL EXCIPIENTS MARKET FOR CELLULOSE, BY REGION, 2023–2030 (USD MILLION)
TABLE 164
NORTH AMERICA: PHARMACEUTICAL EXCIPIENTS MARKET FOR CELLULOSE, BY COUNTRY, 2023–2030 (USD MILLION)
TABLE 165
EUROPE: PHARMACEUTICAL EXCIPIENTS MARKET FOR CELLULOSE, BY COUNTRY, 2023–2030 (USD MILLION)
TABLE 166
ASIA PACIFIC: PHARMACEUTICAL EXCIPIENTS MARKET FOR CELLULOSE, BY COUNTRY, 2023–2030 (USD MILLION)
TABLE 167
LATIN AMERICA: PHARMACEUTICAL EXCIPIENTS MARKET FOR CELLULOSE, BY COUNTRY, 2023–2030 (USD MILLION)
TABLE 168
MIDDLE EAST: PHARMACEUTICAL EXCIPIENTS MARKET FOR CELLULOSE, BY REGION, 2023–2030 (USD MILLION)
TABLE 169
PHARMACEUTICAL EXCIPIENTS MARKET FOR MICROCRYSTALLINE CELLULOSE, BY REGION, 2023–2030 (USD MILLION)
TABLE 170
NORTH AMERICA: PHARMACEUTICAL EXCIPIENTS MARKET FOR MICROCRYSTALLINE CELLULOSE, BY COUNTRY, 2023–2030 (USD MILLION)
TABLE 171
EUROPE: PHARMACEUTICAL EXCIPIENTS MARKET FOR MICROCRYSTALLINE CELLULOSE, BY COUNTRY, 2023–2030 (USD MILLION)
TABLE 172
ASIA PACIFIC: PHARMACEUTICAL EXCIPIENTS MARKET FOR MICROCRYSTALLINE CELLULOSE, BY COUNTRY, 2023–2030 (USD MILLION)
TABLE 173
LATIN AMERICA: PHARMACEUTICAL EXCIPIENTS MARKET FOR MICROCRYSTALLINE CELLULOSE, BY COUNTRY, 2023–2030 (USD MILLION)
TABLE 174
MIDDLE EAST: PHARMACEUTICAL EXCIPIENTS MARKET FOR MICROCRYSTALLINE CELLULOSE, BY REGION, 2023–2030 (USD MILLION)
TABLE 175
PHARMACEUTICAL EXCIPIENTS MARKET FOR CELLULOSE ETHERS, BY REGION, 2023–2030 (USD MILLION)
TABLE 176
NORTH AMERICA: PHARMACEUTICAL EXCIPIENTS MARKET FOR CELLULOSE ETHERS, BY COUNTRY, 2023–2030 (USD MILLION)
TABLE 177
EUROPE: PHARMACEUTICAL EXCIPIENTS MARKET FOR CELLULOSE ETHERS, BY COUNTRY, 2023–2030 (USD MILLION)
TABLE 178
ASIA PACIFIC: PHARMACEUTICAL EXCIPIENTS MARKET FOR CELLULOSE ETHERS, BY COUNTRY, 2023–2030 (USD MILLION)
TABLE 179
LATIN AMERICA: PHARMACEUTICAL EXCIPIENTS MARKET FOR CELLULOSE ETHERS, BY COUNTRY, 2023–2030 (USD MILLION)
TABLE 180
MIDDLE EAST: PHARMACEUTICAL EXCIPIENTS MARKET FOR CELLULOSE ETHERS, BY REGION, 2023–2030 (USD MILLION)
TABLE 181
PHARMACEUTICAL EXCIPIENTS MARKET FOR CMC & CROSCARMELLOSE SODIUM, BY REGION, 2023–2030 (USD MILLION)
TABLE 182
NORTH AMERICA: PHARMACEUTICAL EXCIPIENTS MARKET FOR CMC & CROSCARMELLOSE SODIUM, BY COUNTRY, 2023–2030 (USD MILLION)
TABLE 183
EUROPE: PHARMACEUTICAL EXCIPIENTS MARKET FOR CMC & CROSCARMELLOSE SODIUM, BY COUNTRY, 2023–2030 (USD MILLION)
TABLE 184
ASIA PACIFIC: PHARMACEUTICAL EXCIPIENTS MARKET FOR CMC & CROSCARMELLOSE SODIUM, BY COUNTRY, 2023–2030 (USD MILLION)
TABLE 185
LATIN AMERICA: PHARMACEUTICAL EXCIPIENTS MARKET FOR CMC & CROSCARMELLOSE SODIUM, BY COUNTRY, 2023–2030 (USD MILLION)
TABLE 186
MIDDLE EAST: PHARMACEUTICAL EXCIPIENTS MARKET FOR CMC & CROSCARMELLOSE SODIUM, BY REGION, 2023–2030 (USD MILLION)
TABLE 187
PHARMACEUTICAL EXCIPIENTS MARKET FOR CELLULOSE ESTERS, BY REGION, 2023–2030 (USD MILLION)
TABLE 188
NORTH AMERICA: PHARMACEUTICAL EXCIPIENTS MARKET FOR CELLULOSE ESTERS, BY COUNTRY, 2023–2030 (USD MILLION)
TABLE 189
EUROPE: PHARMACEUTICAL EXCIPIENTS MARKET FOR CELLULOSE ESTERS, BY COUNTRY, 2023–2030 (USD MILLION)
TABLE 190
ASIA PACIFIC: PHARMACEUTICAL EXCIPIENTS MARKET FOR CELLULOSE ESTERS, BY COUNTRY, 2023–2030 (USD MILLION)
TABLE 191
LATIN AMERICA: PHARMACEUTICAL EXCIPIENTS MARKET FOR CELLULOSE ESTERS, BY COUNTRY, 2023–2030 (USD MILLION)
TABLE 192
MIDDLE EAST: PHARMACEUTICAL EXCIPIENTS MARKET FOR CELLULOSE ESTERS, BY REGION, 2023–2030 (USD MILLION)
TABLE 193
PHARMACEUTICAL EXCIPIENTS MARKET FOR STARCH, BY TYPE, 2023–2030 (USD MILLION)
TABLE 194
PHARMACEUTICAL EXCIPIENTS MARKET FOR STARCH, BY REGION, 2023–2030 (USD MILLION)
TABLE 195
NORTH AMERICA: PHARMACEUTICAL EXCIPIENTS MARKET FOR STARCH, BY COUNTRY, 2023–2030 (USD MILLION)
TABLE 196
EUROPE: PHARMACEUTICAL EXCIPIENTS MARKET FOR STARCH, BY COUNTRY, 2023–2030 (USD MILLION)
TABLE 197
ASIA PACIFIC: PHARMACEUTICAL EXCIPIENTS MARKET FOR STARCH, BY COUNTRY, 2023–2030 (USD MILLION)
TABLE 198
LATIN AMERICA: PHARMACEUTICAL EXCIPIENTS MARKET FOR STARCH, BY COUNTRY, 2023–2030 (USD MILLION)
TABLE 199
MIDDLE EAST: PHARMACEUTICAL EXCIPIENTS MARKET FOR STARCH, BY REGION, 2023–2030 (USD MILLION)
TABLE 200
PHARMACEUTICAL EXCIPIENTS MARKET FOR MODIFIED STARCH, BY REGION, 2023–2030 (USD MILLION)
TABLE 201
NORTH AMERICA: PHARMACEUTICAL EXCIPIENTS MARKET FOR MODIFIED STARCH, BY COUNTRY, 2023–2030 (USD MILLION)
TABLE 202
EUROPE: PHARMACEUTICAL EXCIPIENTS MARKET FOR MODIFIED STARCH, BY COUNTRY, 2023–2030 (USD MILLION)
TABLE 203
ASIA PACIFIC: PHARMACEUTICAL EXCIPIENTS MARKET FOR MODIFIED STARCH, BY COUNTRY, 2023–2030 (USD MILLION)
TABLE 204
LATIN AMERICA: PHARMACEUTICAL EXCIPIENTS MARKET FOR MODIFIED STARCH, BY COUNTRY, 2023–2030 (USD MILLION)
TABLE 205
MIDDLE EAST: PHARMACEUTICAL EXCIPIENTS MARKET FOR MODIFIED STARCH, BY REGION, 2023–2030 (USD MILLION)
TABLE 206
PHARMACEUTICAL EXCIPIENTS MARKET FOR DRIED STARCH, BY REGION, 2023–2030 (USD MILLION)
TABLE 207
NORTH AMERICA: PHARMACEUTICAL EXCIPIENTS MARKET FOR DRIED STARCH, BY COUNTRY, 2023–2030 (USD MILLION)
TABLE 208
EUROPE: PHARMACEUTICAL EXCIPIENTS MARKET FOR DRIED STARCH, BY COUNTRY, 2023–2030 (USD MILLION)
TABLE 209
ASIA PACIFIC: PHARMACEUTICAL EXCIPIENTS MARKET FOR DRIED STARCH, BY COUNTRY, 2023–2030 (USD MILLION)
TABLE 210
LATIN AMERICA: PHARMACEUTICAL EXCIPIENTS MARKET FOR DRIED STARCH, BY COUNTRY, 2023–2030 (USD MILLION)
TABLE 211
MIDDLE EAST: PHARMACEUTICAL EXCIPIENTS MARKET FOR DRIED STARCH, BY REGION, 2023–2030 (USD MILLION)
TABLE 212
PHARMACEUTICAL EXCIPIENTS MARKET FOR CONVERTED STARCH, BY REGION, 2023–2030 (USD MILLION)
TABLE 213
NORTH AMERICA: PHARMACEUTICAL EXCIPIENTS MARKET FOR CONVERTED STARCH, BY COUNTRY, 2023–2030 (USD MILLION)
TABLE 214
EUROPE: PHARMACEUTICAL EXCIPIENTS MARKET FOR CONVERTED STARCH, BY COUNTRY, 2023–2030 (USD MILLION)
TABLE 215
ASIA PACIFIC: PHARMACEUTICAL EXCIPIENTS MARKET FOR CONVERTED STARCH, BY COUNTRY, 2023–2030 (USD MILLION)
TABLE 216
LATIN AMERICA: PHARMACEUTICAL EXCIPIENTS MARKET FOR CONVERTED STARCH, BY COUNTRY, 2023–2030 (USD MILLION)
TABLE 217
MIDDLE EAST: PHARMACEUTICAL EXCIPIENTS MARKET FOR CONVERTED STARCH, BY REGION, 2023–2030 (USD MILLION)
TABLE 218
PHARMACEUTICAL EXCIPIENTS MARKET FOR PETROCHEMICALS, BY TYPE, 2023–2030 (USD MILLION)
TABLE 219
PHARMACEUTICAL EXCIPIENTS MARKET FOR PETROCHEMICALS, BY REGION, 2023–2030 (USD MILLION)
TABLE 220
NORTH AMERICA: PHARMACEUTICAL EXCIPIENTS MARKET FOR PETROCHEMICALS, BY COUNTRY, 2023–2030 (USD MILLION)
TABLE 221
EUROPE: PHARMACEUTICAL EXCIPIENTS MARKET FOR PETROCHEMICALS, BY COUNTRY, 2023–2030 (USD MILLION)
TABLE 222
ASIA PACIFIC: PHARMACEUTICAL EXCIPIENTS MARKET FOR PETROCHEMICALS, BY COUNTRY, 2023–2030 (USD MILLION)
TABLE 223
LATIN AMERICA: PHARMACEUTICAL EXCIPIENTS MARKET FOR PETROCHEMICALS, BY COUNTRY, 2023–2030 (USD MILLION)
TABLE 224
MIDDLE EAST: PHARMACEUTICAL EXCIPIENTS MARKET FOR PETROCHEMICALS, BY REGION, 2023–2030 (USD MILLION)
TABLE 225
PHARMACEUTICAL EXCIPIENTS MARKET FOR GLYCOLS, BY TYPE, 2023–2030 (USD MILLION)
TABLE 226
PHARMACEUTICAL EXCIPIENTS MARKET FOR GLYCOLS, BY REGION, 2023–2030 (USD MILLION)
TABLE 227
NORTH AMERICA: PHARMACEUTICAL EXCIPIENTS MARKET FOR GLYCOLS, BY COUNTRY, 2023–2030 (USD MILLION)
TABLE 228
EUROPE: PHARMACEUTICAL EXCIPIENTS MARKET FOR GLYCOLS, BY COUNTRY, 2023–2030 (USD MILLION)
TABLE 229
ASIA PACIFIC: PHARMACEUTICAL EXCIPIENTS MARKET FOR GLYCOLS, BY COUNTRY, 2023–2030 (USD MILLION)
TABLE 230
LATIN AMERICA: PHARMACEUTICAL EXCIPIENTS MARKET FOR GLYCOLS, BY COUNTRY, 2023–2030 (USD MILLION)
TABLE 231
MIDDLE EAST: PHARMACEUTICAL EXCIPIENTS MARKET FOR GLYCOLS, BY REGION, 2023–2030 (USD MILLION)
TABLE 232
PHARMACEUTICAL EXCIPIENTS MARKET FOR POLYETHYLENE GLYCOL, BY REGION, 2023–2030 (USD MILLION)
TABLE 233
NORTH AMERICA: PHARMACEUTICAL EXCIPIENTS MARKET FOR POLYETHYLENE GLYCOL, BY COUNTRY, 2023–2030 (USD MILLION)
TABLE 234
EUROPE: PHARMACEUTICAL EXCIPIENTS MARKET FOR POLYETHYLENE GLYCOL, BY COUNTRY, 2023–2030 (USD MILLION)
TABLE 235
ASIA PACIFIC: PHARMACEUTICAL EXCIPIENTS MARKET FOR POLYETHYLENE GLYCOL, BY COUNTRY, 2023–2030 (USD MILLION)
TABLE 236
LATIN AMERICA: PHARMACEUTICAL EXCIPIENTS MARKET FOR POLYETHYLENE GLYCOL, BY COUNTRY, 2023–2030 (USD MILLION)
TABLE 237
MIDDLE EAST: PHARMACEUTICAL EXCIPIENTS MARKET FOR POLYETHYLENE GLYCOL, BY REGION, 2023–2030 (USD MILLION)
TABLE 238
PHARMACEUTICAL EXCIPIENTS MARKET FOR PROPYLENE GLYCOL, BY REGION, 2023–2030 (USD MILLION)
TABLE 239
NORTH AMERICA: PHARMACEUTICAL EXCIPIENTS MARKET FOR PROPYLENE GLYCOL, BY COUNTRY, 2023–2030 (USD MILLION)
TABLE 240
EUROPE: PHARMACEUTICAL EXCIPIENTS MARKET FOR PROPYLENE GLYCOL, BY COUNTRY, 2023–2030 (USD MILLION)
TABLE 241
ASIA PACIFIC: PHARMACEUTICAL EXCIPIENTS MARKET FOR PROPYLENE GLYCOL, BY COUNTRY, 2023–2030 (USD MILLION)
TABLE 242
LATIN AMERICA: PHARMACEUTICAL EXCIPIENTS MARKET FOR PROPYLENE GLYCOL, BY COUNTRY, 2023–2030 (USD MILLION)
TABLE 243
MIDDLE EAST: PHARMACEUTICAL EXCIPIENTS MARKET FOR PROPYLENE GLYCOL, BY REGION, 2023–2030 (USD MILLION)
TABLE 244
PHARMACEUTICAL EXCIPIENTS MARKET FOR POVIDONES, BY REGION, 2023–2030 (USD MILLION)
TABLE 245
NORTH AMERICA: PHARMACEUTICAL EXCIPIENTS MARKET FOR POVIDONES, BY COUNTRY, 2023–2030 (USD MILLION)
TABLE 246
EUROPE: PHARMACEUTICAL EXCIPIENTS MARKET FOR POVIDONES, BY COUNTRY, 2023–2030 (USD MILLION)
TABLE 247
ASIA PACIFIC: PHARMACEUTICAL EXCIPIENTS MARKET FOR POVIDONES, BY COUNTRY, 2023–2030 (USD MILLION)
TABLE 248
LATIN AMERICA: PHARMACEUTICAL EXCIPIENTS MARKET FOR POVIDONES, BY COUNTRY, 2023–2030 (USD MILLION)
TABLE 249
MIDDLE EAST: PHARMACEUTICAL EXCIPIENTS MARKET FOR POVIDONES, BY REGION, 2023–2030 (USD MILLION)
TABLE 250
PHARMACEUTICAL EXCIPIENTS MARKET FOR MINERAL HYDROCARBONS, BY TYPE, 2023–2030 (USD MILLION)
TABLE 251
PHARMACEUTICAL EXCIPIENTS MARKET FOR MINERAL HYDROCARBONS, BY REGION, 2023–2030 (USD MILLION)
TABLE 252
NORTH AMERICA: PHARMACEUTICAL EXCIPIENTS MARKET FOR MINERAL HYDROCARBONS, BY COUNTRY, 2023–2030 (USD MILLION)
TABLE 253
EUROPE: PHARMACEUTICAL EXCIPIENTS MARKET FOR MINERAL HYDROCARBONS, BY COUNTRY, 2023–2030 (USD MILLION)
TABLE 254
ASIA PACIFIC: PHARMACEUTICAL EXCIPIENTS MARKET FOR MINERAL HYDROCARBONS, BY COUNTRY, 2023–2030 (USD MILLION)
TABLE 255
LATIN AMERICA: PHARMACEUTICAL EXCIPIENTS MARKET FOR MINERAL HYDROCARBONS, BY COUNTRY, 2023–2030 (USD MILLION)
TABLE 256
MIDDLE EAST: PHARMACEUTICAL EXCIPIENTS MARKET FOR MINERAL HYDROCARBONS, BY REGION, 2023–2030 (USD MILLION)
TABLE 257
PHARMACEUTICAL EXCIPIENTS MARKET FOR PETROLATUM, BY REGION, 2023–2030 (USD MILLION)
TABLE 258
NORTH AMERICA: PHARMACEUTICAL EXCIPIENTS MARKET FOR PETROLATUM, BY COUNTRY, 2023–2030 (USD MILLION)
TABLE 259
EUROPE: PHARMACEUTICAL EXCIPIENTS MARKET FOR PETROLATUM, BY COUNTRY, 2023–2030 (USD MILLION)
TABLE 260
ASIA PACIFIC: PHARMACEUTICAL EXCIPIENTS MARKET FOR PETROLATUM, BY COUNTRY, 2023–2030 (USD MILLION)
TABLE 261
LATIN AMERICA: PHARMACEUTICAL EXCIPIENTS MARKET FOR PETROLATUM, BY COUNTRY, 2023–2030 (USD MILLION)
TABLE 262
MIDDLE EAST: PHARMACEUTICAL EXCIPIENTS MARKET FOR PETROLATUM, BY REGION, 2023–2030 (USD MILLION)
TABLE 263
PHARMACEUTICAL EXCIPIENTS MARKET FOR MINERAL WAXES, BY REGION, 2023–2030 (USD MILLION)
TABLE 264
NORTH AMERICA: PHARMACEUTICAL EXCIPIENTS MARKET FOR MINERAL WAXES, BY COUNTRY, 2023–2030 (USD MILLION)
TABLE 265
EUROPE: PHARMACEUTICAL EXCIPIENTS MARKET FOR MINERAL WAXES, BY COUNTRY, 2023–2030 (USD MILLION)
TABLE 266
ASIA PACIFIC: PHARMACEUTICAL EXCIPIENTS MARKET FOR MINERAL WAXES, BY COUNTRY, 2023–2030 (USD MILLION)
TABLE 267
LATIN AMERICA: PHARMACEUTICAL EXCIPIENTS MARKET FOR MINERAL WAXES, BY COUNTRY, 2023–2030 (USD MILLION)
TABLE 268
MIDDLE EAST: PHARMACEUTICAL EXCIPIENTS MARKET FOR MINERAL WAXES, BY REGION, 2023–2030 (USD MILLION)
TABLE 269
PHARMACEUTICAL EXCIPIENTS MARKET FOR MINERAL OILS, BY REGION, 2023–2030 (USD MILLION)
TABLE 270
NORTH AMERICA: PHARMACEUTICAL EXCIPIENTS MARKET FOR MINERAL OILS, BY COUNTRY, 2023–2030 (USD MILLION)
TABLE 271
EUROPE: PHARMACEUTICAL EXCIPIENTS MARKET FOR MINERAL OILS, BY COUNTRY, 2023–2030 (USD MILLION)
TABLE 272
ASIA PACIFIC: PHARMACEUTICAL EXCIPIENTS MARKET FOR MINERAL OILS, BY COUNTRY, 2023–2030 (USD MILLION)
TABLE 273
LATIN AMERICA: PHARMACEUTICAL EXCIPIENTS MARKET FOR MINERAL OILS, BY COUNTRY, 2023–2030 (USD MILLION)
TABLE 274
MIDDLE EAST: PHARMACEUTICAL EXCIPIENTS MARKET FOR MINERAL OILS, BY REGION, 2023–2030 (USD MILLION)
TABLE 275
PHARMACEUTICAL EXCIPIENTS MARKET FOR ACRYLIC POLYMERS, BY REGION, 2023–2030 (USD MILLION)
TABLE 276
NORTH AMERICA: PHARMACEUTICAL EXCIPIENTS MARKET FOR ACRYLIC POLYMERS, BY COUNTRY, 2023–2030 (USD MILLION)
TABLE 277
EUROPE: PHARMACEUTICAL EXCIPIENTS MARKET FOR ACRYLIC POLYMERS, BY COUNTRY, 2023–2030 (USD MILLION)
TABLE 278
ASIA PACIFIC: PHARMACEUTICAL EXCIPIENTS MARKET FOR ACRYLIC POLYMERS, BY COUNTRY, 2023–2030 (USD MILLION)
TABLE 279
LATIN AMERICA: PHARMACEUTICAL EXCIPIENTS MARKET FOR ACRYLIC POLYMERS, BY COUNTRY, 2023–2030 (USD MILLION)
TABLE 280
MIDDLE EAST: PHARMACEUTICAL EXCIPIENTS MARKET FOR ACRYLIC POLYMERS, BY REGION, 2023–2030 (USD MILLION)
TABLE 281
PHARMACEUTICAL EXCIPIENTS MARKET FOR OTHER PETROCHEMICALS, BY REGION, 2023–2030 (USD MILLION)
TABLE 282
NORTH AMERICA: PHARMACEUTICAL EXCIPIENTS MARKET FOR OTHER PETROCHEMICALS, BY COUNTRY, 2023–2030 (USD MILLION)
TABLE 283
EUROPE: PHARMACEUTICAL EXCIPIENTS MARKET FOR OTHER PETROCHEMICALS, BY COUNTRY, 2023–2030 (USD MILLION)
TABLE 284
ASIA PACIFIC: PHARMACEUTICAL EXCIPIENTS MARKET FOR OTHER PETROCHEMICALS, BY COUNTRY, 2023–2030 (USD MILLION)
TABLE 285
LATIN AMERICA: PHARMACEUTICAL EXCIPIENTS MARKET FOR OTHER PETROCHEMICALS, BY COUNTRY, 2023–2030 (USD MILLION)
TABLE 286
MIDDLE EAST: PHARMACEUTICAL EXCIPIENTS MARKET FOR OTHER PETROCHEMICALS, BY REGION, 2023–2030 (USD MILLION)
TABLE 287
PHARMACEUTICAL EXCIPIENTS MARKET FOR PROTEINS, BY REGION, 2023–2030 (USD MILLION)
TABLE 288
NORTH AMERICA: PHARMACEUTICAL EXCIPIENTS MARKET FOR PROTEINS, BY COUNTRY, 2023–2030 (USD MILLION)
TABLE 289
EUROPE: PHARMACEUTICAL EXCIPIENTS MARKET FOR PROTEINS, BY COUNTRY, 2023–2030 (USD MILLION)
TABLE 290
ASIA PACIFIC: PHARMACEUTICAL EXCIPIENTS MARKET FOR PROTEINS, BY COUNTRY, 2023–2030 (USD MILLION)
TABLE 291
LATIN AMERICA: PHARMACEUTICAL EXCIPIENTS MARKET FOR PROTEINS, BY COUNTRY, 2023–2030 (USD MILLION)
TABLE 292
MIDDLE EAST: PHARMACEUTICAL EXCIPIENTS MARKET FOR PROTEINS, BY REGION, 2023–2030 (USD MILLION)
TABLE 293
PHARMACEUTICAL EXCIPIENTS MARKET FOR OTHER ORGANIC CHEMICALS, BY REGION, 2023–2030 (USD MILLION)
TABLE 294
NORTH AMERICA: PHARMACEUTICAL EXCIPIENTS MARKET FOR OTHER ORGANIC CHEMICALS, BY COUNTRY, 2023–2030 (USD MILLION)
TABLE 295
EUROPE: PHARMACEUTICAL EXCIPIENTS MARKET FOR OTHER ORGANIC CHEMICALS, BY COUNTRY, 2023–2030 (USD MILLION)
TABLE 296
ASIA PACIFIC: PHARMACEUTICAL EXCIPIENTS MARKET FOR OTHER ORGANIC CHEMICALS, BY COUNTRY, 2023–2030 (USD MILLION)
TABLE 297
LATIN AMERICA: PHARMACEUTICAL EXCIPIENTS MARKET FOR OTHER ORGANIC CHEMICALS, BY COUNTRY, 2023–2030 (USD MILLION)
TABLE 298
MIDDLE EAST: PHARMACEUTICAL EXCIPIENTS MARKET FOR OTHER ORGANIC CHEMICALS, BY REGION, 2023–2030 (USD MILLION)
TABLE 299
PHARMACEUTICAL EXCIPIENTS MARKET FOR INORGANIC CHEMICALS, BY TYPE, 2023–2030 (USD MILLION)
TABLE 300
PHARMACEUTICAL EXCIPIENTS MARKET FOR INORGANIC CHEMICALS, BY REGION, 2023–2030 (USD MILLION)
TABLE 301
NORTH AMERICA: PHARMACEUTICAL EXCIPIENTS MARKET FOR INORGANIC CHEMICALS, BY COUNTRY, 2023–2030 (USD MILLION)
TABLE 302
EUROPE: PHARMACEUTICAL EXCIPIENTS MARKET FOR INORGANIC CHEMICALS, BY COUNTRY, 2023–2030 (USD MILLION)
TABLE 303
ASIA PACIFIC: PHARMACEUTICAL EXCIPIENTS MARKET FOR INORGANIC CHEMICALS, BY COUNTRY, 2023–2030 (USD MILLION)
TABLE 304
LATIN AMERICA: PHARMACEUTICAL EXCIPIENTS MARKET FOR INORGANIC CHEMICALS, BY COUNTRY, 2023–2030 (USD MILLION)
TABLE 305
MIDDLE EAST: PHARMACEUTICAL EXCIPIENTS MARKET FOR INORGANIC CHEMICALS, BY REGION, 2023–2030 (USD MILLION)
TABLE 306
PHARMACEUTICAL EXCIPIENTS MARKET FOR CALCIUM PHOSPHATE, BY REGION, 2023–2030 (USD MILLION)
TABLE 307
NORTH AMERICA: PHARMACEUTICAL EXCIPIENTS MARKET FOR CALCIUM PHOSPHATE, BY COUNTRY, 2023–2030 (USD MILLION)
TABLE 308
EUROPE: PHARMACEUTICAL EXCIPIENTS MARKET FOR CALCIUM PHOSPHATE, BY COUNTRY, 2023–2030 (USD MILLION)
TABLE 309
ASIA PACIFIC: PHARMACEUTICAL EXCIPIENTS MARKET FOR CALCIUM PHOSPHATE, BY COUNTRY, 2023–2030 (USD MILLION)
TABLE 310
LATIN AMERICA: PHARMACEUTICAL EXCIPIENTS MARKET FOR CALCIUM PHOSPHATE, BY COUNTRY, 2023–2030 (USD MILLION)
TABLE 311
MIDDLE EAST: PHARMACEUTICAL EXCIPIENTS MARKET FOR CALCIUM PHOSPHATE, BY REGION, 2023–2030 (USD MILLION)
TABLE 312
PHARMACEUTICAL EXCIPIENTS MARKET FOR METAL OXIDES, BY REGION, 2023–2030 (USD MILLION)
TABLE 313
NORTH AMERICA: PHARMACEUTICAL EXCIPIENTS MARKET FOR METAL OXIDES, BY COUNTRY, 2023–2030 (USD MILLION)
TABLE 314
EUROPE: PHARMACEUTICAL EXCIPIENTS MARKET FOR METAL OXIDES, BY COUNTRY, 2023–2030 (USD MILLION)
TABLE 315
ASIA PACIFIC: PHARMACEUTICAL EXCIPIENTS MARKET FOR METAL OXIDES, BY COUNTRY, 2023–2030 (USD MILLION)
TABLE 316
LATIN AMERICA: PHARMACEUTICAL EXCIPIENTS MARKET FOR METAL OXIDES, BY COUNTRY, 2023–2030 (USD MILLION)
TABLE 317
MIDDLE EAST: PHARMACEUTICAL EXCIPIENTS MARKET FOR METAL OXIDES, BY REGION, 2023–2030 (USD MILLION)
TABLE 318
PHARMACEUTICAL EXCIPIENTS MARKET FOR HALITES, BY REGION, 2023–2030 (USD MILLION)
TABLE 319
NORTH AMERICA: PHARMACEUTICAL EXCIPIENTS MARKET FOR HALITES, BY COUNTRY, 2023–2030 (USD MILLION)
TABLE 320
EUROPE: PHARMACEUTICAL EXCIPIENTS MARKET FOR HALITES, BY COUNTRY, 2023–2030 (USD MILLION)
TABLE 321
ASIA PACIFIC: PHARMACEUTICAL EXCIPIENTS MARKET FOR HALITES, BY COUNTRY, 2023–2030 (USD MILLION)
TABLE 322
LATIN AMERICA: PHARMACEUTICAL EXCIPIENTS MARKET FOR HALITES, BY COUNTRY, 2023–2030 (USD MILLION)
TABLE 323
MIDDLE EAST: PHARMACEUTICAL EXCIPIENTS MARKET FOR HALITES, BY REGION, 2023–2030 (USD MILLION)
TABLE 324
PHARMACEUTICAL EXCIPIENTS MARKET FOR CALCIUM CARBONATE, BY REGION, 2023–2030 (USD MILLION)
TABLE 325
NORTH AMERICA: PHARMACEUTICAL EXCIPIENTS MARKET FOR CALCIUM CARBONATE, BY COUNTRY, 2023–2030 (USD MILLION)
TABLE 326
EUROPE: PHARMACEUTICAL EXCIPIENTS MARKET FOR CALCIUM CARBONATE, BY COUNTRY, 2023–2030 (USD MILLION)
TABLE 327
ASIA PACIFIC: PHARMACEUTICAL EXCIPIENTS MARKET FOR CALCIUM CARBONATE, BY COUNTRY, 2023–2030 (USD MILLION)
TABLE 328
LATIN AMERICA: PHARMACEUTICAL EXCIPIENTS MARKET FOR CALCIUM CARBONATE, BY COUNTRY, 2023–2030 (USD MILLION)
TABLE 329
MIDDLE EAST: PHARMACEUTICAL EXCIPIENTS MARKET FOR CALCIUM CARBONATE, BY REGION, 2023–2030 (USD MILLION)
TABLE 330
PHARMACEUTICAL EXCIPIENTS MARKET FOR CALCIUM SULFATE, BY REGION, 2023–2030 (USD MILLION)
TABLE 331
NORTH AMERICA: PHARMACEUTICAL EXCIPIENTS MARKET FOR CALCIUM SULFATE, BY COUNTRY, 2023–2030 (USD MILLION)
TABLE 332
EUROPE: PHARMACEUTICAL EXCIPIENTS MARKET FOR CALCIUM SULFATE, BY COUNTRY, 2023–2030 (USD MILLION)
TABLE 333
ASIA PACIFIC: PHARMACEUTICAL EXCIPIENTS MARKET FOR CALCIUM SULFATE, BY COUNTRY, 2023–2030 (USD MILLION)
TABLE 334
LATIN AMERICA: PHARMACEUTICAL EXCIPIENTS MARKET FOR CALCIUM SULFATE, BY COUNTRY, 2023–2030 (USD MILLION)
TABLE 335
MIDDLE EAST: PHARMACEUTICAL EXCIPIENTS MARKET FOR CALCIUM SULFATE, BY REGION, 2023–2030 (USD MILLION)
TABLE 336
PHARMACEUTICAL EXCIPIENTS MARKET FOR OTHER INORGANIC CHEMICALS, BY REGION, 2023–2030 (USD MILLION)
TABLE 337
NORTH AMERICA: PHARMACEUTICAL EXCIPIENTS MARKET FOR OTHER INORGANIC CHEMICALS, BY COUNTRY, 2023–2030 (USD MILLION)
TABLE 338
EUROPE: PHARMACEUTICAL EXCIPIENTS MARKET FOR OTHER INORGANIC CHEMICALS, BY COUNTRY, 2023–2030 (USD MILLION)
TABLE 339
ASIA PACIFIC: PHARMACEUTICAL EXCIPIENTS MARKET FOR OTHER INORGANIC CHEMICALS, BY COUNTRY, 2023–2030 (USD MILLION)
TABLE 340
LATIN AMERICA: PHARMACEUTICAL EXCIPIENTS MARKET FOR OTHER INORGANIC CHEMICALS, BY COUNTRY, 2023–2030 (USD MILLION)
TABLE 341
MIDDLE EAST: PHARMACEUTICAL EXCIPIENTS MARKET FOR OTHER INORGANIC CHEMICALS, BY REGION, 2023–2030 (USD MILLION)
TABLE 342
PHARMACEUTICAL EXCIPIENTS MARKET FOR OTHER CHEMICALS, BY REGION, 2023–2030 (USD MILLION)
TABLE 343
NORTH AMERICA: PHARMACEUTICAL EXCIPIENTS MARKET FOR OTHER CHEMICALS, BY COUNTRY, 2023–2030 (USD MILLION)
TABLE 344
EUROPE: PHARMACEUTICAL EXCIPIENTS MARKET FOR OTHER CHEMICALS, BY COUNTRY, 2023–2030 (USD MILLION)
TABLE 345
ASIA PACIFIC: PHARMACEUTICAL EXCIPIENTS MARKET FOR OTHER CHEMICALS, BY COUNTRY, 2023–2030 (USD MILLION)
TABLE 346
LATIN AMERICA: PHARMACEUTICAL EXCIPIENTS MARKET FOR OTHER CHEMICALS, BY COUNTRY, 2023–2030 (USD MILLION)
TABLE 347
MIDDLE EAST: PHARMACEUTICAL EXCIPIENTS MARKET FOR OTHER CHEMICALS, BY REGION, 2023–2030 (USD MILLION)
TABLE 348
PHARMACEUTICAL EXCIPIENTS MARKET, BY FUNCTIONALITY, 2023–2030 (USD MILLION)
TABLE 349
PHARMACEUTICAL EXCIPIENTS MARKET FOR FILLERS & DILUENTS, BY REGION, 2023–2030 (USD MILLION)
TABLE 350
NORTH AMERICA: PHARMACEUTICAL EXCIPIENTS MARKET FOR FILLERS & DILUENTS, BY COUNTRY, 2023–2030 (USD MILLION)
TABLE 351
EUROPE: PHARMACEUTICAL EXCIPIENTS MARKET FOR FILLERS & DILUENTS, BY COUNTRY, 2023–2030 (USD MILLION)
TABLE 352
ASIA PACIFIC: PHARMACEUTICAL EXCIPIENTS MARKET FOR FILLERS & DILUENTS, BY COUNTRY, 2023–2030 (USD MILLION)
TABLE 353
LATIN AMERICA: PHARMACEUTICAL EXCIPIENTS MARKET FOR FILLERS & DILUENTS, BY COUNTRY, 2023–2030 (USD MILLION)
TABLE 354
MIDDLE EAST: PHARMACEUTICAL EXCIPIENTS MARKET FOR FILLERS & DILUENTS, BY REGION, 2023–2030 (USD MILLION)
TABLE 355
PHARMACEUTICAL EXCIPIENTS MARKET FOR SUSPENDING & VISCOSITY AGENTS, BY REGION, 2023–2030 (USD MILLION)
TABLE 356
NORTH AMERICA: PHARMACEUTICAL EXCIPIENTS MARKET FOR SUSPENDING & VISCOSITY AGENTS, BY COUNTRY, 2023–2030 (USD MILLION)
TABLE 357
EUROPE: PHARMACEUTICAL EXCIPIENTS MARKET FOR SUSPENDING & VISCOSITY AGENTS, BY COUNTRY, 2023–2030 (USD MILLION)
TABLE 358
ASIA PACIFIC: PHARMACEUTICAL EXCIPIENTS MARKET FOR SUSPENDING & VISCOSITY AGENTS, BY COUNTRY, 2023–2030 (USD MILLION)
TABLE 359
LATIN AMERICA: PHARMACEUTICAL EXCIPIENTS MARKET FOR SUSPENDING & VISCOSITY AGENTS, BY COUNTRY, 2023–2030 (USD MILLION)
TABLE 360
MIDDLE EAST: PHARMACEUTICAL EXCIPIENTS MARKET FOR SUSPENDING & VISCOSITY AGENTS, BY REGION, 2023–2030 (USD MILLION)
TABLE 361
PHARMACEUTICAL EXCIPIENTS MARKET FOR COATING AGENTS, BY REGION, 2023–2030 (USD MILLION)
TABLE 362
NORTH AMERICA: PHARMACEUTICAL EXCIPIENTS MARKET FOR COATING AGENTS, BY COUNTRY, 2023–2030 (USD MILLION)
TABLE 363
EUROPE: PHARMACEUTICAL EXCIPIENTS MARKET FOR COATING AGENTS, BY COUNTRY, 2023–2030 (USD MILLION)
TABLE 364
ASIA PACIFIC: PHARMACEUTICAL EXCIPIENTS MARKET FOR COATING AGENTS, BY COUNTRY, 2023–2030 (USD MILLION)
TABLE 365
LATIN AMERICA: PHARMACEUTICAL EXCIPIENTS MARKET FOR COATING AGENTS, BY COUNTRY, 2023–2030 (USD MILLION)
TABLE 366
MIDDLE EAST: PHARMACEUTICAL EXCIPIENTS MARKET FOR COATING AGENTS, BY REGION, 2023–2030 (USD MILLION)
TABLE 367
PHARMACEUTICAL EXCIPIENTS MARKET FOR BINDERS, BY REGION, 2023–2030 (USD MILLION)
TABLE 368
NORTH AMERICA: PHARMACEUTICAL EXCIPIENTS MARKET FOR BINDERS, BY COUNTRY, 2023–2030 (USD MILLION)
TABLE 369
EUROPE: PHARMACEUTICAL EXCIPIENTS MARKET FOR BINDERS, BY COUNTRY, 2023–2030 (USD MILLION)
TABLE 370
ASIA PACIFIC: PHARMACEUTICAL EXCIPIENTS MARKET FOR BINDERS, BY COUNTRY, 2023–2030 (USD MILLION)
TABLE 371
LATIN AMERICA: PHARMACEUTICAL EXCIPIENTS MARKET FOR BINDERS, BY COUNTRY, 2023–2030 (USD MILLION)
TABLE 372
MIDDLE EAST: PHARMACEUTICAL EXCIPIENTS MARKET FOR BINDERS, BY REGION, 2023–2030 (USD MILLION)
TABLE 373
PHARMACEUTICAL EXCIPIENTS MARKET FOR FLAVORING AGENTS & SWEETENERS, BY REGION, 2023–2030 (USD MILLION)
TABLE 374
NORTH AMERICA: PHARMACEUTICAL EXCIPIENTS MARKET FOR FLAVORING AGENTS & SWEETENERS, BY COUNTRY, 2023–2030 (USD MILLION)
TABLE 375
EUROPE: PHARMACEUTICAL EXCIPIENTS MARKET FOR FLAVORING AGENTS & SWEETENERS, BY COUNTRY, 2023–2030 (USD MILLION)
TABLE 376
ASIA PACIFIC: PHARMACEUTICAL EXCIPIENTS MARKET FOR FLAVORING AGENTS & SWEETENERS, BY COUNTRY, 2023–2030 (USD MILLION)
TABLE 377
LATIN AMERICA: PHARMACEUTICAL EXCIPIENTS MARKET FOR FLAVORING AGENTS & SWEETENERS, BY COUNTRY, 2023–2030 (USD MILLION)
TABLE 378
MIDDLE EAST: PHARMACEUTICAL EXCIPIENTS MARKET FOR FLAVORING AGENTS & SWEETENERS, BY REGION, 2023–2030 (USD MILLION)
TABLE 379
PHARMACEUTICAL EXCIPIENTS MARKET FOR DISINTEGRANTS, BY REGION, 2023–2030 (USD MILLION)
TABLE 380
NORTH AMERICA: PHARMACEUTICAL EXCIPIENTS MARKET FOR DISINTEGRANTS, BY COUNTRY, 2023–2030 (USD MILLION)
TABLE 381
EUROPE: PHARMACEUTICAL EXCIPIENTS MARKET FOR DISINTEGRANTS, BY COUNTRY, 2023–2030 (USD MILLION)
TABLE 382
ASIA PACIFIC: PHARMACEUTICAL EXCIPIENTS MARKET FOR DISINTEGRANTS, BY COUNTRY, 2023–2030 (USD MILLION)
TABLE 383
LATIN AMERICA: PHARMACEUTICAL EXCIPIENTS MARKET FOR DISINTEGRANTS, BY COUNTRY, 2023–2030 (USD MILLION)
TABLE 384
MIDDLE EAST: PHARMACEUTICAL EXCIPIENTS MARKET FOR DISINTEGRANTS, BY REGION, 2023–2030 (USD MILLION)
TABLE 385
PHARMACEUTICAL EXCIPIENTS MARKET FOR COLORANTS, BY REGION, 2023–2030 (USD MILLION)
TABLE 386
NORTH AMERICA: PHARMACEUTICAL EXCIPIENTS MARKET FOR COLORANTS, BY COUNTRY, 2023–2030 (USD MILLION)
TABLE 387
EUROPE: PHARMACEUTICAL EXCIPIENTS MARKET FOR COLORANTS, BY COUNTRY, 2023–2030 (USD MILLION)
TABLE 388
ASIA PACIFIC: PHARMACEUTICAL EXCIPIENTS MARKET FOR COLORANTS, BY COUNTRY, 2023–2030 (USD MILLION)
TABLE 389
LATIN AMERICA: PHARMACEUTICAL EXCIPIENTS MARKET FOR COLORANTS, BY COUNTRY, 2023–2030 (USD MILLION)
TABLE 390
MIDDLE EAST: PHARMACEUTICAL EXCIPIENTS MARKET FOR COLORANTS, BY REGION, 2023–2030 (USD MILLION)
TABLE 391
PHARMACEUTICAL EXCIPIENTS MARKET FOR LUBRICANTS & GLIDANTS, BY REGION, 2023–2030 (USD MILLION)
TABLE 392
NORTH AMERICA: PHARMACEUTICAL EXCIPIENTS MARKET FOR LUBRICANTS & GLIDANTS, BY COUNTRY, 2023–2030 (USD MILLION)
TABLE 393
EUROPE: PHARMACEUTICAL EXCIPIENTS MARKET FOR LUBRICANTS & GLIDANTS, BY COUNTRY, 2023–2030 (USD MILLION)
TABLE 394
ASIA PACIFIC: PHARMACEUTICAL EXCIPIENTS MARKET FOR LUBRICANTS & GLIDANTS, BY COUNTRY, 2023–2030 (USD MILLION)
TABLE 395
LATIN AMERICA: PHARMACEUTICAL EXCIPIENTS MARKET FOR LUBRICANTS & GLIDANTS, BY COUNTRY, 2023–2030 (USD MILLION)
TABLE 396
MIDDLE EAST: PHARMACEUTICAL EXCIPIENTS MARKET FOR LUBRICANTS & GLIDANTS, BY REGION, 2023–2030 (USD MILLION)
TABLE 397
PHARMACEUTICAL EXCIPIENTS MARKET FOR PRESERVATIVES, BY REGION, 2023–2030 (USD MILLION)
TABLE 398
NORTH AMERICA: PHARMACEUTICAL EXCIPIENTS MARKET FOR PRESERVATIVES, BY COUNTRY, 2023–2030 (USD MILLION)
TABLE 399
EUROPE: PHARMACEUTICAL EXCIPIENTS MARKET FOR PRESERVATIVES, BY COUNTRY, 2023–2030 (USD MILLION)
TABLE 400
ASIA PACIFIC: PHARMACEUTICAL EXCIPIENTS MARKET FOR PRESERVATIVES, BY COUNTRY, 2023–2030 (USD MILLION)
TABLE 401
LATIN AMERICA: PHARMACEUTICAL EXCIPIENTS MARKET FOR PRESERVATIVES, BY COUNTRY, 2023–2030 (USD MILLION)
TABLE 402
MIDDLE EAST: PHARMACEUTICAL EXCIPIENTS MARKET FOR PRESERVATIVES, BY REGION, 2023–2030 (USD MILLION)
TABLE 403
PHARMACEUTICAL EXCIPIENTS MARKET FOR EMULSIFYING AGENTS, BY REGION, 2023–2030 (USD MILLION)
TABLE 404
NORTH AMERICA: PHARMACEUTICAL EXCIPIENTS MARKET FOR EMULSIFYING AGENTS, BY COUNTRY, 2023–2030 (USD MILLION)
TABLE 405
EUROPE: PHARMACEUTICAL EXCIPIENTS MARKET FOR EMULSIFYING AGENTS, BY COUNTRY, 2023–2030 (USD MILLION)
TABLE 406
ASIA PACIFIC: PHARMACEUTICAL EXCIPIENTS MARKET FOR EMULSIFYING AGENTS, BY COUNTRY, 2023–2030 (USD MILLION)
TABLE 407
LATIN AMERICA: PHARMACEUTICAL EXCIPIENTS MARKET FOR EMULSIFYING AGENTS, BY COUNTRY, 2023–2030 (USD MILLION)
TABLE 408
MIDDLE EAST: PHARMACEUTICAL EXCIPIENTS MARKET FOR EMULSIFYING AGENTS, BY REGION, 2023–2030 (USD MILLION)
TABLE 409
PHARMACEUTICAL EXCIPIENTS MARKET FOR OTHER FUNCTIONALITIES, BY REGION, 2023–2030 (USD MILLION)
TABLE 410
NORTH AMERICA: PHARMACEUTICAL EXCIPIENTS MARKET FOR OTHER FUNCTIONALITIES, BY COUNTRY, 2023–2030 (USD MILLION)
TABLE 411
EUROPE: PHARMACEUTICAL EXCIPIENTS MARKET FOR OTHER FUNCTIONALITIES, BY COUNTRY, 2023–2030 (USD MILLION)
TABLE 412
ASIA PACIFIC: PHARMACEUTICAL EXCIPIENTS MARKET FOR OTHER FUNCTIONALITIES, BY COUNTRY, 2023–2030 (USD MILLION)
TABLE 413
LATIN AMERICA: PHARMACEUTICAL EXCIPIENTS MARKET FOR OTHER FUNCTIONALITIES, BY COUNTRY, 2023–2030 (USD MILLION)
TABLE 414
MIDDLE EAST: PHARMACEUTICAL EXCIPIENTS MARKET FOR OTHER FUNCTIONALITIES, BY REGION, 2023–2030 (USD MILLION)
TABLE 415
PHARMACEUTICAL EXCIPIENTS MARKET, BY FORMULATION, 2023–2030 (USD MILLION)
TABLE 416
PHARMACEUTICAL EXCIPIENTS MARKET FOR ORAL FORMULATIONS, BY TYPE, 2023–2030 (USD MILLION)
TABLE 417
PHARMACEUTICAL EXCIPIENTS MARKET FOR ORAL FORMULATIONS, BY REGION, 2023–2030 (USD MILLION)
TABLE 418
NORTH AMERICA: PHARMACEUTICAL EXCIPIENTS MARKET FOR ORAL FORMULATIONS, BY COUNTRY, 2023–2030 (USD MILLION)
TABLE 419
EUROPE: PHARMACEUTICAL EXCIPIENTS MARKET FOR ORAL FORMULATIONS, BY COUNTRY, 2023–2030 (USD MILLION)
TABLE 420
ASIA PACIFIC: PHARMACEUTICAL EXCIPIENTS MARKET FOR ORAL FORMULATIONS, BY COUNTRY, 2023–2030 (USD MILLION)
TABLE 421
LATIN AMERICA: PHARMACEUTICAL EXCIPIENTS MARKET FOR ORAL FORMULATIONS, BY COUNTRY, 2023–2030 (USD MILLION)
TABLE 422
MIDDLE EAST: PHARMACEUTICAL EXCIPIENTS MARKET FOR ORAL FORMULATIONS, BY REGION, 2023–2030 (USD MILLION)
TABLE 423
TYPICAL COMPOSITION OF TABLETS
TABLE 424
PHARMACEUTICAL EXCIPIENTS MARKET FOR TABLETS, BY REGION, 2023–2030 (USD MILLION)
TABLE 425
NORTH AMERICA: PHARMACEUTICAL EXCIPIENTS MARKET FOR TABLETS, BY COUNTRY, 2023–2030 (USD MILLION)
TABLE 426
EUROPE: PHARMACEUTICAL EXCIPIENTS MARKET FOR TABLETS, BY COUNTRY, 2023–2030 (USD MILLION)
TABLE 427
ASIA PACIFIC: PHARMACEUTICAL EXCIPIENTS MARKET FOR TABLETS, BY COUNTRY, 2023–2030 (USD MILLION)
TABLE 428
LATIN AMERICA: PHARMACEUTICAL EXCIPIENTS MARKET FOR TABLETS, BY COUNTRY, 2023–2030 (USD MILLION)
TABLE 429
MIDDLE EAST: PHARMACEUTICAL EXCIPIENTS MARKET FOR TABLETS, BY REGION, 2023–2030 (USD MILLION)
TABLE 430
PHARMACEUTICAL EXCIPIENTS MARKET FOR CAPSULES, BY TYPE, 2023–2030 (USD MILLION)
TABLE 431
PHARMACEUTICAL EXCIPIENTS MARKET FOR CAPSULES, BY REGION, 2023–2030 (USD MILLION)
TABLE 432
NORTH AMERICA: PHARMACEUTICAL EXCIPIENTS MARKET FOR CAPSULES, BY COUNTRY, 2023–2030 (USD MILLION)
TABLE 433
EUROPE: PHARMACEUTICAL EXCIPIENTS MARKET FOR CAPSULES, BY COUNTRY, 2023–2030 (USD MILLION)
TABLE 434
ASIA PACIFIC: PHARMACEUTICAL EXCIPIENTS MARKET FOR CAPSULES, BY COUNTRY, 2023–2030 (USD MILLION)
TABLE 435
LATIN AMERICA: PHARMACEUTICAL EXCIPIENTS MARKET FOR CAPSULES, BY COUNTRY, 2023–2030 (USD MILLION)
TABLE 436
MIDDLE EAST: PHARMACEUTICAL EXCIPIENTS MARKET FOR CAPSULES, BY REGION, 2023–2030 (USD MILLION)
TABLE 437
PHARMACEUTICAL EXCIPIENTS MARKET FOR HARD-GELATIN CAPSULES, BY REGION, 2023–2030 (USD MILLION)
TABLE 438
NORTH AMERICA: PHARMACEUTICAL EXCIPIENTS MARKET FOR HARD-GELATIN CAPSULES, BY COUNTRY, 2023–2030 (USD MILLION)
TABLE 439
EUROPE: PHARMACEUTICAL EXCIPIENTS MARKET FOR HARD-GELATIN CAPSULES, BY COUNTRY, 2023–2030 (USD MILLION)
TABLE 440
ASIA PACIFIC: PHARMACEUTICAL EXCIPIENTS MARKET FOR HARD-GELATIN CAPSULES, BY COUNTRY, 2023–2030 (USD MILLION)
TABLE 441
LATIN AMERICA: PHARMACEUTICAL EXCIPIENTS MARKET FOR HARD-GELATIN CAPSULES, BY COUNTRY, 2023–2030 (USD MILLION)
TABLE 442
MIDDLE EAST: PHARMACEUTICAL EXCIPIENTS MARKET FOR HARD-GELATIN CAPSULES, BY REGION, 2023–2030 (USD MILLION)
TABLE 443
PHARMACEUTICAL EXCIPIENTS MARKET FOR SOFT-GELATIN CAPSULES, BY REGION, 2023–2030 (USD MILLION)
TABLE 444
NORTH AMERICA: PHARMACEUTICAL EXCIPIENTS MARKET FOR SOFT-GELATIN CAPSULES, BY COUNTRY, 2023–2030 (USD MILLION)
TABLE 445
EUROPE: PHARMACEUTICAL EXCIPIENTS MARKET FOR SOFT-GELATIN CAPSULES, BY COUNTRY, 2023–2030 (USD MILLION)
TABLE 446
ASIA PACIFIC: PHARMACEUTICAL EXCIPIENTS MARKET FOR SOFT-GELATIN CAPSULES, BY COUNTRY, 2023–2030 (USD MILLION)
TABLE 447
LATIN AMERICA: PHARMACEUTICAL EXCIPIENTS MARKET FOR SOFT-GELATIN CAPSULES, BY COUNTRY, 2023–2030 (USD MILLION)
TABLE 448
MIDDLE EAST: PHARMACEUTICAL EXCIPIENTS MARKET FOR SOFT-GELATIN CAPSULES, BY REGION, 2023–2030 (USD MILLION)
TABLE 449
PHARMACEUTICAL EXCIPIENTS MARKET FOR LIQUID FORMULATIONS, BY REGION, 2023–2030 (USD MILLION)
TABLE 450
NORTH AMERICA: PHARMACEUTICAL EXCIPIENTS MARKET FOR LIQUID FORMULATIONS, BY COUNTRY, 2023–2030 (USD MILLION)
TABLE 451
EUROPE: PHARMACEUTICAL EXCIPIENTS MARKET FOR LIQUID FORMULATIONS, BY COUNTRY, 2023–2030 (USD MILLION)
TABLE 452
ASIA PACIFIC: PHARMACEUTICAL EXCIPIENTS MARKET FOR LIQUID FORMULATIONS, BY COUNTRY, 2023–2030 (USD MILLION)
TABLE 453
LATIN AMERICA: PHARMACEUTICAL EXCIPIENTS MARKET FOR LIQUID FORMULATIONS, BY COUNTRY, 2023–2030 (USD MILLION)
TABLE 454
MIDDLE EAST: PHARMACEUTICAL EXCIPIENTS MARKET FOR LIQUID FORMULATIONS, BY REGION, 2023–2030 (USD MILLION)
TABLE 455
PHARMACEUTICAL EXCIPIENTS MARKET FOR OTHER ORAL FORMULATIONS, BY REGION, 2023–2030 (USD MILLION)
TABLE 456
NORTH AMERICA: PHARMACEUTICAL EXCIPIENTS MARKET FOR OTHER ORAL FORMULATIONS, BY COUNTRY, 2023–2030 (USD MILLION)
TABLE 457
EUROPE: PHARMACEUTICAL EXCIPIENTS MARKET FOR OTHER ORAL FORMULATIONS, BY COUNTRY, 2023–2030 (USD MILLION)
TABLE 458
ASIA PACIFIC: PHARMACEUTICAL EXCIPIENTS MARKET FOR OTHER ORAL FORMULATIONS, BY COUNTRY, 2023–2030 (USD MILLION)
TABLE 459
LATIN AMERICA: PHARMACEUTICAL EXCIPIENTS MARKET FOR OTHER ORAL FORMULATIONS, BY COUNTRY, 2023–2030 (USD MILLION)
TABLE 460
MIDDLE EAST: PHARMACEUTICAL EXCIPIENTS MARKET FOR OTHER ORAL FORMULATIONS, BY REGION, 2023–2030 (USD MILLION)
TABLE 461
PHARMACEUTICAL EXCIPIENTS MARKET FOR TOPICAL FORMULATIONS, BY REGION, 2023–2030 (USD MILLION)
TABLE 462
NORTH AMERICA: PHARMACEUTICAL EXCIPIENTS MARKET FOR TOPICAL FORMULATIONS, BY COUNTRY, 2023–2030 (USD MILLION)
TABLE 463
EUROPE: PHARMACEUTICAL EXCIPIENTS MARKET FOR TOPICAL FORMULATIONS, BY COUNTRY, 2023–2030 (USD MILLION)
TABLE 464
ASIA PACIFIC: PHARMACEUTICAL EXCIPIENTS MARKET FOR TOPICAL FORMULATIONS, BY COUNTRY, 2023–2030 (USD MILLION)
TABLE 465
LATIN AMERICA: PHARMACEUTICAL EXCIPIENTS MARKET FOR TOPICAL FORMULATIONS, BY COUNTRY, 2023–2030 (USD MILLION)
TABLE 466
MIDDLE EAST: PHARMACEUTICAL EXCIPIENTS MARKET FOR TOPICAL FORMULATIONS, BY REGION, 2023–2030 (USD MILLION)
TABLE 467
TYPICAL COMPOSITION OF PARENTERAL FORMULATIONS
TABLE 468
EXCIPIENTS USED IN PARENTERAL FORMULATIONS
TABLE 469
PHARMACEUTICAL EXCIPIENTS MARKET FOR PARENTERAL FORMULATIONS, BY REGION, 2023–2030 (USD MILLION)
TABLE 470
NORTH AMERICA: PHARMACEUTICAL EXCIPIENTS MARKET FOR PARENTERAL FORMULATIONS, BY COUNTRY, 2023–2030 (USD MILLION)
TABLE 471
EUROPE: PHARMACEUTICAL EXCIPIENTS MARKET FOR PARENTERAL FORMULATIONS, BY COUNTRY, 2023–2030 (USD MILLION)
TABLE 472
ASIA PACIFIC: PHARMACEUTICAL EXCIPIENTS MARKET FOR PARENTERAL FORMULATIONS, BY COUNTRY, 2023–2030 (USD MILLION)
TABLE 473
LATIN AMERICA: PHARMACEUTICAL EXCIPIENTS MARKET FOR PARENTERAL FORMULATIONS, BY COUNTRY, 2023–2030 (USD MILLION)
TABLE 474
MIDDLE EAST: PHARMACEUTICAL EXCIPIENTS MARKET FOR PARENTERAL FORMULATIONS, BY REGION, 2023–2030 (USD MILLION)
TABLE 475
PHARMACEUTICAL EXCIPIENTS MARKET FOR OTHER FORMULATIONS, BY REGION, 2023–2030 (USD MILLION)
TABLE 476
NORTH AMERICA: PHARMACEUTICAL EXCIPIENTS MARKET FOR OTHER FORMULATIONS, BY COUNTRY, 2023–2030 (USD MILLION)
TABLE 477
EUROPE: PHARMACEUTICAL EXCIPIENTS MARKET FOR OTHER FORMULATIONS, BY COUNTRY, 2023–2030 (USD MILLION)
TABLE 478
ASIA PACIFIC: PHARMACEUTICAL EXCIPIENTS MARKET FOR OTHER FORMULATIONS, BY COUNTRY, 2023–2030 (USD MILLION)
TABLE 479
LATIN AMERICA: PHARMACEUTICAL EXCIPIENTS MARKET FOR OTHER FORMULATIONS, BY COUNTRY, 2023–2030 (USD MILLION)
TABLE 480
MIDDLE EAST: PHARMACEUTICAL EXCIPIENTS MARKET FOR OTHER FORMULATIONS, BY REGION, 2023–2030 (USD MILLION)
TABLE 481
PHARMACEUTICAL EXCIPIENTS MARKET, BY FUNCTIONALITY APPLICATION, 2023–2030 (USD MILLION)
TABLE 482
PHARMACEUTICAL EXCIPIENTS MARKET FOR STABILIZERS, BY REGION, 2023–2030 (USD MILLION)
TABLE 483
NORTH AMERICA: PHARMACEUTICAL EXCIPIENTS MARKET FOR STABILIZERS, BY COUNTRY, 2023–2030 (USD MILLION)
TABLE 484
EUROPE: PHARMACEUTICAL EXCIPIENTS MARKET FOR STABILIZERS, BY COUNTRY, 2023–2030 (USD MILLION)
TABLE 485
ASIA PACIFIC: PHARMACEUTICAL EXCIPIENTS MARKET FOR STABILIZERS, BY COUNTRY, 2023–2030 (USD MILLION)
TABLE 486
LATIN AMERICA: PHARMACEUTICAL EXCIPIENTS MARKET FOR STABILIZERS, BY COUNTRY, 2023–2030 (USD MILLION)
TABLE 487
MIDDLE EAST: PHARMACEUTICAL EXCIPIENTS MARKET FOR STABILIZERS, BY REGION, 2023–2030 (USD MILLION)
TABLE 488
PHARMACEUTICAL EXCIPIENTS MARKET FOR TASTE MASKING, BY REGION, 2023–2030 (USD MILLION)
TABLE 489
NORTH AMERICA: PHARMACEUTICAL EXCIPIENTS MARKET FOR TASTE MASKING, BY COUNTRY, 2023–2030 (USD MILLION)
TABLE 490
EUROPE: PHARMACEUTICAL EXCIPIENTS MARKET FOR TASTE MASKING, BY COUNTRY, 2023–2030 (USD MILLION)
TABLE 491
ASIA PACIFIC: PHARMACEUTICAL EXCIPIENTS MARKET FOR TASTE MASKING, BY COUNTRY, 2023–2030 (USD MILLION)
TABLE 492
LATIN AMERICA: PHARMACEUTICAL EXCIPIENTS MARKET FOR TASTE MASKING, BY COUNTRY, 2023–2030 (USD MILLION)
TABLE 493
MIDDLE EAST: PHARMACEUTICAL EXCIPIENTS MARKET FOR TASTE MASKING, BY REGION, 2023–2030 (USD MILLION)
TABLE 494
PHARMACEUTICAL EXCIPIENTS MARKET FOR MODIFIED-RELEASE, BY REGION, 2023–2030 (USD MILLION)
TABLE 495
NORTH AMERICA: PHARMACEUTICAL EXCIPIENTS MARKET FOR MODIFIED-RELEASE, BY COUNTRY, 2023–2030 (USD MILLION)
TABLE 496
EUROPE: PHARMACEUTICAL EXCIPIENTS MARKET FOR MODIFIED-RELEASE, BY COUNTRY, 2023–2030 (USD MILLION)
TABLE 497
ASIA PACIFIC: PHARMACEUTICAL EXCIPIENTS MARKET FOR MODIFIED-RELEASE, BY COUNTRY, 2023–2030 (USD MILLION)
TABLE 498
LATIN AMERICA: PHARMACEUTICAL EXCIPIENTS MARKET FOR MODIFIED-RELEASE, BY COUNTRY, 2023–2030 (USD MILLION)
TABLE 499
MIDDLE EAST: PHARMACEUTICAL EXCIPIENTS MARKET FOR MODIFIED-RELEASE, BY REGION, 2023–2030 (USD MILLION)
TABLE 500
PHARMACEUTICAL EXCIPIENTS MARKET FOR SOLUBILITY & BIOAVAILABILITY, BY REGION, 2023–2030 (USD MILLION)
TABLE 501
NORTH AMERICA: PHARMACEUTICAL EXCIPIENTS MARKET FOR SOLUBILITY & BIOAVAILABILITY, BY COUNTRY, 2023–2030 (USD MILLION)
TABLE 502
EUROPE: PHARMACEUTICAL EXCIPIENTS MARKET FOR SOLUBILITY & BIOAVAILABILITY, BY COUNTRY, 2023–2030 (USD MILLION)
TABLE 503
ASIA PACIFIC: PHARMACEUTICAL EXCIPIENTS MARKET FOR SOLUBILITY & BIOAVAILABILITY, BY COUNTRY, 2023–2030 (USD MILLION)
TABLE 504
LATIN AMERICA: PHARMACEUTICAL EXCIPIENTS MARKET FOR SOLUBILITY & BIOAVAILABILITY, BY COUNTRY, 2023–2030 (USD MILLION)
TABLE 505
MIDDLE EAST: PHARMACEUTICAL EXCIPIENTS MARKET FOR SOLUBILITY & BIOAVAILABILITY, BY REGION, 2023–2030 (USD MILLION)
TABLE 506
PHARMACEUTICAL EXCIPIENTS MARKET FOR OTHER APPLICATIONS, BY REGION, 2023–2030 (USD MILLION)
TABLE 507
NORTH AMERICA: PHARMACEUTICAL EXCIPIENTS MARKET FOR OTHER APPLICATIONS, BY COUNTRY, 2023–2030 (USD MILLION)
TABLE 508
EUROPE: PHARMACEUTICAL EXCIPIENTS MARKET FOR OTHER APPLICATIONS, BY COUNTRY, 2023–2030 (USD MILLION)
TABLE 509
ASIA PACIFIC: PHARMACEUTICAL EXCIPIENTS MARKET FOR OTHER APPLICATIONS, BY COUNTRY, 2023–2030 (USD MILLION)
TABLE 510
LATIN AMERICA: PHARMACEUTICAL EXCIPIENTS MARKET FOR OTHER APPLICATIONS, BY COUNTRY, 2023–2030 (USD MILLION)
TABLE 511
MIDDLE EAST: PHARMACEUTICAL EXCIPIENTS MARKET FOR OTHER APPLICATIONS, BY REGION, 2023–2030 (USD MILLION)
TABLE 512
PHARMACEUTICAL EXCIPIENTS MARKET, BY REGION, 2023–2030 (USD MILLION)
TABLE 513
EUROPE: KEY MACROECONOMIC INDICATORS
TABLE 514
EUROPE: PHARMACEUTICAL EXCIPIENTS MARKET, BY COUNTRY, 2023–2030 (USD MILLION)
TABLE 515
EUROPE: PHARMACEUTICAL EXCIPIENTS MARKET, BY PRODUCT, 2023–2030 (USD MILLION)
TABLE 516
EUROPE: PHARMACEUTICAL EXCIPIENTS MARKET FOR ORGANIC CHEMICALS, BY TYPE, 2023–2030 (USD MILLION)
TABLE 517
EUROPE: PHARMACEUTICAL EXCIPIENTS MARKET FOR OLEOCHEMICALS, BY TYPE, 2023–2030 (USD MILLION)
TABLE 518
EUROPE: PHARMACEUTICAL EXCIPIENTS MARKET FOR CARBOHYDRATES, BY TYPE, 2023–2030 (USD MILLION)
TABLE 519
EUROPE: PHARMACEUTICAL EXCIPIENTS MARKET FOR SUGARS, BY TYPE, 2023–2030 (USD MILLION)
TABLE 520
EUROPE: PHARMACEUTICAL EXCIPIENTS MARKET FOR ACTUAL SUGARS, BY TYPE, 2023–2030 (USD MILLION)
TABLE 521
EUROPE: PHARMACEUTICAL EXCIPIENTS MARKET FOR SUGAR ALCOHOLS, BY TYPE, 2023–2030 (USD MILLION)
TABLE 522
EUROPE: PHARMACEUTICAL EXCIPIENTS MARKET FOR CELLULOSE, BY TYPE, 2023–2030 (USD MILLION)
TABLE 523
EUROPE: PHARMACEUTICAL EXCIPIENTS MARKET FOR STARCH, BY TYPE, 2023–2030 (USD MILLION)
TABLE 524
EUROPE: PHARMACEUTICAL EXCIPIENTS MARKET FOR PETROCHEMICALS, BY TYPE, 2023–2030 (USD MILLION)
TABLE 525
EUROPE: PHARMACEUTICAL EXCIPIENTS MARKET FOR GLYCOLS, BY TYPE, 2023–2030 (USD MILLION)
TABLE 526
EUROPE: PHARMACEUTICAL EXCIPIENTS MARKET FOR MINERAL HYDROCARBONS, BY TYPE, 2023–2030 (USD MILLION)
TABLE 527
EUROPE: PHARMACEUTICAL EXCIPIENTS MARKET FOR INORGANIC CHEMICALS, BY TYPE, 2023–2030 (USD MILLION)
TABLE 528
EUROPE: PHARMACEUTICAL EXCIPIENTS MARKET, BY FUNCTIONALITY, 2023–2030 (USD MILLION)
TABLE 529
EUROPE: PHARMACEUTICAL EXCIPIENTS MARKET, BY FORMULATION, 2023–2030 (USD MILLION)
TABLE 530
EUROPE: PHARMACEUTICAL EXCIPIENTS MARKET FOR ORAL FORMULATIONS, BY TYPE, 2023–2030 (USD MILLION)
TABLE 531
EUROPE: PHARMACEUTICAL EXCIPIENTS MARKET FOR CAPSULES, BY TYPE, 2023–2030 (USD MILLION)
TABLE 532
EUROPE: PHARMACEUTICAL EXCIPIENTS MARKET, BY FUNCTIONALITY APPLICATION, 2023–2030 (USD MILLION)
TABLE 533
GERMANY: PHARMACEUTICAL EXCIPIENTS MARKET, BY PRODUCT, 2023–2030 (USD MILLION)
TABLE 534
GERMANY: PHARMACEUTICAL EXCIPIENTS MARKET FOR ORGANIC CHEMICALS, BY TYPE, 2023–2030 (USD MILLION)
TABLE 535
GERMANY: PHARMACEUTICAL EXCIPIENTS MARKET FOR OLEOCHEMICALS, BY TYPE, 2023–2030 (USD MILLION)
TABLE 536
GERMANY: PHARMACEUTICAL EXCIPIENTS MARKET FOR CARBOHYDRATES, BY TYPE, 2023–2030 (USD MILLION)
TABLE 537
GERMANY: PHARMACEUTICAL EXCIPIENTS MARKET FOR SUGARS, BY TYPE, 2023–2030 (USD MILLION)
TABLE 538
GERMANY: PHARMACEUTICAL EXCIPIENTS MARKET FOR ACTUAL SUGARS, BY TYPE, 2023–2030 (USD MILLION)
TABLE 539
GERMANY: PHARMACEUTICAL EXCIPIENTS MARKET FOR SUGAR ALCOHOLS, BY TYPE, 2023–2030 (USD MILLION)
TABLE 540
GERMANY: PHARMACEUTICAL EXCIPIENTS MARKET FOR CELLULOSE, BY TYPE, 2023–2030 (USD MILLION)
TABLE 541
GERMANY: PHARMACEUTICAL EXCIPIENTS MARKET FOR STARCH, BY TYPE, 2023–2030 (USD MILLION)
TABLE 542
GERMANY: PHARMACEUTICAL EXCIPIENTS MARKET FOR PETROCHEMICALS, BY TYPE, 2023–2030 (USD MILLION)
TABLE 543
GERMANY: PHARMACEUTICAL EXCIPIENTS MARKET FOR GLYCOLS, BY TYPE, 2023–2030 (USD MILLION)
TABLE 544
GERMANY: PHARMACEUTICAL EXCIPIENTS MARKET FOR MINERAL HYDROCARBONS, BY TYPE, 2023–2030 (USD MILLION)
TABLE 545
GERMANY: PHARMACEUTICAL EXCIPIENTS MARKET FOR INORGANIC CHEMICALS, BY TYPE, 2023–2030 (USD MILLION)
TABLE 546
GERMANY: PHARMACEUTICAL EXCIPIENTS MARKET, BY FUNCTIONALITY, 2023–2030 (USD MILLION)
TABLE 547
GERMANY: PHARMACEUTICAL EXCIPIENTS MARKET, BY FORMULATION, 2023–2030 (USD MILLION)
TABLE 548
GERMANY: PHARMACEUTICAL EXCIPIENTS MARKET FOR ORAL FORMULATIONS, BY TYPE, 2023–2030 (USD MILLION)
TABLE 549
GERMANY: PHARMACEUTICAL EXCIPIENTS MARKET FOR CAPSULES, BY TYPE, 2023–2030 (USD MILLION)
TABLE 550
GERMANY: PHARMACEUTICAL EXCIPIENTS MARKET, BY FUNCTIONALITY APPLICATION, 2023–2030 (USD MILLION)
TABLE 551
UK: PHARMACEUTICAL EXCIPIENTS MARKET, BY PRODUCT, 2023–2030 (USD MILLION)
TABLE 552
UK: PHARMACEUTICAL EXCIPIENTS MARKET FOR ORGANIC CHEMICALS, BY TYPE, 2023–2030 (USD MILLION)
TABLE 553
UK: PHARMACEUTICAL EXCIPIENTS MARKET FOR OLEOCHEMICALS, BY TYPE, 2023–2030 (USD MILLION)
TABLE 554
UK: PHARMACEUTICAL EXCIPIENTS MARKET FOR CARBOHYDRATES, BY TYPE, 2023–2030 (USD MILLION)
TABLE 555
UK: PHARMACEUTICAL EXCIPIENTS MARKET FOR SUGARS, BY TYPE, 2023–2030 (USD MILLION)
TABLE 556
UK: PHARMACEUTICAL EXCIPIENTS MARKET FOR ACTUAL SUGARS, BY TYPE, 2023–2030 (USD MILLION)
TABLE 557
UK: PHARMACEUTICAL EXCIPIENTS MARKET FOR SUGAR ALCOHOLS, BY TYPE, 2023–2030 (USD MILLION)
TABLE 558
UK: PHARMACEUTICAL EXCIPIENTS MARKET FOR CELLULOSE, BY TYPE, 2023–2030 (USD MILLION)
TABLE 559
UK: PHARMACEUTICAL EXCIPIENTS MARKET FOR STARCH, BY TYPE, 2023–2030 (USD MILLION)
TABLE 560
UK: PHARMACEUTICAL EXCIPIENTS MARKET FOR PETROCHEMICALS, BY TYPE, 2023–2030 (USD MILLION)
TABLE 561
UK: PHARMACEUTICAL EXCIPIENTS MARKET FOR GLYCOLS, BY TYPE, 2023–2030 (USD MILLION)
TABLE 562
UK: PHARMACEUTICAL EXCIPIENTS MARKET FOR MINERAL HYDROCARBONS, BY TYPE, 2023–2030 (USD MILLION)
TABLE 563
UK: PHARMACEUTICAL EXCIPIENTS MARKET FOR INORGANIC CHEMICALS, BY TYPE, 2023–2030 (USD MILLION)
TABLE 564
UK: PHARMACEUTICAL EXCIPIENTS MARKET, BY FUNCTIONALITY, 2023–2030 (USD MILLION)
TABLE 565
UK: PHARMACEUTICAL EXCIPIENTS MARKET, BY FORMULATION, 2023–2030 (USD MILLION)
TABLE 566
UK: PHARMACEUTICAL EXCIPIENTS MARKET FOR ORAL FORMULATIONS, BY TYPE, 2023–2030 (USD MILLION)
TABLE 567
UK: PHARMACEUTICAL EXCIPIENTS MARKET FOR CAPSULES, BY TYPE, 2023–2030 (USD MILLION)
TABLE 568
UK: PHARMACEUTICAL EXCIPIENTS MARKET, BY FUNCTIONALITY APPLICATION, 2023–2030 (USD MILLION)
TABLE 569
FRANCE: PHARMACEUTICAL EXCIPIENTS MARKET, BY PRODUCT, 2023–2030 (USD MILLION)
TABLE 570
FRANCE: PHARMACEUTICAL EXCIPIENTS MARKET FOR ORGANIC CHEMICALS, BY TYPE, 2023–2030 (USD MILLION)
TABLE 571
FRANCE: PHARMACEUTICAL EXCIPIENTS MARKET FOR OLEOCHEMICALS, BY TYPE, 2023–2030 (USD MILLION)
TABLE 572
FRANCE: PHARMACEUTICAL EXCIPIENTS MARKET FOR CARBOHYDRATES, BY TYPE, 2023–2030 (USD MILLION)
TABLE 573
FRANCE: PHARMACEUTICAL EXCIPIENTS MARKET FOR SUGARS, BY TYPE, 2023–2030 (USD MILLION)
TABLE 574
FRANCE: PHARMACEUTICAL EXCIPIENTS MARKET FOR ACTUAL SUGARS, BY TYPE, 2023–2030 (USD MILLION)
TABLE 575
FRANCE: PHARMACEUTICAL EXCIPIENTS MARKET FOR SUGAR ALCOHOLS, BY TYPE, 2023–2030 (USD MILLION)
TABLE 576
FRANCE: PHARMACEUTICAL EXCIPIENTS MARKET FOR CELLULOSE, BY TYPE, 2023–2030 (USD MILLION)
TABLE 577
FRANCE: PHARMACEUTICAL EXCIPIENTS MARKET FOR STARCH, BY TYPE, 2023–2030 (USD MILLION)
TABLE 578
FRANCE: PHARMACEUTICAL EXCIPIENTS MARKET FOR PETROCHEMICALS, BY TYPE, 2023–2030 (USD MILLION)
TABLE 579
FRANCE: PHARMACEUTICAL EXCIPIENTS MARKET FOR GLYCOLS, BY TYPE, 2023–2030 (USD MILLION)
TABLE 580
FRANCE: PHARMACEUTICAL EXCIPIENTS MARKET FOR MINERAL HYDROCARBONS, BY TYPE, 2023–2030 (USD MILLION)
TABLE 581
FRANCE: PHARMACEUTICAL EXCIPIENTS MARKET FOR INORGANIC CHEMICALS, BY TYPE, 2023–2030 (USD MILLION)
TABLE 582
FRANCE: PHARMACEUTICAL EXCIPIENTS MARKET, BY FUNCTIONALITY, 2023–2030 (USD MILLION)
TABLE 583
FRANCE: PHARMACEUTICAL EXCIPIENTS MARKET, BY FORMULATION, 2023–2030 (USD MILLION)
TABLE 584
FRANCE: PHARMACEUTICAL EXCIPIENTS MARKET FOR ORAL FORMULATIONS, BY TYPE, 2023–2030 (USD MILLION)
TABLE 585
FRANCE: PHARMACEUTICAL EXCIPIENTS MARKET FOR CAPSULES, BY TYPE, 2023–2030 (USD MILLION)
TABLE 586
FRANCE: PHARMACEUTICAL EXCIPIENTS MARKET, BY FUNCTIONALITY APPLICATION, 2023–2030 (USD MILLION)
TABLE 587
ITALY: PHARMACEUTICAL EXCIPIENTS MARKET, BY PRODUCT, 2023–2030 (USD MILLION)
TABLE 588
ITALY: PHARMACEUTICAL EXCIPIENTS MARKET FOR ORGANIC CHEMICALS, BY TYPE, 2023–2030 (USD MILLION)
TABLE 589
ITALY: PHARMACEUTICAL EXCIPIENTS MARKET FOR OLEOCHEMICALS, BY TYPE, 2023–2030 (USD MILLION)
TABLE 590
ITALY: PHARMACEUTICAL EXCIPIENTS MARKET FOR CARBOHYDRATES, BY TYPE, 2023–2030 (USD MILLION)
TABLE 591
ITALY: PHARMACEUTICAL EXCIPIENTS MARKET FOR SUGARS, BY TYPE, 2023–2030 (USD MILLION)
TABLE 592
ITALY: PHARMACEUTICAL EXCIPIENTS MARKET FOR ACTUAL SUGARS, BY TYPE, 2023–2030 (USD MILLION)
TABLE 593
ITALY: PHARMACEUTICAL EXCIPIENTS MARKET FOR SUGAR ALCOHOLS, BY TYPE, 2023–2030 (USD MILLION)
TABLE 594
ITALY: PHARMACEUTICAL EXCIPIENTS MARKET FOR CELLULOSE, BY TYPE, 2023–2030 (USD MILLION)
TABLE 595
ITALY: PHARMACEUTICAL EXCIPIENTS MARKET FOR STARCH, BY TYPE, 2023–2030 (USD MILLION)
TABLE 596
ITALY: PHARMACEUTICAL EXCIPIENTS MARKET FOR PETROCHEMICALS, BY TYPE, 2023–2030 (USD MILLION)
TABLE 597
ITALY: PHARMACEUTICAL EXCIPIENTS MARKET FOR GLYCOLS, BY TYPE, 2023–2030 (USD MILLION)
TABLE 598
ITALY: PHARMACEUTICAL EXCIPIENTS MARKET FOR MINERAL HYDROCARBONS, BY TYPE, 2023–2030 (USD MILLION)
TABLE 599
ITALY: PHARMACEUTICAL EXCIPIENTS MARKET FOR INORGANIC CHEMICALS, BY TYPE, 2023–2030 (USD MILLION)
TABLE 600
ITALY: PHARMACEUTICAL EXCIPIENTS MARKET, BY FUNCTIONALITY, 2023–2030 (USD MILLION)
TABLE 601
ITALY: PHARMACEUTICAL EXCIPIENTS MARKET, BY FORMULATION, 2023–2030 (USD MILLION)
TABLE 602
ITALY: PHARMACEUTICAL EXCIPIENTS MARKET FOR ORAL FORMULATIONS, BY TYPE, 2023–2030 (USD MILLION)
TABLE 603
ITALY: PHARMACEUTICAL EXCIPIENTS MARKET FOR CAPSULES, BY TYPE, 2023–2030 (USD MILLION)
TABLE 604
ITALY: PHARMACEUTICAL EXCIPIENTS MARKET, BY FUNCTIONALITY APPLICATION, 2023–2030 (USD MILLION)
TABLE 605
SPAIN: PHARMACEUTICAL EXCIPIENTS MARKET, BY PRODUCT, 2023–2030 (USD MILLION)
TABLE 606
SPAIN: PHARMACEUTICAL EXCIPIENTS MARKET FOR ORGANIC CHEMICALS, BY TYPE, 2023–2030 (USD MILLION)
TABLE 607
SPAIN: PHARMACEUTICAL EXCIPIENTS MARKET FOR OLEOCHEMICALS, BY TYPE, 2023–2030 (USD MILLION)
TABLE 608
SPAIN: PHARMACEUTICAL EXCIPIENTS MARKET FOR CARBOHYDRATES, BY TYPE, 2023–2030 (USD MILLION)
TABLE 609
SPAIN: PHARMACEUTICAL EXCIPIENTS MARKET FOR SUGARS, BY TYPE, 2023–2030 (USD MILLION)
TABLE 610
SPAIN: PHARMACEUTICAL EXCIPIENTS MARKET FOR ACTUAL SUGARS, BY TYPE, 2023–2030 (USD MILLION)
TABLE 611
SPAIN: PHARMACEUTICAL EXCIPIENTS MARKET FOR SUGAR ALCOHOLS, BY TYPE, 2023–2030 (USD MILLION)
TABLE 612
SPAIN: PHARMACEUTICAL EXCIPIENTS MARKET FOR CELLULOSE, BY TYPE, 2023–2030 (USD MILLION)
TABLE 613
SPAIN: PHARMACEUTICAL EXCIPIENTS MARKET FOR STARCH, BY TYPE, 2023–2030 (USD MILLION)
TABLE 614
SPAIN: PHARMACEUTICAL EXCIPIENTS MARKET FOR PETROCHEMICALS, BY TYPE, 2023–2030 (USD MILLION)
TABLE 615
SPAIN: PHARMACEUTICAL EXCIPIENTS MARKET FOR GLYCOLS, BY TYPE, 2023–2030 (USD MILLION)
TABLE 616
SPAIN: PHARMACEUTICAL EXCIPIENTS MARKET FOR MINERAL HYDROCARBONS, BY TYPE, 2023–2030 (USD MILLION)
TABLE 617
SPAIN: PHARMACEUTICAL EXCIPIENTS MARKET FOR INORGANIC CHEMICALS, BY TYPE, 2023–2030 (USD MILLION)
TABLE 618
SPAIN: PHARMACEUTICAL EXCIPIENTS MARKET, BY FUNCTIONALITY, 2023–2030 (USD MILLION)
TABLE 619
SPAIN: PHARMACEUTICAL EXCIPIENTS MARKET, BY FORMULATION, 2023–2030 (USD MILLION)
TABLE 620
SPAIN: PHARMACEUTICAL EXCIPIENTS MARKET FOR ORAL FORMULATIONS, BY TYPE, 2023–2030 (USD MILLION)
TABLE 621
SPAIN: PHARMACEUTICAL EXCIPIENTS MARKET FOR CAPSULES, BY TYPE, 2023–2030 (USD MILLION)
TABLE 622
SPAIN: PHARMACEUTICAL EXCIPIENTS MARKET, BY FUNCTIONALITY APPLICATION, 2023–2030 (USD MILLION)
TABLE 623
REST OF EUROPE: PHARMACEUTICAL EXCIPIENTS MARKET, BY PRODUCT, 2023–2030 (USD MILLION)
TABLE 624
REST OF EUROPE: PHARMACEUTICAL EXCIPIENTS MARKET FOR ORGANIC CHEMICALS, BY TYPE, 2023–2030 (USD MILLION)
TABLE 625
REST OF EUROPE: PHARMACEUTICAL EXCIPIENTS MARKET FOR OLEOCHEMICALS, BY TYPE, 2023–2030 (USD MILLION)
TABLE 626
REST OF EUROPE: PHARMACEUTICAL EXCIPIENTS MARKET FOR CARBOHYDRATES, BY TYPE, 2023–2030 (USD MILLION)
TABLE 627
REST OF EUROPE: PHARMACEUTICAL EXCIPIENTS MARKET FOR SUGARS, BY TYPE, 2023–2030 (USD MILLION)
TABLE 628
REST OF EUROPE: PHARMACEUTICAL EXCIPIENTS MARKET FOR ACTUAL SUGARS, BY TYPE, 2023–2030 (USD MILLION)
TABLE 629
REST OF EUROPE: PHARMACEUTICAL EXCIPIENTS MARKET FOR SUGAR ALCOHOLS, BY TYPE, 2023–2030 (USD MILLION)
TABLE 630
REST OF EUROPE: PHARMACEUTICAL EXCIPIENTS MARKET FOR CELLULOSE, BY TYPE, 2023–2030 (USD MILLION)
TABLE 631
REST OF EUROPE: PHARMACEUTICAL EXCIPIENTS MARKET FOR STARCH, BY TYPE, 2023–2030 (USD MILLION)
TABLE 632
REST OF EUROPE: PHARMACEUTICAL EXCIPIENTS MARKET FOR PETROCHEMICALS, BY TYPE, 2023–2030 (USD MILLION)
TABLE 633
REST OF EUROPE: PHARMACEUTICAL EXCIPIENTS MARKET FOR GLYCOLS, BY TYPE, 2023–2030 (USD MILLION)
TABLE 634
REST OF EUROPE: PHARMACEUTICAL EXCIPIENTS MARKET FOR MINERAL HYDROCARBONS, BY TYPE, 2023–2030 (USD MILLION)
TABLE 635
REST OF EUROPE: PHARMACEUTICAL EXCIPIENTS MARKET FOR INORGANIC CHEMICALS, BY TYPE, 2023–2030 (USD MILLION)
TABLE 636
REST OF EUROPE: PHARMACEUTICAL EXCIPIENTS MARKET, BY FUNCTIONALITY, 2023–2030 (USD MILLION)
TABLE 637
REST OF EUROPE: PHARMACEUTICAL EXCIPIENTS MARKET, BY FORMULATION, 2023–2030 (USD MILLION)
TABLE 638
REST OF EUROPE: PHARMACEUTICAL EXCIPIENTS MARKET FOR ORAL FORMULATIONS, BY TYPE, 2023–2030 (USD MILLION)
TABLE 639
REST OF EUROPE: PHARMACEUTICAL EXCIPIENTS MARKET FOR CAPSULES, BY TYPE, 2023–2030 (USD MILLION)
TABLE 640
REST OF EUROPE: PHARMACEUTICAL EXCIPIENTS MARKET, BY FUNCTIONALITY APPLICATION, 2023–2030 (USD MILLION)
TABLE 641
NORTH AMERICA: KEY MACROECONOMIC INDICATORS
TABLE 642
NORTH AMERICA: PHARMACEUTICAL EXCIPIENTS MARKET, BY COUNTRY, 2023–2030 (USD MILLION)
TABLE 643
NORTH AMERICA: PHARMACEUTICAL EXCIPIENTS MARKET, BY PRODUCT, 2023–2030 (USD MILLION)
TABLE 644
NORTH AMERICA: PHARMACEUTICAL EXCIPIENTS MARKET FOR ORGANIC CHEMICALS, BY TYPE, 2023–2030 (USD MILLION)
TABLE 645
NORTH AMERICA: PHARMACEUTICAL EXCIPIENTS MARKET FOR OLEOCHEMICALS, BY TYPE, 2023–2030 (USD MILLION)
TABLE 646
NORTH AMERICA: PHARMACEUTICAL EXCIPIENTS MARKET FOR CARBOHYDRATES, BY TYPE, 2023–2030 (USD MILLION)
TABLE 647
NORTH AMERICA: PHARMACEUTICAL EXCIPIENTS MARKET FOR SUGARS, BY TYPE, 2023–2030 (USD MILLION)
TABLE 648
NORTH AMERICA: PHARMACEUTICAL EXCIPIENTS MARKET FOR ACTUAL SUGARS, BY TYPE, 2023–2030 (USD MILLION)
TABLE 649
NORTH AMERICA: PHARMACEUTICAL EXCIPIENTS MARKET FOR SUGAR ALCOHOLS, BY TYPE, 2023–2030 (USD MILLION)
TABLE 650
NORTH AMERICA: PHARMACEUTICAL EXCIPIENTS MARKET FOR CELLULOSE, BY TYPE, 2023–2030 (USD MILLION)
TABLE 651
NORTH AMERICA: PHARMACEUTICAL EXCIPIENTS MARKET FOR STARCH, BY TYPE, 2023–2030 (USD MILLION)
TABLE 652
NORTH AMERICA: PHARMACEUTICAL EXCIPIENTS MARKET FOR PETROCHEMICALS, BY TYPE, 2023–2030 (USD MILLION)
TABLE 653
NORTH AMERICA: PHARMACEUTICAL EXCIPIENTS MARKET FOR GLYCOLS, BY TYPE, 2023–2030 (USD MILLION)
TABLE 654
NORTH AMERICA: PHARMACEUTICAL EXCIPIENTS MARKET FOR MINERAL HYDROCARBONS, BY TYPE, 2023–2030 (USD MILLION)
TABLE 655
NORTH AMERICA: PHARMACEUTICAL EXCIPIENTS MARKET FOR INORGANIC CHEMICALS, BY TYPE, 2023–2030 (USD MILLION)
TABLE 656
NORTH AMERICA: PHARMACEUTICAL EXCIPIENTS MARKET, BY FUNCTIONALITY, 2023–2030 (USD MILLION)
TABLE 657
NORTH AMERICA: PHARMACEUTICAL EXCIPIENTS MARKET, BY FORMULATION, 2023–2030 (USD MILLION)
TABLE 658
NORTH AMERICA: PHARMACEUTICAL EXCIPIENTS MARKET FOR ORAL FORMULATIONS, BY TYPE, 2023–2030 (USD MILLION)
TABLE 659
NORTH AMERICA: PHARMACEUTICAL EXCIPIENTS MARKET FOR CAPSULES, BY TYPE, 2023–2030 (USD MILLION)
TABLE 660
NORTH AMERICA: PHARMACEUTICAL EXCIPIENTS MARKET, BY FUNCTIONALITY APPLICATION, 2023–2030 (USD MILLION)
TABLE 661
US: PHARMACEUTICAL EXCIPIENTS MARKET, BY PRODUCT, 2023–2030 (USD MILLION)
TABLE 662
US: PHARMACEUTICAL EXCIPIENTS MARKET FOR ORGANIC CHEMICALS, BY TYPE, 2023–2030 (USD MILLION)
TABLE 663
US: PHARMACEUTICAL EXCIPIENTS MARKET FOR OLEOCHEMICALS, BY TYPE, 2023–2030 (USD MILLION)
TABLE 664
US: PHARMACEUTICAL EXCIPIENTS MARKET FOR CARBOHYDRATES, BY TYPE, 2023–2030 (USD MILLION)
TABLE 665
US: PHARMACEUTICAL EXCIPIENTS MARKET FOR SUGARS, BY TYPE, 2023–2030 (USD MILLION)
TABLE 666
US: PHARMACEUTICAL EXCIPIENTS MARKET FOR ACTUAL SUGARS, BY TYPE, 2023–2030 (USD MILLION)
TABLE 667
US: PHARMACEUTICAL EXCIPIENTS MARKET FOR SUGAR ALCOHOLS, BY TYPE, 2023–2030 (USD MILLION)
TABLE 668
US: PHARMACEUTICAL EXCIPIENTS MARKET FOR CELLULOSE, BY TYPE, 2023–2030 (USD MILLION)
TABLE 669
US: PHARMACEUTICAL EXCIPIENTS MARKET FOR STARCH, BY TYPE, 2023–2030 (USD MILLION)
TABLE 670
US: PHARMACEUTICAL EXCIPIENTS MARKET FOR PETROCHEMICALS, BY TYPE, 2023–2030 (USD MILLION)
TABLE 671
US: PHARMACEUTICAL EXCIPIENTS MARKET FOR GLYCOLS, BY TYPE, 2023–2030 (USD MILLION)
TABLE 672
US: PHARMACEUTICAL EXCIPIENTS MARKET FOR MINERAL HYDROCARBONS, BY TYPE, 2023–2030 (USD MILLION)
TABLE 673
US: PHARMACEUTICAL EXCIPIENTS MARKET FOR INORGANIC CHEMICALS, BY TYPE, 2023–2030 (USD MILLION)
TABLE 674
US: PHARMACEUTICAL EXCIPIENTS MARKET, BY FUNCTIONALITY, 2023–2030 (USD MILLION)
TABLE 675
US: PHARMACEUTICAL EXCIPIENTS MARKET, BY FORMULATION, 2023–2030 (USD MILLION)
TABLE 676
US: PHARMACEUTICAL EXCIPIENTS MARKET FOR ORAL FORMULATIONS, BY TYPE, 2023–2030 (USD MILLION)
TABLE 677
US: PHARMACEUTICAL EXCIPIENTS MARKET FOR CAPSULES, BY TYPE, 2023–2030 (USD MILLION)
TABLE 678
US: PHARMACEUTICAL EXCIPIENTS MARKET, BY FUNCTIONALITY APPLICATION, 2023–2030 (USD MILLION)
TABLE 679
CANADA: PHARMACEUTICAL EXCIPIENTS MARKET, BY PRODUCT, 2023–2030 (USD MILLION)
TABLE 680
CANADA: PHARMACEUTICAL EXCIPIENTS MARKET FOR ORGANIC CHEMICALS, BY TYPE, 2023–2030 (USD MILLION)
TABLE 681
CANADA: PHARMACEUTICAL EXCIPIENTS MARKET FOR OLEOCHEMICALS, BY TYPE, 2023–2030 (USD MILLION)
TABLE 682
CANADA: PHARMACEUTICAL EXCIPIENTS MARKET FOR CARBOHYDRATES, BY TYPE, 2023–2030 (USD MILLION)
TABLE 683
CANADA: PHARMACEUTICAL EXCIPIENTS MARKET FOR SUGARS, BY TYPE, 2023–2030 (USD MILLION)
TABLE 684
CANADA: PHARMACEUTICAL EXCIPIENTS MARKET FOR ACTUAL SUGARS, BY TYPE, 2023–2030 (USD MILLION)
TABLE 685
CANADA: PHARMACEUTICAL EXCIPIENTS MARKET FOR SUGAR ALCOHOLS, BY TYPE, 2023–2030 (USD MILLION)
TABLE 686
CANADA: PHARMACEUTICAL EXCIPIENTS MARKET FOR CELLULOSE, BY TYPE, 2023–2030 (USD MILLION)
TABLE 687
CANADA: PHARMACEUTICAL EXCIPIENTS MARKET FOR STARCH, BY TYPE, 2023–2030 (USD MILLION)
TABLE 688
CANADA: PHARMACEUTICAL EXCIPIENTS MARKET FOR PETROCHEMICALS, BY TYPE, 2023–2030 (USD MILLION)
TABLE 689
CANADA: PHARMACEUTICAL EXCIPIENTS MARKET FOR GLYCOLS, BY TYPE, 2023–2030 (USD MILLION)
TABLE 690
CANADA: PHARMACEUTICAL EXCIPIENTS MARKET FOR MINERAL HYDROCARBONS, BY TYPE, 2023–2030 (USD MILLION)
TABLE 691
CANADA: PHARMACEUTICAL EXCIPIENTS MARKET FOR INORGANIC CHEMICALS, BY TYPE, 2023–2030 (USD MILLION)
TABLE 692
CANADA: PHARMACEUTICAL EXCIPIENTS MARKET, BY FUNCTIONALITY, 2023–2030 (USD MILLION)
TABLE 693
CANADA: PHARMACEUTICAL EXCIPIENTS MARKET, BY FORMULATION, 2023–2030 (USD MILLION)
TABLE 694
CANADA: PHARMACEUTICAL EXCIPIENTS MARKET FOR ORAL FORMULATIONS, BY TYPE, 2023–2030 (USD MILLION)
TABLE 695
CANADA: PHARMACEUTICAL EXCIPIENTS MARKET FOR CAPSULES, BY TYPE, 2023–2030 (USD MILLION)
TABLE 696
CANADA: PHARMACEUTICAL EXCIPIENTS MARKET, BY FUNCTIONALITY APPLICATION, 2023–2030 (USD MILLION)
TABLE 697
ASIA PACIFIC: KEY MACROECONOMIC INDICATORS
TABLE 698
ASIA PACIFIC: PHARMACEUTICAL EXCIPIENTS MARKET, BY COUNTRY, 2023–2030 (USD MILLION)
TABLE 699
ASIA PACIFIC: PHARMACEUTICAL EXCIPIENTS MARKET, BY PRODUCT, 2023–2030 (USD MILLION)
TABLE 700
ASIA PACIFIC: PHARMACEUTICAL EXCIPIENTS MARKET FOR ORGANIC CHEMICALS, BY TYPE, 2023–2030 (USD MILLION)
TABLE 701
ASIA PACIFIC: PHARMACEUTICAL EXCIPIENTS MARKET FOR OLEOCHEMICALS, BY TYPE, 2023–2030 (USD MILLION)
TABLE 702
ASIA PACIFIC: PHARMACEUTICAL EXCIPIENTS MARKET FOR CARBOHYDRATES, BY TYPE, 2023–2030 (USD MILLION)
TABLE 703
ASIA PACIFIC: PHARMACEUTICAL EXCIPIENTS MARKET FOR SUGARS, BY TYPE, 2023–2030 (USD MILLION)
TABLE 704
ASIA PACIFIC: PHARMACEUTICAL EXCIPIENTS MARKET FOR ACTUAL SUGARS, BY TYPE, 2023–2030 (USD MILLION)
TABLE 705
ASIA PACIFIC: PHARMACEUTICAL EXCIPIENTS MARKET FOR SUGAR ALCOHOLS, BY TYPE, 2023–2030 (USD MILLION)
TABLE 706
ASIA PACIFIC: PHARMACEUTICAL EXCIPIENTS MARKET FOR CELLULOSE, BY TYPE, 2023–2030 (USD MILLION)
TABLE 707
ASIA PACIFIC: PHARMACEUTICAL EXCIPIENTS MARKET FOR STARCH, BY TYPE, 2023–2030 (USD MILLION)
TABLE 708
ASIA PACIFIC: PHARMACEUTICAL EXCIPIENTS MARKET FOR PETROCHEMICALS, BY TYPE, 2023–2030 (USD MILLION)
TABLE 709
ASIA PACIFIC: PHARMACEUTICAL EXCIPIENTS MARKET FOR GLYCOLS, BY TYPE, 2023–2030 (USD MILLION)
TABLE 710
ASIA PACIFIC: PHARMACEUTICAL EXCIPIENTS MARKET FOR MINERAL HYDROCARBONS, BY TYPE, 2023–2030 (USD MILLION)
TABLE 711
ASIA PACIFIC: PHARMACEUTICAL EXCIPIENTS MARKET FOR INORGANIC CHEMICALS, BY TYPE, 2023–2030 (USD MILLION)
TABLE 712
ASIA PACIFIC: PHARMACEUTICAL EXCIPIENTS MARKET, BY FUNCTIONALITY, 2023–2030 (USD MILLION)
TABLE 713
ASIA PACIFIC: PHARMACEUTICAL EXCIPIENTS MARKET, BY FORMULATION, 2023–2030 (USD MILLION)
TABLE 714
ASIA PACIFIC: PHARMACEUTICAL EXCIPIENTS MARKET FOR ORAL FORMULATIONS, BY TYPE, 2023–2030 (USD MILLION)
TABLE 715
ASIA PACIFIC: PHARMACEUTICAL EXCIPIENTS MARKET FOR CAPSULES, BY TYPE, 2023–2030 (USD MILLION)
TABLE 716
ASIA PACIFIC: PHARMACEUTICAL EXCIPIENTS MARKET, BY FUNCTIONALITY APPLICATION, 2023–2030 (USD MILLION)
TABLE 717
CHINA: PHARMACEUTICAL EXCIPIENTS MARKET, BY PRODUCT, 2023–2030 (USD MILLION)
TABLE 718
CHINA: PHARMACEUTICAL EXCIPIENTS MARKET FOR ORGANIC CHEMICALS, BY TYPE, 2023–2030 (USD MILLION)
TABLE 719
CHINA: PHARMACEUTICAL EXCIPIENTS MARKET FOR OLEOCHEMICALS, BY TYPE, 2023–2030 (USD MILLION)
TABLE 720
CHINA: PHARMACEUTICAL EXCIPIENTS MARKET FOR CARBOHYDRATES, BY TYPE, 2023–2030 (USD MILLION)
TABLE 721
CHINA: PHARMACEUTICAL EXCIPIENTS MARKET FOR SUGARS, BY TYPE, 2023–2030 (USD MILLION)
TABLE 722
CHINA: PHARMACEUTICAL EXCIPIENTS MARKET FOR ACTUAL SUGARS, BY TYPE, 2023–2030 (USD MILLION)
TABLE 723
CHINA: PHARMACEUTICAL EXCIPIENTS MARKET FOR SUGAR ALCOHOLS, BY TYPE, 2023–2030 (USD MILLION)
TABLE 724
CHINA: PHARMACEUTICAL EXCIPIENTS MARKET FOR CELLULOSE, BY TYPE, 2023–2030 (USD MILLION)
TABLE 725
CHINA: PHARMACEUTICAL EXCIPIENTS MARKET FOR STARCH, BY TYPE, 2023–2030 (USD MILLION)
TABLE 726
CHINA: PHARMACEUTICAL EXCIPIENTS MARKET FOR PETROCHEMICALS, BY TYPE, 2023–2030 (USD MILLION)
TABLE 727
CHINA: PHARMACEUTICAL EXCIPIENTS MARKET FOR GLYCOLS, BY TYPE, 2023–2030 (USD MILLION)
TABLE 728
CHINA: PHARMACEUTICAL EXCIPIENTS MARKET FOR MINERAL HYDROCARBONS, BY TYPE, 2023–2030 (USD MILLION)
TABLE 729
CHINA: PHARMACEUTICAL EXCIPIENTS MARKET FOR INORGANIC CHEMICALS, BY TYPE, 2023–2030 (USD MILLION)
TABLE 730
CHINA: PHARMACEUTICAL EXCIPIENTS MARKET, BY FUNCTIONALITY, 2023–2030 (USD MILLION)
TABLE 731
CHINA: PHARMACEUTICAL EXCIPIENTS MARKET, BY FORMULATION, 2023–2030 (USD MILLION)
TABLE 732
CHINA: PHARMACEUTICAL EXCIPIENTS MARKET FOR ORAL FORMULATIONS, BY TYPE, 2023–2030 (USD MILLION)
TABLE 733
CHINA: PHARMACEUTICAL EXCIPIENTS MARKET FOR CAPSULES, BY TYPE, 2023–2030 (USD MILLION)
TABLE 734
CHINA: PHARMACEUTICAL EXCIPIENTS MARKET, BY FUNCTIONALITY APPLICATION, 2023–2030 (USD MILLION)
TABLE 735
JAPAN: PHARMACEUTICAL EXCIPIENTS MARKET, BY PRODUCT, 2023–2030 (USD MILLION)
TABLE 736
JAPAN: PHARMACEUTICAL EXCIPIENTS MARKET FOR ORGANIC CHEMICALS, BY TYPE, 2023–2030 (USD MILLION)
TABLE 737
JAPAN: PHARMACEUTICAL EXCIPIENTS MARKET FOR OLEOCHEMICALS, BY TYPE, 2023–2030 (USD MILLION)
TABLE 738
JAPAN: PHARMACEUTICAL EXCIPIENTS MARKET FOR CARBOHYDRATES, BY TYPE, 2023–2030 (USD MILLION)
TABLE 739
JAPAN: PHARMACEUTICAL EXCIPIENTS MARKET FOR SUGARS, BY TYPE, 2023–2030 (USD MILLION)
TABLE 740
JAPAN: PHARMACEUTICAL EXCIPIENTS MARKET FOR ACTUAL SUGARS, BY TYPE, 2023–2030 (USD MILLION)
TABLE 741
JAPAN: PHARMACEUTICAL EXCIPIENTS MARKET FOR SUGAR ALCOHOLS, BY TYPE, 2023–2030 (USD MILLION)
TABLE 742
JAPAN: PHARMACEUTICAL EXCIPIENTS MARKET FOR CELLULOSE, BY TYPE, 2023–2030 (USD MILLION)
TABLE 743
JAPAN: PHARMACEUTICAL EXCIPIENTS MARKET FOR STARCH, BY TYPE, 2023–2030 (USD MILLION)
TABLE 744
JAPAN: PHARMACEUTICAL EXCIPIENTS MARKET FOR PETROCHEMICALS, BY TYPE, 2023–2030 (USD MILLION)
TABLE 745
JAPAN: PHARMACEUTICAL EXCIPIENTS MARKET FOR GLYCOLS, BY TYPE, 2023–2030 (USD MILLION)
TABLE 746
JAPAN: PHARMACEUTICAL EXCIPIENTS MARKET FOR MINERAL HYDROCARBONS, BY TYPE, 2023–2030 (USD MILLION)
TABLE 747
JAPAN: PHARMACEUTICAL EXCIPIENTS MARKET FOR INORGANIC CHEMICALS, BY TYPE, 2023–2030 (USD MILLION)
TABLE 748
JAPAN: PHARMACEUTICAL EXCIPIENTS MARKET, BY FUNCTIONALITY, 2023–2030 (USD MILLION)
TABLE 749
JAPAN: PHARMACEUTICAL EXCIPIENTS MARKET, BY FORMULATION, 2023–2030 (USD MILLION)
TABLE 750
JAPAN: PHARMACEUTICAL EXCIPIENTS MARKET FOR ORAL FORMULATIONS, BY TYPE, 2023–2030 (USD MILLION)
TABLE 751
JAPAN: PHARMACEUTICAL EXCIPIENTS MARKET FOR CAPSULES, BY TYPE, 2023–2030 (USD MILLION)
TABLE 752
JAPAN: PHARMACEUTICAL EXCIPIENTS MARKET, BY FUNCTIONALITY APPLICATION, 2023–2030 (USD MILLION)
TABLE 753
INDIA: PHARMACEUTICAL EXCIPIENTS MARKET, BY PRODUCT, 2023–2030 (USD MILLION)
TABLE 754
INDIA: PHARMACEUTICAL EXCIPIENTS MARKET FOR ORGANIC CHEMICALS, BY TYPE, 2023–2030 (USD MILLION)
TABLE 755
INDIA: PHARMACEUTICAL EXCIPIENTS MARKET FOR OLEOCHEMICALS, BY TYPE, 2023–2030 (USD MILLION)
TABLE 756
INDIA: PHARMACEUTICAL EXCIPIENTS MARKET FOR CARBOHYDRATES, BY TYPE, 2023–2030 (USD MILLION)
TABLE 757
INDIA: PHARMACEUTICAL EXCIPIENTS MARKET FOR SUGARS, BY TYPE, 2023–2030 (USD MILLION)
TABLE 758
INDIA: PHARMACEUTICAL EXCIPIENTS MARKET FOR ACTUAL SUGARS, BY TYPE, 2023–2030 (USD MILLION)
TABLE 759
INDIA: PHARMACEUTICAL EXCIPIENTS MARKET FOR SUGAR ALCOHOLS, BY TYPE, 2023–2030 (USD MILLION)
TABLE 760
INDIA: PHARMACEUTICAL EXCIPIENTS MARKET FOR CELLULOSE, BY TYPE, 2023–2030 (USD MILLION)
TABLE 761
INDIA: PHARMACEUTICAL EXCIPIENTS MARKET FOR STARCH, BY TYPE, 2023–2030 (USD MILLION)
TABLE 762
INDIA: PHARMACEUTICAL EXCIPIENTS MARKET FOR PETROCHEMICALS, BY TYPE, 2023–2030 (USD MILLION)
TABLE 763
INDIA: PHARMACEUTICAL EXCIPIENTS MARKET FOR GLYCOLS, BY TYPE, 2023–2030 (USD MILLION)
TABLE 764
INDIA: PHARMACEUTICAL EXCIPIENTS MARKET FOR MINERAL HYDROCARBONS, BY TYPE, 2023–2030 (USD MILLION)
TABLE 765
INDIA: PHARMACEUTICAL EXCIPIENTS MARKET FOR INORGANIC CHEMICALS, BY TYPE, 2023–2030 (USD MILLION)
TABLE 766
INDIA: PHARMACEUTICAL EXCIPIENTS MARKET, BY FUNCTIONALITY, 2023–2030 (USD MILLION)
TABLE 767
INDIA: PHARMACEUTICAL EXCIPIENTS MARKET, BY FORMULATION, 2023–2030 (USD MILLION)
TABLE 768
INDIA: PHARMACEUTICAL EXCIPIENTS MARKET FOR ORAL FORMULATIONS, BY TYPE, 2023–2030 (USD MILLION)
TABLE 769
INDIA: PHARMACEUTICAL EXCIPIENTS MARKET FOR CAPSULES, BY TYPE, 2023–2030 (USD MILLION)
TABLE 770
INDIA: PHARMACEUTICAL EXCIPIENTS MARKET, BY FUNCTIONALITY APPLICATION, 2023–2030 (USD MILLION)
TABLE 771
SOUTH KOREA: PHARMACEUTICAL EXCIPIENTS MARKET, BY PRODUCT, 2023–2030 (USD MILLION)
TABLE 772
SOUTH KOREA: PHARMACEUTICAL EXCIPIENTS MARKET FOR ORGANIC CHEMICALS, BY TYPE, 2023–2030 (USD MILLION)
TABLE 773
SOUTH KOREA: PHARMACEUTICAL EXCIPIENTS MARKET FOR OLEOCHEMICALS, BY TYPE, 2023–2030 (USD MILLION)
TABLE 774
SOUTH KOREA: PHARMACEUTICAL EXCIPIENTS MARKET FOR CARBOHYDRATES, BY TYPE, 2023–2030 (USD MILLION)
TABLE 775
SOUTH KOREA: PHARMACEUTICAL EXCIPIENTS MARKET FOR SUGARS, BY TYPE, 2023–2030 (USD MILLION)
TABLE 776
SOUTH KOREA: PHARMACEUTICAL EXCIPIENTS MARKET FOR ACTUAL SUGARS, BY TYPE, 2023–2030 (USD MILLION)
TABLE 777
SOUTH KOREA: PHARMACEUTICAL EXCIPIENTS MARKET FOR SUGAR ALCOHOLS, BY TYPE, 2023–2030 (USD MILLION)
TABLE 778
SOUTH KOREA: PHARMACEUTICAL EXCIPIENTS MARKET FOR CELLULOSE, BY TYPE, 2023–2030 (USD MILLION)
TABLE 779
SOUTH KOREA: PHARMACEUTICAL EXCIPIENTS MARKET FOR STARCH, BY TYPE, 2023–2030 (USD MILLION)
TABLE 780
SOUTH KOREA: PHARMACEUTICAL EXCIPIENTS MARKET FOR PETROCHEMICALS, BY TYPE, 2023–2030 (USD MILLION)
TABLE 781
SOUTH KOREA: PHARMACEUTICAL EXCIPIENTS MARKET FOR GLYCOLS, BY TYPE, 2023–2030 (USD MILLION)
TABLE 782
SOUTH KOREA: PHARMACEUTICAL EXCIPIENTS MARKET FOR MINERAL HYDROCARBONS, BY TYPE, 2023–2030 (USD MILLION)
TABLE 783
SOUTH KOREA: PHARMACEUTICAL EXCIPIENTS MARKET FOR INORGANIC CHEMICALS, BY TYPE, 2023–2030 (USD MILLION)
TABLE 784
SOUTH KOREA: PHARMACEUTICAL EXCIPIENTS MARKET, BY FUNCTIONALITY, 2023–2030 (USD MILLION)
TABLE 785
SOUTH KOREA: PHARMACEUTICAL EXCIPIENTS MARKET, BY FORMULATION, 2023–2030 (USD MILLION)
TABLE 786
SOUTH KOREA: PHARMACEUTICAL EXCIPIENTS MARKET FOR ORAL FORMULATIONS, BY TYPE, 2023–2030 (USD MILLION)
TABLE 787
SOUTH KOREA: PHARMACEUTICAL EXCIPIENTS MARKET FOR CAPSULES, BY TYPE, 2023–2030 (USD MILLION)
TABLE 788
SOUTH KOREA: PHARMACEUTICAL EXCIPIENTS MARKET, BY FUNCTIONALITY APPLICATION, 2023–2030 (USD MILLION)
TABLE 789
REST OF ASIA PACIFIC: PHARMACEUTICAL EXCIPIENTS MARKET, BY PRODUCT, 2023–2030 (USD MILLION)
TABLE 790
REST OF ASIA PACIFIC: PHARMACEUTICAL EXCIPIENTS MARKET FOR ORGANIC CHEMICALS, BY TYPE, 2023–2030 (USD MILLION)
TABLE 791
REST OF ASIA PACIFIC: PHARMACEUTICAL EXCIPIENTS MARKET FOR OLEOCHEMICALS, BY TYPE, 2023–2030 (USD MILLION)
TABLE 792
REST OF ASIA PACIFIC: PHARMACEUTICAL EXCIPIENTS MARKET FOR CARBOHYDRATES, BY TYPE, 2023–2030 (USD MILLION)
TABLE 793
REST OF ASIA PACIFIC: PHARMACEUTICAL EXCIPIENTS MARKET FOR SUGARS, BY TYPE, 2023–2030 (USD MILLION)
TABLE 794
REST OF ASIA PACIFIC: PHARMACEUTICAL EXCIPIENTS MARKET FOR ACTUAL SUGARS, BY TYPE, 2023–2030 (USD MILLION)
TABLE 795
REST OF ASIA PACIFIC: PHARMACEUTICAL EXCIPIENTS MARKET FOR SUGAR ALCOHOLS, BY TYPE, 2023–2030 (USD MILLION)
TABLE 796
REST OF ASIA PACIFIC: PHARMACEUTICAL EXCIPIENTS MARKET FOR CELLULOSE, BY TYPE, 2023–2030 (USD MILLION)
TABLE 797
REST OF ASIA PACIFIC: PHARMACEUTICAL EXCIPIENTS MARKET FOR STARCH, BY TYPE, 2023–2030 (USD MILLION)
TABLE 798
REST OF ASIA PACIFIC: PHARMACEUTICAL EXCIPIENTS MARKET FOR PETROCHEMICALS, BY TYPE, 2023–2030 (USD MILLION)
TABLE 799
REST OF ASIA PACIFIC: PHARMACEUTICAL EXCIPIENTS MARKET FOR GLYCOLS, BY TYPE, 2023–2030 (USD MILLION)
TABLE 800
REST OF ASIA PACIFIC: PHARMACEUTICAL EXCIPIENTS MARKET FOR MINERAL HYDROCARBONS, BY TYPE, 2023–2030 (USD MILLION)
TABLE 801
REST OF ASIA PACIFIC: PHARMACEUTICAL EXCIPIENTS MARKET FOR INORGANIC CHEMICALS, BY TYPE, 2023–2030 (USD MILLION)
TABLE 802
REST OF ASIA PACIFIC: PHARMACEUTICAL EXCIPIENTS MARKET, BY FUNCTIONALITY, 2023–2030 (USD MILLION)
TABLE 803
REST OF ASIA PACIFIC: PHARMACEUTICAL EXCIPIENTS MARKET, BY FORMULATION, 2023–2030 (USD MILLION)
TABLE 804
REST OF ASIA PACIFIC: PHARMACEUTICAL EXCIPIENTS MARKET FOR ORAL FORMULATIONS, BY TYPE, 2023–2030 (USD MILLION)
TABLE 805
REST OF ASIA PACIFIC: PHARMACEUTICAL EXCIPIENTS MARKET FOR CAPSULES, BY TYPE, 2023–2030 (USD MILLION)
TABLE 806
REST OF ASIA PACIFIC: PHARMACEUTICAL EXCIPIENTS MARKET, BY FUNCTIONALITY APPLICATION, 2023–2030 (USD MILLION)
TABLE 807
LATIN AMERICA: KEY MACROECONOMIC INDICATORS
TABLE 808
LATIN AMERICA: PHARMACEUTICAL EXCIPIENTS MARKET, BY COUNTRY, 2023–2030 (USD MILLION)
TABLE 809
LATIN AMERICA: PHARMACEUTICAL EXCIPIENTS MARKET, BY PRODUCT, 2023–2030 (USD MILLION)
TABLE 810
LATIN AMERICA: PHARMACEUTICAL EXCIPIENTS MARKET FOR ORGANIC CHEMICALS, BY TYPE, 2023–2030 (USD MILLION)
TABLE 811
LATIN AMERICA: PHARMACEUTICAL EXCIPIENTS MARKET FOR OLEOCHEMICALS, BY TYPE, 2023–2030 (USD MILLION)
TABLE 812
LATIN AMERICA: PHARMACEUTICAL EXCIPIENTS MARKET FOR CARBOHYDRATES, BY TYPE, 2023–2030 (USD MILLION)
TABLE 813
LATIN AMERICA: PHARMACEUTICAL EXCIPIENTS MARKET FOR SUGARS, BY TYPE, 2023–2030 (USD MILLION)
TABLE 814
LATIN AMERICA: PHARMACEUTICAL EXCIPIENTS MARKET FOR ACTUAL SUGARS, BY TYPE, 2023–2030 (USD MILLION)
TABLE 815
LATIN AMERICA: PHARMACEUTICAL EXCIPIENTS MARKET FOR SUGAR ALCOHOLS, BY TYPE, 2023–2030 (USD MILLION)
TABLE 816
LATIN AMERICA: PHARMACEUTICAL EXCIPIENTS MARKET FOR CELLULOSE, BY TYPE, 2023–2030 (USD MILLION)
TABLE 817
LATIN AMERICA: PHARMACEUTICAL EXCIPIENTS MARKET FOR STARCH, BY TYPE, 2023–2030 (USD MILLION)
TABLE 818
LATIN AMERICA: PHARMACEUTICAL EXCIPIENTS MARKET FOR PETROCHEMICALS, BY TYPE, 2023–2030 (USD MILLION)
TABLE 819
LATIN AMERICA: PHARMACEUTICAL EXCIPIENTS MARKET FOR GLYCOLS, BY TYPE, 2023–2030 (USD MILLION)
TABLE 820
LATIN AMERICA: PHARMACEUTICAL EXCIPIENTS MARKET FOR MINERAL HYDROCARBONS, BY TYPE, 2023–2030 (USD MILLION)
TABLE 821
LATIN AMERICA: PHARMACEUTICAL EXCIPIENTS MARKET FOR INORGANIC CHEMICALS, BY TYPE, 2023–2030 (USD MILLION)
TABLE 822
LATIN AMERICA: PHARMACEUTICAL EXCIPIENTS MARKET, BY FUNCTIONALITY, 2023–2030 (USD MILLION)
TABLE 823
LATIN AMERICA: PHARMACEUTICAL EXCIPIENTS MARKET, BY FORMULATION, 2023–2030 (USD MILLION)
TABLE 824
LATIN AMERICA: PHARMACEUTICAL EXCIPIENTS MARKET FOR ORAL FORMULATIONS, BY TYPE, 2023–2030 (USD MILLION)
TABLE 825
LATIN AMERICA: PHARMACEUTICAL EXCIPIENTS MARKET FOR CAPSULES, BY TYPE, 2023–2030 (USD MILLION)
TABLE 826
LATIN AMERICA: PHARMACEUTICAL EXCIPIENTS MARKET, BY FUNCTIONALITY APPLICATION, 2023–2030 (USD MILLION)
TABLE 827
BRAZIL: PHARMACEUTICAL EXCIPIENTS MARKET, BY PRODUCT, 2023–2030 (USD MILLION)
TABLE 828
BRAZIL: PHARMACEUTICAL EXCIPIENTS MARKET FOR ORGANIC CHEMICALS, BY TYPE, 2023–2030 (USD MILLION)
TABLE 829
BRAZIL: PHARMACEUTICAL EXCIPIENTS MARKET FOR OLEOCHEMICALS, BY TYPE, 2023–2030 (USD MILLION)
TABLE 830
BRAZIL: PHARMACEUTICAL EXCIPIENTS MARKET FOR CARBOHYDRATES, BY TYPE, 2023–2030 (USD MILLION)
TABLE 831
BRAZIL: PHARMACEUTICAL EXCIPIENTS MARKET FOR SUGARS, BY TYPE, 2023–2030 (USD MILLION)
TABLE 832
BRAZIL: PHARMACEUTICAL EXCIPIENTS MARKET FOR ACTUAL SUGARS, BY TYPE, 2023–2030 (USD MILLION)
TABLE 833
BRAZIL: PHARMACEUTICAL EXCIPIENTS MARKET FOR SUGAR ALCOHOLS, BY TYPE, 2023–2030 (USD MILLION)
TABLE 834
BRAZIL: PHARMACEUTICAL EXCIPIENTS MARKET FOR CELLULOSE, BY TYPE, 2023–2030 (USD MILLION)
TABLE 835
BRAZIL: PHARMACEUTICAL EXCIPIENTS MARKET FOR STARCH, BY TYPE, 2023–2030 (USD MILLION)
TABLE 836
BRAZIL: PHARMACEUTICAL EXCIPIENTS MARKET FOR PETROCHEMICALS, BY TYPE, 2023–2030 (USD MILLION)
TABLE 837
BRAZIL: PHARMACEUTICAL EXCIPIENTS MARKET FOR GLYCOLS, BY TYPE, 2023–2030 (USD MILLION)
TABLE 838
BRAZIL: PHARMACEUTICAL EXCIPIENTS MARKET FOR MINERAL HYDROCARBONS, BY TYPE, 2023–2030 (USD MILLION)
TABLE 839
BRAZIL: PHARMACEUTICAL EXCIPIENTS MARKET FOR INORGANIC CHEMICALS, BY TYPE, 2023–2030 (USD MILLION)
TABLE 840
BRAZIL: PHARMACEUTICAL EXCIPIENTS MARKET, BY FUNCTIONALITY, 2023–2030 (USD MILLION)
TABLE 841
BRAZIL: PHARMACEUTICAL EXCIPIENTS MARKET, BY FORMULATION, 2023–2030 (USD MILLION)
TABLE 842
BRAZIL: PHARMACEUTICAL EXCIPIENTS MARKET FOR ORAL FORMULATIONS, BY TYPE, 2023–2030 (USD MILLION)
TABLE 843
BRAZIL: PHARMACEUTICAL EXCIPIENTS MARKET FOR CAPSULES, BY TYPE, 2023–2030 (USD MILLION)
TABLE 844
BRAZIL: PHARMACEUTICAL EXCIPIENTS MARKET, BY FUNCTIONALITY APPLICATION, 2023–2030 (USD MILLION)
TABLE 845
MEXICO: PHARMACEUTICAL EXCIPIENTS MARKET, BY PRODUCT, 2023–2030 (USD MILLION)
TABLE 846
MEXICO: PHARMACEUTICAL EXCIPIENTS MARKET FOR ORGANIC CHEMICALS, BY TYPE, 2023–2030 (USD MILLION)
TABLE 847
MEXICO: PHARMACEUTICAL EXCIPIENTS MARKET FOR OLEOCHEMICALS, BY TYPE, 2023–2030 (USD MILLION)
TABLE 848
MEXICO: PHARMACEUTICAL EXCIPIENTS MARKET FOR CARBOHYDRATES, BY TYPE, 2023–2030 (USD MILLION)
TABLE 849
MEXICO: PHARMACEUTICAL EXCIPIENTS MARKET FOR SUGARS, BY TYPE, 2023–2030 (USD MILLION)
TABLE 850
MEXICO: PHARMACEUTICAL EXCIPIENTS MARKET FOR ACTUAL SUGARS, BY TYPE, 2023–2030 (USD MILLION)
TABLE 851
MEXICO: PHARMACEUTICAL EXCIPIENTS MARKET FOR SUGAR ALCOHOLS, BY TYPE, 2023–2030 (USD MILLION)
TABLE 852
MEXICO: PHARMACEUTICAL EXCIPIENTS MARKET FOR CELLULOSE, BY TYPE, 2023–2030 (USD MILLION)
TABLE 853
MEXICO: PHARMACEUTICAL EXCIPIENTS MARKET FOR STARCH, BY TYPE, 2023–2030 (USD MILLION)
TABLE 854
MEXICO: PHARMACEUTICAL EXCIPIENTS MARKET FOR PETROCHEMICALS, BY TYPE, 2023–2030 (USD MILLION)
TABLE 855
MEXICO: PHARMACEUTICAL EXCIPIENTS MARKET FOR GLYCOLS, BY TYPE, 2023–2030 (USD MILLION)
TABLE 856
MEXICO: PHARMACEUTICAL EXCIPIENTS MARKET FOR MINERAL HYDROCARBONS, BY TYPE, 2023–2030 (USD MILLION)
TABLE 857
MEXICO: PHARMACEUTICAL EXCIPIENTS MARKET FOR INORGANIC CHEMICALS, BY TYPE, 2023–2030 (USD MILLION)
TABLE 858
MEXICO: PHARMACEUTICAL EXCIPIENTS MARKET, BY FUNCTIONALITY, 2023–2030 (USD MILLION)
TABLE 859
MEXICO: PHARMACEUTICAL EXCIPIENTS MARKET, BY FORMULATION, 2023–2030 (USD MILLION)
TABLE 860
MEXICO: PHARMACEUTICAL EXCIPIENTS MARKET FOR ORAL FORMULATIONS, BY TYPE, 2023–2030 (USD MILLION)
TABLE 861
MEXICO: PHARMACEUTICAL EXCIPIENTS MARKET FOR CAPSULES, BY TYPE, 2023–2030 (USD MILLION)
TABLE 862
MEXICO: PHARMACEUTICAL EXCIPIENTS MARKET, BY FUNCTIONALITY APPLICATION, 2023–2030 (USD MILLION)
TABLE 863
REST OF LATIN AMERICA: PHARMACEUTICAL EXCIPIENTS MARKET, BY PRODUCT, 2023–2030 (USD MILLION)
TABLE 864
REST OF LATIN AMERICA: PHARMACEUTICAL EXCIPIENTS MARKET FOR ORGANIC CHEMICALS, BY TYPE, 2023–2030 (USD MILLION)
TABLE 865
REST OF LATIN AMERICA: PHARMACEUTICAL EXCIPIENTS MARKET FOR OLEOCHEMICALS, BY TYPE, 2023–2030 (USD MILLION)
TABLE 866
REST OF LATIN AMERICA: PHARMACEUTICAL EXCIPIENTS MARKET FOR CARBOHYDRATES, BY TYPE, 2023–2030 (USD MILLION)
TABLE 867
REST OF LATIN AMERICA: PHARMACEUTICAL EXCIPIENTS MARKET FOR SUGARS, BY TYPE, 2023–2030 (USD MILLION)
TABLE 868
REST OF LATIN AMERICA: PHARMACEUTICAL EXCIPIENTS MARKET FOR ACTUAL SUGARS, BY TYPE, 2023–2030 (USD MILLION)
TABLE 869
REST OF LATIN AMERICA: PHARMACEUTICAL EXCIPIENTS MARKET FOR SUGAR ALCOHOLS, BY TYPE, 2023–2030 (USD MILLION)
TABLE 870
REST OF LATIN AMERICA: PHARMACEUTICAL EXCIPIENTS MARKET FOR CELLULOSE, BY TYPE, 2023–2030 (USD MILLION)
TABLE 871
REST OF LATIN AMERICA: PHARMACEUTICAL EXCIPIENTS MARKET FOR STARCH, BY TYPE, 2023–2030 (USD MILLION)
TABLE 872
REST OF LATIN AMERICA: PHARMACEUTICAL EXCIPIENTS MARKET FOR PETROCHEMICALS, BY TYPE, 2023–2030 (USD MILLION)
TABLE 873
REST OF LATIN AMERICA: PHARMACEUTICAL EXCIPIENTS MARKET FOR GLYCOLS, BY TYPE, 2023–2030 (USD MILLION)
TABLE 874
REST OF LATIN AMERICA: PHARMACEUTICAL EXCIPIENTS MARKET FOR MINERAL HYDROCARBONS, BY TYPE, 2023–2030 (USD MILLION)
TABLE 875
REST OF LATIN AMERICA: PHARMACEUTICAL EXCIPIENTS MARKET FOR INORGANIC CHEMICALS, BY TYPE, 2023–2030 (USD MILLION)
TABLE 876
REST OF LATIN AMERICA: PHARMACEUTICAL EXCIPIENTS MARKET, BY FUNCTIONALITY, 2023–2030 (USD MILLION)
TABLE 877
REST OF LATIN AMERICA: PHARMACEUTICAL EXCIPIENTS MARKET, BY FORMULATION, 2023–2030 (USD MILLION)
TABLE 878
REST OF LATIN AMERICA: PHARMACEUTICAL EXCIPIENTS MARKET FOR ORAL FORMULATIONS, BY TYPE, 2023–2030 (USD MILLION)
TABLE 879
REST OF LATIN AMERICA: PHARMACEUTICAL EXCIPIENTS MARKET FOR CAPSULES, BY TYPE, 2023–2030 (USD MILLION)
TABLE 880
REST OF LATIN AMERICA: PHARMACEUTICAL EXCIPIENTS MARKET, BY FUNCTIONALITY APPLICATION, 2023–2030 (USD MILLION)
TABLE 881
MIDDLE EAST: KEY MACROECONOMIC INDICATORS
TABLE 882
MIDDLE EAST: PHARMACEUTICAL EXCIPIENTS MARKET, BY REGION, 2023–2030 (USD MILLION)
TABLE 883
MIDDLE EAST: PHARMACEUTICAL EXCIPIENTS MARKET, BY PRODUCT, 2023–2030 (USD MILLION)
TABLE 884
MIDDLE EAST: PHARMACEUTICAL EXCIPIENTS MARKET FOR ORGANIC CHEMICALS, BY TYPE, 2023–2030 (USD MILLION)
TABLE 885
MIDDLE EAST: PHARMACEUTICAL EXCIPIENTS MARKET FOR OLEOCHEMICALS, BY TYPE, 2023–2030 (USD MILLION)
TABLE 886
MIDDLE EAST: PHARMACEUTICAL EXCIPIENTS MARKET FOR CARBOHYDRATES, BY TYPE, 2023–2030 (USD MILLION)
TABLE 887
MIDDLE EAST: PHARMACEUTICAL EXCIPIENTS MARKET FOR SUGARS, BY TYPE, 2023–2030 (USD MILLION)
TABLE 888
MIDDLE EAST: PHARMACEUTICAL EXCIPIENTS MARKET FOR ACTUAL SUGARS, BY TYPE, 2023–2030 (USD MILLION)
TABLE 889
MIDDLE EAST: PHARMACEUTICAL EXCIPIENTS MARKET FOR SUGAR ALCOHOLS, BY TYPE, 2023–2030 (USD MILLION)
TABLE 890
MIDDLE EAST: PHARMACEUTICAL EXCIPIENTS MARKET FOR CELLULOSE, BY TYPE, 2023–2030 (USD MILLION)
TABLE 891
MIDDLE EAST: PHARMACEUTICAL EXCIPIENTS MARKET FOR STARCH, BY TYPE, 2023–2030 (USD MILLION)
TABLE 892
MIDDLE EAST: PHARMACEUTICAL EXCIPIENTS MARKET FOR PETROCHEMICALS, BY TYPE, 2023–2030 (USD MILLION)
TABLE 893
MIDDLE EAST: PHARMACEUTICAL EXCIPIENTS MARKET FOR GLYCOLS, BY TYPE, 2023–2030 (USD MILLION)
TABLE 894
MIDDLE EAST: PHARMACEUTICAL EXCIPIENTS MARKET FOR MINERAL HYDROCARBONS, BY TYPE, 2023–2030 (USD MILLION)
TABLE 895
MIDDLE EAST: PHARMACEUTICAL EXCIPIENTS MARKET FOR INORGANIC CHEMICALS, BY TYPE, 2023–2030 (USD MILLION)
TABLE 896
MIDDLE EAST: PHARMACEUTICAL EXCIPIENTS MARKET, BY FUNCTIONALITY, 2023–2030 (USD MILLION)
TABLE 897
MIDDLE EAST: PHARMACEUTICAL EXCIPIENTS MARKET, BY FORMULATION, 2023–2030 (USD MILLION)
TABLE 898
MIDDLE EAST: PHARMACEUTICAL EXCIPIENTS MARKET FOR ORAL FORMULATIONS, BY TYPE, 2023–2030 (USD MILLION)
TABLE 899
MIDDLE EAST: PHARMACEUTICAL EXCIPIENTS MARKET FOR CAPSULES, BY TYPE, 2023–2030 (USD MILLION)
TABLE 900
MIDDLE EAST: PHARMACEUTICAL EXCIPIENTS MARKET, BY FUNCTIONALITY APPLICATION, 2023–2030 (USD MILLION)
TABLE 901
GCC COUNTRIES: PHARMACEUTICAL EXCIPIENTS MARKET, BY PRODUCT, 2023–2030 (USD MILLION)
TABLE 902
GCC COUNTRIES: PHARMACEUTICAL EXCIPIENTS MARKET FOR ORGANIC CHEMICALS, BY TYPE, 2023–2030 (USD MILLION)
TABLE 903
GCC COUNTRIES: PHARMACEUTICAL EXCIPIENTS MARKET FOR OLEOCHEMICALS, BY TYPE, 2023–2030 (USD MILLION)
TABLE 904
GCC COUNTRIES: PHARMACEUTICAL EXCIPIENTS MARKET FOR CARBOHYDRATES, BY TYPE, 2023–2030 (USD MILLION)
TABLE 905
GCC COUNTRIES: PHARMACEUTICAL EXCIPIENTS MARKET FOR SUGARS, BY TYPE, 2023–2030 (USD MILLION)
TABLE 906
GCC COUNTRIES: PHARMACEUTICAL EXCIPIENTS MARKET FOR ACTUAL SUGARS, BY TYPE, 2023–2030 (USD MILLION)
TABLE 907
GCC COUNTRIES: PHARMACEUTICAL EXCIPIENTS MARKET FOR SUGAR ALCOHOLS, BY TYPE, 2023–2030 (USD MILLION)
TABLE 908
GCC COUNTRIES: PHARMACEUTICAL EXCIPIENTS MARKET FOR CELLULOSE, BY TYPE, 2023–2030 (USD MILLION)
TABLE 909
GCC COUNTRIES: PHARMACEUTICAL EXCIPIENTS MARKET FOR STARCH, BY TYPE, 2023–2030 (USD MILLION)
TABLE 910
GCC COUNTRIES: PHARMACEUTICAL EXCIPIENTS MARKET FOR PETROCHEMICALS, BY TYPE, 2023–2030 (USD MILLION)
TABLE 911
GCC COUNTRIES: PHARMACEUTICAL EXCIPIENTS MARKET FOR GLYCOLS, BY TYPE, 2023–2030 (USD MILLION)
TABLE 912
GCC COUNTRIES: PHARMACEUTICAL EXCIPIENTS MARKET FOR MINERAL HYDROCARBONS, BY TYPE, 2023–2030 (USD MILLION)
TABLE 913
GCC COUNTRIES: PHARMACEUTICAL EXCIPIENTS MARKET FOR INORGANIC CHEMICALS, BY TYPE, 2023–2030 (USD MILLION)
TABLE 914
GCC COUNTRIES: PHARMACEUTICAL EXCIPIENTS MARKET, BY FUNCTIONALITY, 2023–2030 (USD MILLION)
TABLE 915
GCC COUNTRIES: PHARMACEUTICAL EXCIPIENTS MARKET, BY FORMULATION, 2023–2030 (USD MILLION)
TABLE 916
GCC COUNTRIES: PHARMACEUTICAL EXCIPIENTS MARKET FOR ORAL FORMULATIONS, BY TYPE, 2023–2030 (USD MILLION)
TABLE 917
GCC COUNTRIES: PHARMACEUTICAL EXCIPIENTS MARKET FOR CAPSULES, BY TYPE, 2023–2030 (USD MILLION)
TABLE 918
GCC COUNTRIES: PHARMACEUTICAL EXCIPIENTS MARKET, BY FUNCTIONALITY APPLICATION, 2023–2030 (USD MILLION)
TABLE 919
REST OF MIDDLE EAST: PHARMACEUTICAL EXCIPIENTS MARKET, BY PRODUCT, 2023–2030 (USD MILLION)
TABLE 920
REST OF MIDDLE EAST: PHARMACEUTICAL EXCIPIENTS MARKET FOR ORGANIC CHEMICALS, BY TYPE, 2023–2030 (USD MILLION)
TABLE 921
REST OF MIDDLE EAST: PHARMACEUTICAL EXCIPIENTS MARKET FOR OLEOCHEMICALS, BY TYPE, 2023–2030 (USD MILLION)
TABLE 922
REST OF MIDDLE EAST: PHARMACEUTICAL EXCIPIENTS MARKET FOR CARBOHYDRATES, BY TYPE, 2023–2030 (USD MILLION)
TABLE 923
REST OF MIDDLE EAST: PHARMACEUTICAL EXCIPIENTS MARKET FOR SUGARS, BY TYPE, 2023–2030 (USD MILLION)
TABLE 924
REST OF MIDDLE EAST: PHARMACEUTICAL EXCIPIENTS MARKET FOR ACTUAL SUGARS, BY TYPE, 2023–2030 (USD MILLION)
TABLE 925
REST OF MIDDLE EAST: PHARMACEUTICAL EXCIPIENTS MARKET FOR SUGAR ALCOHOLS, BY TYPE, 2023–2030 (USD MILLION)
TABLE 926
REST OF MIDDLE EAST: PHARMACEUTICAL EXCIPIENTS MARKET FOR CELLULOSE MARKET, BY TYPE, 2023–2030 (USD MILLION)
TABLE 927
REST OF MIDDLE EAST: PHARMACEUTICAL EXCIPIENTS MARKET FOR STARCH, BY TYPE, 2023–2030 (USD MILLION)
TABLE 928
REST OF MIDDLE EAST: PHARMACEUTICAL EXCIPIENTS MARKET FOR PETROCHEMICALS, BY TYPE, 2023–2030 (USD MILLION)
TABLE 929
REST OF MIDDLE EAST: PHARMACEUTICAL EXCIPIENTS MARKET FOR GLYCOLS, BY TYPE, 2023–2030 (USD MILLION)
TABLE 930
REST OF MIDDLE EAST: PHARMACEUTICAL EXCIPIENTS MARKET FOR MINERAL HYDROCARBONS, BY TYPE, 2023–2030 (USD MILLION)
TABLE 931
REST OF MIDDLE EAST: PHARMACEUTICAL EXCIPIENTS MARKET FOR INORGANIC CHEMICALS, BY TYPE, 2023–2030 (USD MILLION)
TABLE 932
REST OF MIDDLE EAST: PHARMACEUTICAL EXCIPIENTS MARKET, BY FUNCTIONALITY, 2023–2030 (USD MILLION)
TABLE 933
REST OF MIDDLE EAST: PHARMACEUTICAL EXCIPIENTS MARKET, BY FORMULATION, 2023–2030 (USD MILLION)
TABLE 934
REST OF MIDDLE EAST: PHARMACEUTICAL EXCIPIENTS MARKET FOR ORAL FORMULATIONS, BY TYPE, 2023–2030 (USD MILLION)
TABLE 935
REST OF MIDDLE EAST: PHARMACEUTICAL EXCIPIENTS MARKET FOR CAPSULES, BY TYPE, 2023–2030 (USD MILLION)
TABLE 936
REST OF MIDDLE EAST: PHARMACEUTICAL EXCIPIENTS MARKET, BY FUNCTIONALITY APPLICATION, 2023–2030 (USD MILLION)
TABLE 937
AFRICA: KEY MACROECONOMIC INDICATORS
TABLE 938
AFRICA: PHARMACEUTICAL EXCIPIENTS MARKET, BY PRODUCT, 2023–2030 (USD MILLION)
TABLE 939
AFRICA: PHARMACEUTICAL EXCIPIENTS MARKET FOR ORGANIC CHEMICALS, BY TYPE, 2023–2030 (USD MILLION)
TABLE 940
AFRICA: PHARMACEUTICAL EXCIPIENTS MARKET FOR OLEOCHEMICALS, BY TYPE, 2023–2030 (USD MILLION)
TABLE 941
AFRICA: PHARMACEUTICAL EXCIPIENTS MARKET FOR CARBOHYDRATES, BY TYPE, 2023–2030 (USD MILLION)
TABLE 942
AFRICA: PHARMACEUTICAL EXCIPIENTS MARKET FOR SUGARS, BY TYPE, 2023–2030 (USD MILLION)
TABLE 943
AFRICA: PHARMACEUTICAL EXCIPIENTS MARKET FOR ACTUAL SUGARS, BY TYPE, 2023–2030 (USD MILLION)
TABLE 944
AFRICA: PHARMACEUTICAL EXCIPIENTS MARKET FOR SUGAR ALCOHOLS, BY TYPE, 2023–2030 (USD MILLION)
TABLE 945
AFRICA: PHARMACEUTICAL EXCIPIENTS MARKET FOR CELLULOSE, BY TYPE, 2023–2030 (USD MILLION)
TABLE 946
AFRICA: PHARMACEUTICAL EXCIPIENTS MARKET FOR STARCH, BY TYPE, 2023–2030 (USD MILLION)
TABLE 947
AFRICA: PHARMACEUTICAL EXCIPIENTS MARKET FOR PETROCHEMICALS, BY TYPE, 2023–2030 (USD MILLION)
TABLE 948
AFRICA: PHARMACEUTICAL EXCIPIENTS MARKET FOR GLYCOLS, BY TYPE, 2023–2030 (USD MILLION)
TABLE 949
AFRICA: PHARMACEUTICAL EXCIPIENTS MARKET FOR MINERAL HYDROCARBONS, BY TYPE, 2023–2030 (USD MILLION)
TABLE 950
AFRICA: PHARMACEUTICAL EXCIPIENTS MARKET FOR INORGANIC CHEMICALS, BY TYPE, 2023–2030 (USD MILLION)
TABLE 951
AFRICA: PHARMACEUTICAL EXCIPIENTS MARKET, BY FUNCTIONALITY, 2023–2030 (USD MILLION)
TABLE 952
AFRICA: PHARMACEUTICAL EXCIPIENTS MARKET, BY FORMULATION, 2023–2030 (USD MILLION)
TABLE 953
AFRICA: PHARMACEUTICAL EXCIPIENTS MARKET FOR ORAL FORMULATIONS, BY TYPE, 2023–2030 (USD MILLION)
TABLE 954
AFRICA: PHARMACEUTICAL EXCIPIENTS MARKET FOR CAPSULES, BY TYPE, 2023–2030 (USD MILLION)
TABLE 955
AFRICA: PHARMACEUTICAL EXCIPIENTS MARKET, BY FUNCTIONALITY APPLICATION, 2023–2030 (USD MILLION)
TABLE 956
OVERVIEW OF MAJOR STRATEGIES DEPLOYED BY KEY PLAYERS IN PHARMACEUTICAL EXCIPIENTS MARKET, 2022–2024
TABLE 957
PHARMACEUTICAL EXCIPIENTS MARKET: DEGREE OF COMPETITION
TABLE 958
PHARMACEUTICAL EXCIPIENTS MARKET: REGION FOOTPRINT
TABLE 959
PHARMACEUTICAL EXCIPIENTS MARKET: PRODUCT FOOTPRINT
TABLE 960
PHARMACEUTICAL EXCIPIENTS MARKET: FUNCTIONALITY FOOTPRINT
TABLE 961
PHARMACEUTICAL EXCIPIENTS MARKET: FUNCTIONALITY APPLICATION FOOTPRINT
TABLE 962
PHARMACEUTICAL EXCIPIENTS MARKET: DETAILED LIST OF KEY STARTUPS/SMES
TABLE 963
PHARMACEUTICAL EXCIPIENTS MARKET: COMPETITIVE BENCHMARKING OF KEY STARTUPS/SMES, 2024
TABLE 964
PHARMACEUTICAL EXCIPIENTS MARKET: PRODUCT LAUNCHES AND APPROVALS, JANUARY 2022–JUNE 2025
TABLE 965
PHARMACEUTICAL EXCIPIENTS MARKET: DEALS, JANUARY 2022–JUNE 2025
TABLE 966
PHARMACEUTICAL EXCIPIENTS MARKET: EXPANSIONS, JANUARY 2022–JUNE 2025
TABLE 967
DETAILS OF KEY EXPANSIONS
TABLE 968
INTERNATIONAL FLAVORS & FRAGRANCES INC.: COMPANY OVERVIEW
TABLE 969
INTERNATIONAL FLAVORS & FRAGRANCES INC.: PRODUCTS OFFERED
TABLE 970
INTERNATIONAL FLAVORS & FRAGRANCES INC.: DEALS, JANUARY 2022–JUNE 2025
TABLE 971
INTERNATIONAL FLAVORS & FRAGRANCES INC.: EXPANSIONS, JANUARY 2022–JUNE 2025
TABLE 972
ADM: COMPANY OVERVIEW
TABLE 973
ADM: PRODUCTS OFFERED
TABLE 974
ADM: DEALS, JANUARY 2022–JUNE 2025
TABLE 975
ROQUETTE FRÈRES: COMPANY OVERVIEW
TABLE 976
ROQUETTE FRÈRES: PRODUCTS OFFERED
TABLE 977
ROQUETTE FRÈRES: PRODUCT LAUNCHES AND APPROVALS, JANUARY 2022–JUNE 2025
TABLE 978
ROQUETTE FRÈRES: DEALS, JANUARY 2022–JUNE 2025
TABLE 979
BASF SE: COMPANY OVERVIEW
TABLE 980
BASF SE: PRODUCTS OFFERED
TABLE 981
BASF SE: DEALS, JANUARY 2022–JUNE 2025
TABLE 982
BASF SE: EXPANSIONS, JANUARY 2022–JUNE 2025
TABLE 983
EVONIK: COMPANY OVERVIEW
TABLE 984
EVONIK: PRODUCTS OFFERED
TABLE 985
EVONIK: EXPANSIONS, JANUARY 2022–JUNE 2025
TABLE 986
ASHLAND: COMPANY OVERVIEW
TABLE 987
ASHLAND: PRODUCTS OFFERED
TABLE 988
ASHLAND: PRODUCT LAUNCHES AND APPROVALS, JANUARY 2022–JUNE 2025
TABLE 989
KERRY GROUP PLC: COMPANY OVERVIEW
TABLE 990
KERRY GROUP PLC: PRODUCTS OFFERED
TABLE 991
KERRY GROUP PLC: DEALS, JANUARY 2022–JUNE 2025
TABLE 992
MERCK: COMPANY OVERVIEW
TABLE 993
MERCK: PRODUCTS OFFERED
TABLE 994
MERCK: DEALS, JANUARY 2022–JUNE 2025
TABLE 995
ASSOCIATED BRITISH FOODS PLC: COMPANY OVERVIEW
TABLE 996
ASSOCIATED BRITISH FOODS PLC: PRODUCTS OFFERED
TABLE 997
ASSOCIATED BRITISH FOODS PLC: DEALS, JANUARY 2022–JUNE 2025
TABLE 998
WACKER CHEMIE AG: COMPANY OVERVIEW
TABLE 999
WACKER CHEMIE AG: PRODUCTS OFFERED
TABLE 1000
AIR LIQUIDE: COMPANY OVERVIEW
TABLE 1001
AIR LIQUIDE: PRODUCTS OFFERED
TABLE 1002
AIR LIQUIDE: PRODUCT LAUNCHES AND APPROVALS, JANUARY 2022–JUNE 2025
TABLE 1003
DOW: COMPANY OVERVIEW
TABLE 1004
DOW: PRODUCTS OFFERED
TABLE 1005
BERKSHIRE HATHAWAY: COMPANY OVERVIEW
TABLE 1006
BERKSHIRE HATHAWAY: PRODUCTS OFFERED
TABLE 1007
BERKSHIRE HATHAWAY: PRODUCT LAUNCHES AND APPROVALS, JANUARY 2022–JUNE 2025
TABLE 1008
COLORCON, INC.: COMPANY OVERVIEW
TABLE 1009
COLORCON, INC.: PRODUCTS OFFERED
TABLE 1010
COLORCON, INC.: PRODUCT LAUNCHES AND APPROVALS, JANUARY 2022–JUNE 2025
TABLE 1011
COLORCON, INC.: DEALS, JANUARY 2022–JUNE 2025
TABLE 1012
COLORCON, INC.: EXPANSIONS, JANUARY 2022–JUNE 2025
TABLE 1013
DFE PHARMA: COMPANY OVERVIEW
TABLE 1014
DFE PHARMA: PRODUCTS OFFERED
TABLE 1015
DFE PHARMA: DEALS, JANUARY 2022–JUNE 2025
TABLE 1016
ACTYLIS: COMPANY OVERVIEW
TABLE 1017
ACTYLIS: PRODUCTS OFFERED
TABLE 1018
ACTYLIS: DEALS, JANUARY 2022–JUNE 2025
TABLE 1019
CRODA INTERNATIONAL PLC: COMPANY OVERVIEW
TABLE 1020
CRODA INTERNATIONAL PLC: PRODUCTS OFFERED
TABLE 1021
CRODA INTERNATIONAL PLC: DEALS, JANUARY 2022–JUNE 2025
TABLE 1022
CRODA INTERNATIONAL PLC: EXPANSIONS, JANUARY 2022–JUNE 2025
TABLE 1023
CHEMIE TRADE: COMPANY OVERVIEW
TABLE 1024
CHEMIE TRADE: PRODUCTS OFFERED
TABLE 1025
GATTEFOSSÉ: COMPANY OVERVIEW
TABLE 1026
GATTEFOSSÉ: PRODUCTS OFFERED
TABLE 1027
J. RETTENMAIER & SÖHNE GMBH + CO KG: COMPANY OVERVIEW
TABLE 1028
J. RETTENMAIER & SÖHNE GMBH + CO KG: PRODUCTS OFFERED
TABLE 1029
SHIN-ETSU CHEMICAL CO., LTD.: COMPANY OVERVIEW
TABLE 1030
SHIN-ETSU CHEMICAL CO., LTD.: PRODUCTS OFFERED
TABLE 1031
SHIN-ETSU CHEMICAL CO., LTD.: DEALS, JANUARY 2022–JUNE 2025
TABLE 1032
SHIN-ETSU CHEMICAL CO., LTD.: EXPANSIONS, JANUARY 2022–JUNE 2025
TABLE 1033
INNOPHOS: COMPANY OVERVIEW
TABLE 1034
MEGGLE GMBH & CO. KG: COMPANY OVERVIEW
TABLE 1035
FUJI CHEMICAL INDUSTRIES CO., LTD.: COMPANY OVERVIEW
TABLE 1036
COREL PHARMA CHEM: COMPANY OVERVIEW
TABLE 1037
BIOGRUND: COMPANY OVERVIEW
TABLE 1038
NITIKA PHARMACEUTICAL SPECIALTIES PVT. LTD.: COMPANY OVERVIEW
TABLE 1039
R.T. VANDERBILT HOLDING COMPANY, INC.: COMPANY OVERVIEW
TABLE 1040
BENEO: COMPANY OVERVIEW
TABLE 1041
SIAGACHI INDUSTRIES: COMPANY OVERVIEW
TABLE 1042
JH NANHANG LIFE SCIENCES CO., LTD.: COMPANY OVERVIEW
FIGURE 1
PHARMACEUTICAL EXCIPIENTS MARKET SEGMENTATION
FIGURE 2
PHARMACEUTICAL EXCIPIENTS REGIONAL SCOPE
FIGURE 3
PHARMACEUTICAL EXCIPIENTS MARKET: YEARS CONSIDERED
FIGURE 4
PHARMACEUTICAL EXCIPIENTS MARKET: RESEARCH DESIGN
FIGURE 5
PHARMACEUTICAL EXCIPIENTS MARKET: KEY DATA FROM SECONDARY SOURCES
FIGURE 6
PHARMACEUTICAL EXCIPIENTS MARKET: BREAKDOWN OF PRIMARY INTERVIEWS
FIGURE 7
PHARMACEUTICAL EXCIPIENTS MARKET ESTIMATION (SUPPLY-SIDE ANALYSIS), 2024
FIGURE 8
COMPANY REVENUE ANALYSIS-BASED ESTIMATION: BOTTOM-UP APPROACH, 2024
FIGURE 9
REVENUE SHARE ANALYSIS OF SANDOZ GROUP AG, 2024
FIGURE 10
PHARMACEUTICAL EXCIPIENTS MARKET SIZE VALIDATION FROM PRIMARY SOURCES
FIGURE 11
PHARMACEUTICAL EXCIPIENTS MARKET: TOP-DOWN APPROACH
FIGURE 12
PHARMACEUTICAL EXCIPIENTS MARKET: CAGR PROJECTIONS
FIGURE 13
PHARMACEUTICAL EXCIPIENTS MARKET: DATA TRIANGULATION
FIGURE 14
PHARMACEUTICAL EXCIPIENTS MARKET, BY PRODUCT, 2025 VS. 2030 (USD MILLION)
FIGURE 15
PHARMACEUTICAL EXCIPIENTS MARKET, BY FUNCTIONALITY, 2025 VS. 2030 (USD MILLION)
FIGURE 16
PHARMACEUTICAL EXCIPIENTS MARKET, BY FORMULATION, 2025 VS. 2030 (USD MILLION)
FIGURE 17
PHARMACEUTICAL EXCIPIENTS MARKET, BY FUNCTIONALITY APPLICATION, 2025 VS. 2030 (USD MILLION)
FIGURE 18
GEOGRAPHICAL SNAPSHOT OF PHARMACEUTICAL EXCIPIENTS MARKET
FIGURE 19
GROWING DEMAND FOR GENERICS AND PHARMACEUTICAL PRODUCTS TO DRIVE MARKET
FIGURE 20
ORGANIC CHEMICALS SEGMENT AND US TO LEAD NORTH AMERICAN MARKET IN 2025
FIGURE 21
GERMANY TO REGISTER HIGHEST GROWTH DURING FORECAST PERIOD
FIGURE 22
EMERGING MARKETS TO REGISTER HIGHER GROWTH DURING FORECAST PERIOD
FIGURE 23
PHARMACEUTICAL EXCIPIENTS MARKET: DRIVERS, RESTRAINTS, OPPORTUNITIES, AND CHALLENGES
FIGURE 24
GLOBAL PHARMACEUTICAL R&D SPEND, 2018–2028
FIGURE 25
REVENUE SHIFT AND NEW POCKETS FOR PHARMACEUTICAL EXCIPIENT PROVIDERS
FIGURE 26
INDICATIVE PRICING ANALYSIS EXCIPIENT PRODUCTS, 2024
FIGURE 27
INDICATIVE PRICING ANALYSIS OF EXCIPIENT PRODUCTS, BY REGION, 2024
FIGURE 28
PHARMACEUTICAL EXCIPIENTS MARKET: VALUE CHAIN ANALYSIS
FIGURE 29
PHARMACEUTICAL EXCIPIENTS MARKET: SUPPLY CHAIN ANALYSIS
FIGURE 30
PHARMACEUTICAL EXCIPIENTS MARKET: ECOSYSTEM ANALYSIS
FIGURE 31
PHARMACEUTICAL EXCIPIENTS MARKET: INVESTMENT AND FUNDING SCENARIO, 2022–2024
FIGURE 32
PHARMACEUTICAL EXCIPIENTS MARKET: PATENT ANALYSIS, JANUARY 2014–DECEMBER 2024
FIGURE 33
PHARMACEUTICAL EXCIPIENTS MARKET: PORTER’S FIVE FORCES ANALYSIS
FIGURE 34
INFLUENCE OF KEY STAKEHOLDERS IN BUYING PROCESS, BY PRODUCT
FIGURE 35
KEY BUYING CRITERIA, BY END USER
FIGURE 36
PHARMACEUTICAL EXCIPIENTS MARKET: AI USE CASES
FIGURE 37
EUROPE: PHARMACEUTICAL EXCIPIENTS MARKET SNAPSHOT
FIGURE 38
ASIA PACIFIC: PHARMACEUTICAL EXCIPIENTS MARKET SNAPSHOT
FIGURE 39
REVENUE ANALYSIS OF KEY PLAYERS, 2020–2024 (USD MILLION)
FIGURE 40
MARKET SHARE ANALYSIS OF KEY PLAYERS IN PHARMACEUTICAL EXCIPIENTS MARKET, 2024
FIGURE 41
EV/EBITDA OF KEY VENDORS
FIGURE 42
YEAR-TO-DATE (YTD) PRICE TOTAL RETURN AND 5-YEAR STOCK BETA OF KEY VENDORS
FIGURE 43
PHARMACEUTICAL EXCIPIENTS MARKET: BRAND/PRODUCT COMPARISON
FIGURE 44
PHARMACEUTICAL EXCIPIENTS MARKET: COMPANY EVALUATION MATRIX (KEY PLAYERS), 2024
FIGURE 45
PHARMACEUTICAL EXCIPIENTS MARKET: COMPANY FOOTPRINT
FIGURE 46
PHARMACEUTICAL EXCIPIENTS MARKET: COMPANY EVALUATION MATRIX (STARTUPS/SMES), 2024
FIGURE 47
INTERNATIONAL FLAVORS & FRAGRANCES INC.: COMPANY SNAPSHOT (2024)
FIGURE 48
ADM: COMPANY SNAPSHOT (2024)
FIGURE 49
ROQUETTE FRÈRES: COMPANY SNAPSHOT (2024)
FIGURE 50
BASF SE: COMPANY SNAPSHOT (2024)
FIGURE 51
EVONIK: COMPANY SNAPSHOT (2024)
FIGURE 52
ASHLAND: COMPANY SNAPSHOT (2024)
FIGURE 53
KERRY GROUP PLC: COMPANY SNAPSHOT (2024)
FIGURE 54
MERCK: COMPANY SNAPSHOT (2024)
FIGURE 55
ASSOCIATED BRITISH FOODS PLC: COMPANY SNAPSHOT (2024)
FIGURE 56
WACKER CHEMIE AG: COMPANY SNAPSHOT (2024)
FIGURE 57
AIR LIQUIDE: COMPANY SNAPSHOT (2024)
FIGURE 58
DOW: COMPANY SNAPSHOT (2024)
FIGURE 59
BERKSHIRE HATHAWAY: COMPANY SNAPSHOT (2024)
FIGURE 60
CRODA INTERNATIONAL PLC: COMPANY SNAPSHOT (2024)
FIGURE 61
SHIN-ETSU CHEMICAL CO., LTD.: COMPANY SNAPSHOT (2024)


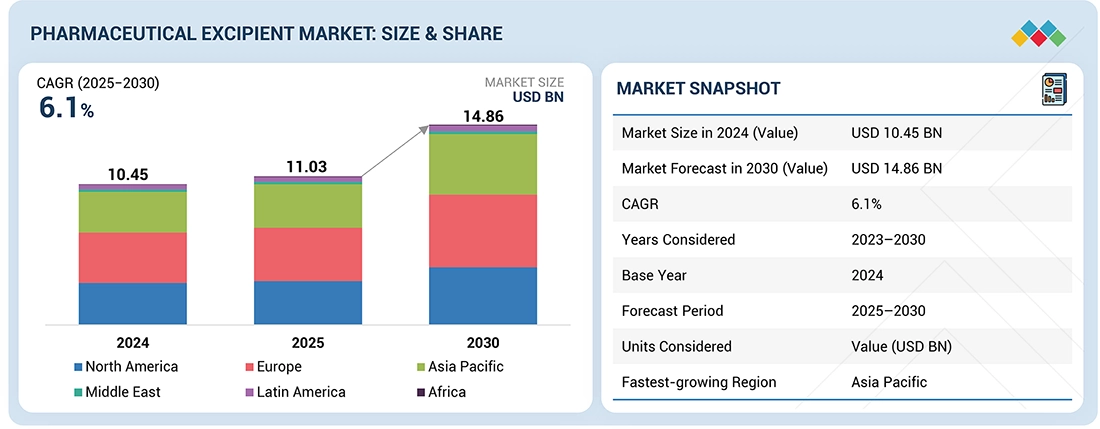
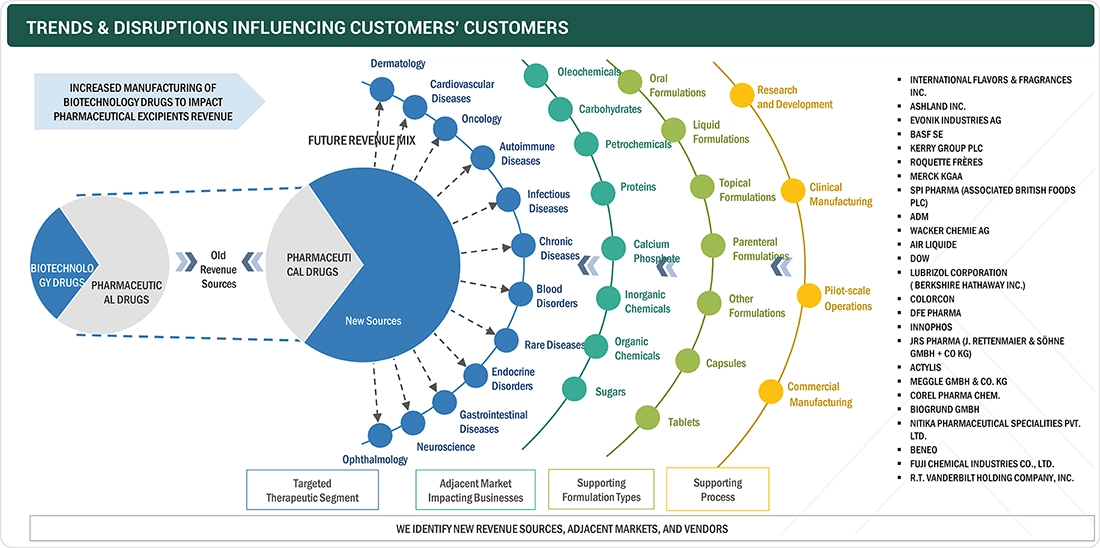


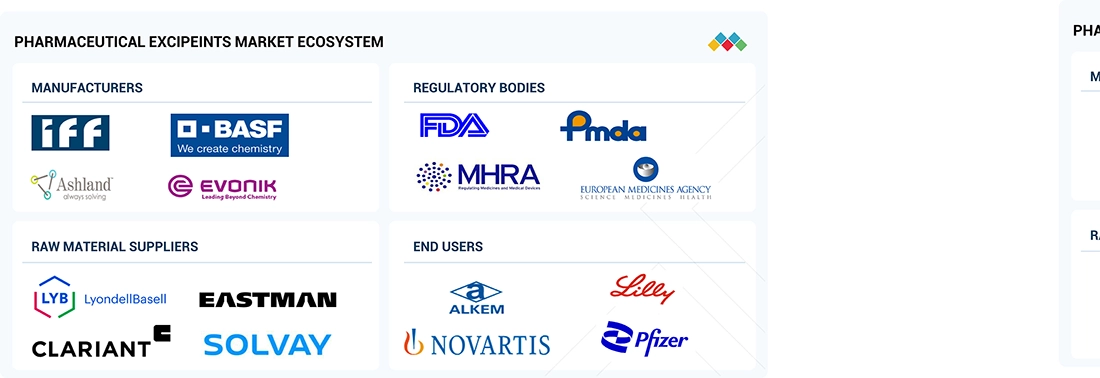
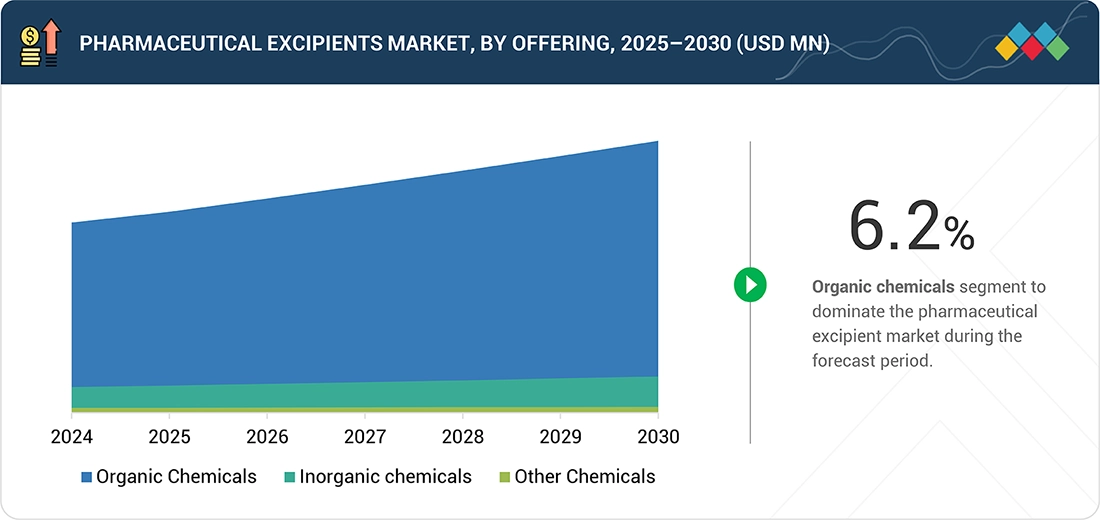
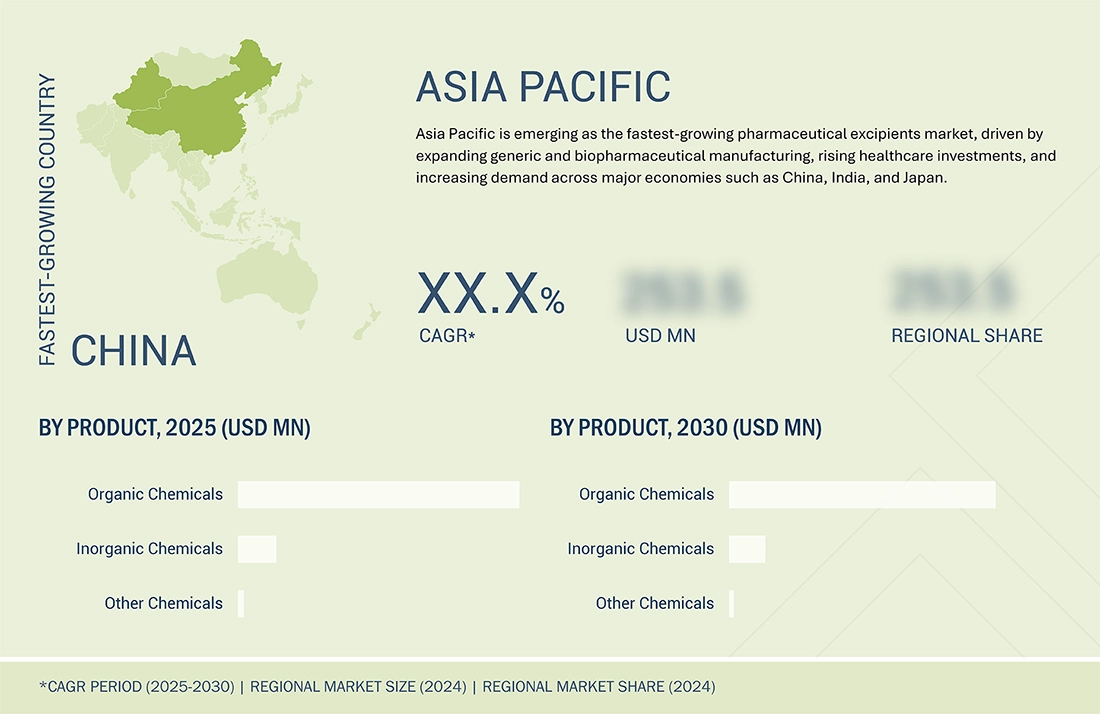
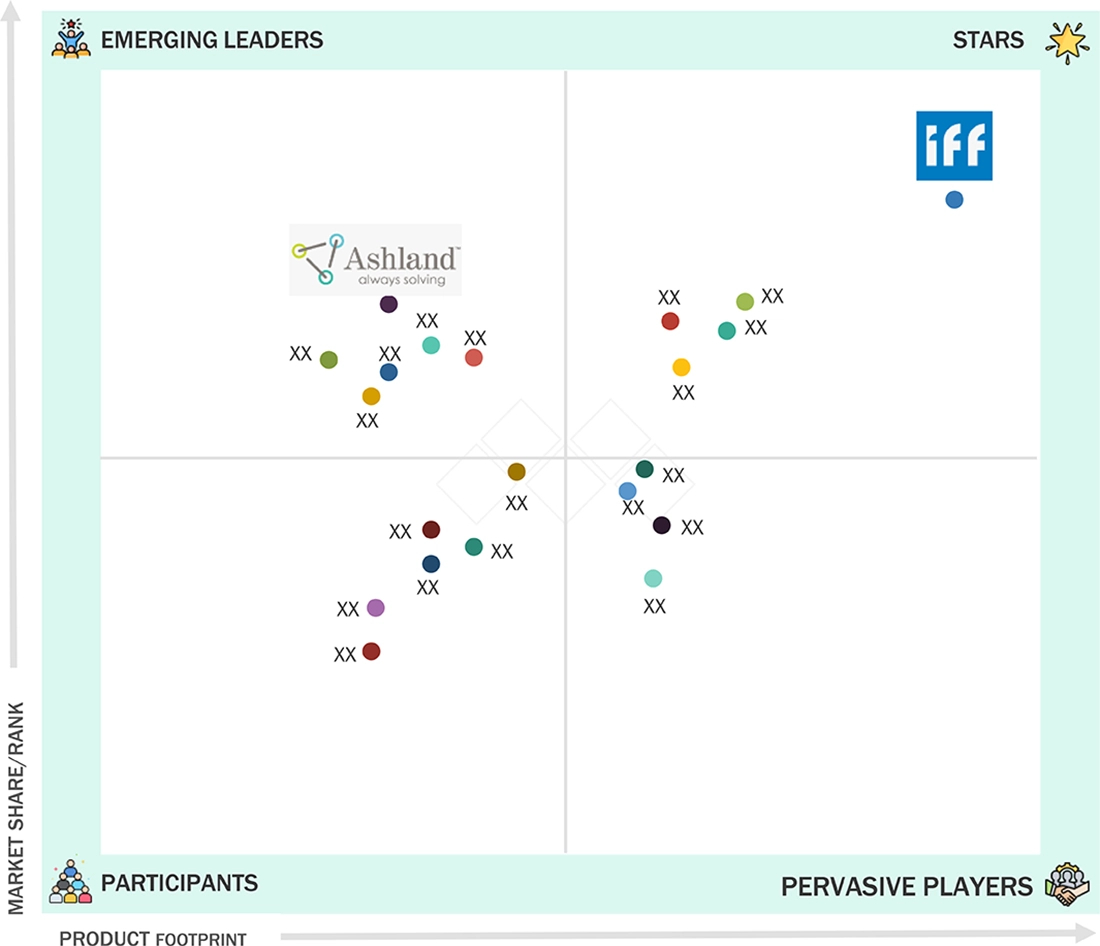
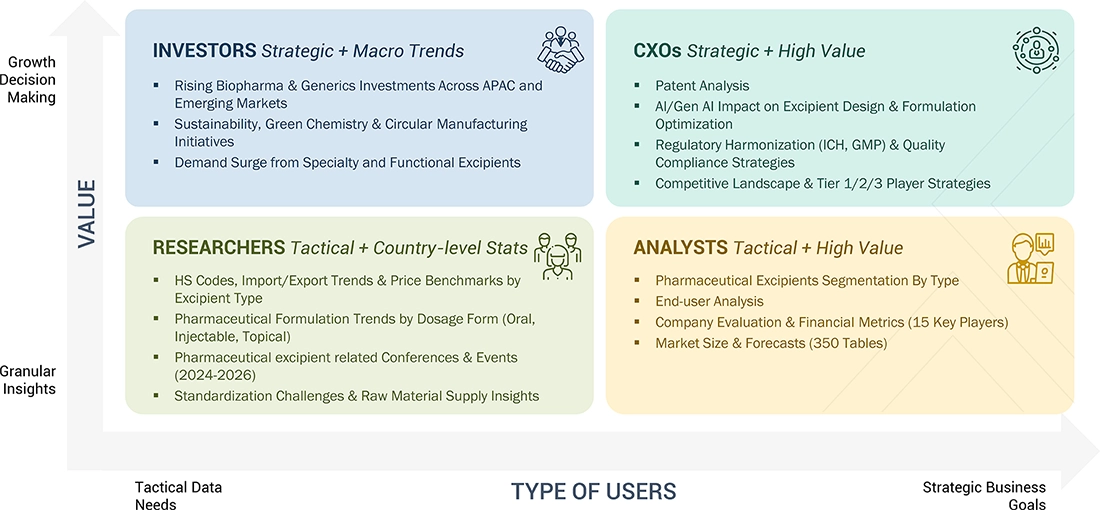
 Exclusive indicates content/data unique to MarketsandMarkets and not available with any competitors.


MnM Analyst
Jul, 2019
Polyethylene oxide (PEO) is more commonly known as Polyethylene glycol (PEG) or poly(oxyethylene). The market for PEG has been provided under Section 7.2.3.1.1 of the Pharmaceutical Excipients Market report..
User
Jul, 2019
This report does not list Polyethylene Oxide..
Nathan
Jun, 2026
After reviewing the Pharmaceutical Excipients Market report, I noticed how formulation complexity in modern drug development is increasing reliance on specialized excipients to enhance stability and bioavailability..
Grace
Jun, 2026
From a manufacturing perspective, the Pharmaceutical Excipients Market highlights the importance of consistent quality and regulatory compliance, especially as suppliers become integral partners in the drug development process..
Aaron
Jun, 2026
Looking at the broader industry outlook, my takeaway from the Pharmaceutical Excipients Market is that demand will continue to rise with the growth of generics and novel drug delivery systems requiring more advanced excipient functionalities..
Russell
Mar, 2022
Which region claims the largest share of Global Pharmaceutical Excipients Market?.
Bobby
Mar, 2022
How the leading companies are expecting to retain their position on the Global Pharmaceutical Excipients Market?.