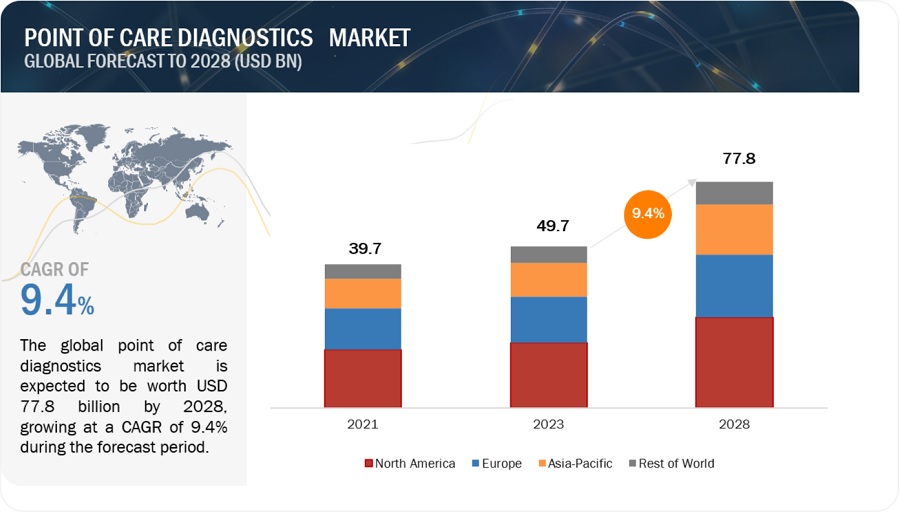
[370 Pages Report] The global point of care & rapid diagnostics market is expected to reach USD 72.0 billion by 2027 from an estimated USD 43.2 billion in 2022, at a CAGR of 10.8% from 2022 to 2027. The growth of the global Point of Care diagnostics market can be attributed to factors such as increasing prevalence of respiratory diseases (such as COVID-19 and influenza) across the globe, and improved access to point-of-care devices through online platforms are some of the other key factors likely to drive the long-term growth of the point-of-care diagnostics market.
To know about the assumptions considered for the study, Request for Free Sample Report
The outbreak of COVID-19 has expedited the global demand for diagnostic kits to rapidly detect the disease. However, countries across the globe are facing a severe shortage of laboratory-based molecular assays. Thus, many players are focusing on increasing the supply of tests worldwide.
The point-of-care diagnostics market will witness significant growth in 2022, owing to the increasing usage of POC tests that can rapidly diagnose COVID-19. The need for speedy diagnostic results has made point-of-care testing a vital diagnostic tool. The rapidly growing number of COVID-19 cases and the growing pressure on governments to improve patient management have boosted the demand for rapid antigen testing kits that can be effectively used in point-of-care settings.
The increasing prevalence of other respiratory illnesses across the globe, the shift towards decentralized diagnostics, and improved access to point-of-care devices through online platforms are some of the other key factors likely to drive the long-term growth of the point-of-care diagnostics market.
POC tests can greatly improve the management of infectious diseases, especially in developing countries where access to timely medical care is a challenge and the healthcare infrastructure is antiquated and sparse. According to UNAIDS, around 20.6 million people were living with HIV in East and Southern Africa in 2018. In 2019, 20,000 new HIV cases were registered in the Middle East and North Africa (Source: UNAIDS Data 2020). In the Asia Pacific, an estimated 5.8 million people were suffering from HIV in 2019, led by India and China. According to UNAIDS, in 2019, approximately 2.1 million people in India were infected with HIV. The high prevalence of HIV is likely to boost the demand for point-of-care diagnostics, further accelerating the treatment of HIV infection.
The high prevalence of infectious diseases, coupled with the inadequate healthcare infrastructural facilities in developing countries, is expected to drive the adoption of POC testing.
The pricing pressure due to reimbursement cuts and lack of sufficient budgets affects the growth of the global POC diagnostics market. In 2013, the US government passed a healthcare reform bill, according to which manufacturers must pay a heavy 2.3% annual excise tax on medical devices. Similarly, France has focused on medical devices for cost containment to recover from the recession. The 2013 French budget included price cuts of a total of USD 157.6 million (EUR 115 million) in the medical sector, which comprises savings worth USD 102.8 million (EUR 75 million) from the ambulatory care sector and USD 54.8 million (EUR 40 million) from hospitals.
In France, all the cost of patient care is rolled out into one prospective payment under the Diagnosis Related Group (DRG) system, making reimbursement a negligible factor. For instance, in the country, the reimbursement for diabetes technologies in outpatient settings is based on a tariff system. Reimbursable products and services, along with their respective tariffs, are added to the list of reimbursed products and services (LPPR). Blood glucose monitoring strips are reimbursed based on a single “generic” tariff, as French payers do not see the relevant difference in the various prices of BGM.
In India, the medical devices industry urged the government to fix an MRP on imported devices shipped to the country. According to the Association of the Indian Medical Device Industry (AIMED), POC testing devices are overpriced and do not have a fixed MRP (on imported devices) as this cost includes the commission of hospital pharmacies, distributors, and traders. Due to such practices, the high cost of the product is passed to patients with the added burden of a lack of appropriate reimbursement facilities.
Globally, expenditure on general-use medical devices is reported to be stagnating due to a decrease in the number of healthcare products eligible for reimbursement. These factors together are increasing the pressure on the global medical devices industry. Manufacturers are thus finding it challenging to support prices and preclude margin erosion as competition intensifies. This is expected to pose a key challenge to the growth of the global POC diagnostics market in the coming five years.
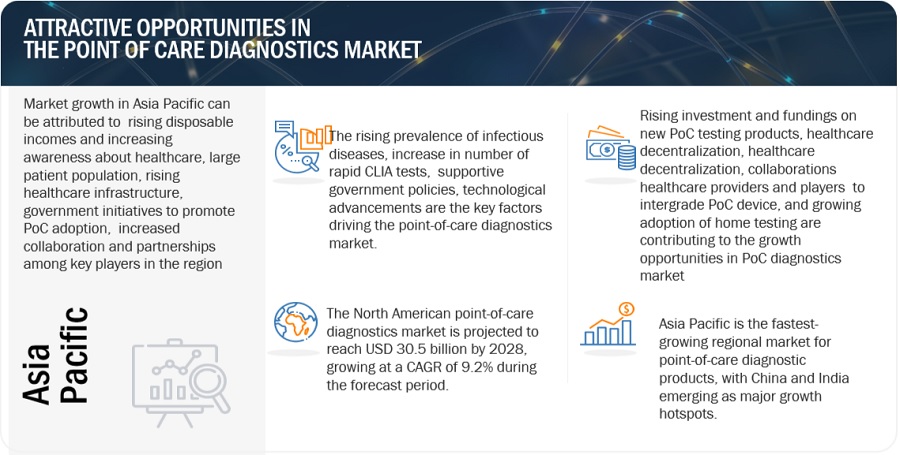
Emerging markets such as China, India, Brazil, and Mexico are expected to offer significant growth opportunities for players operating in the POC diagnostics market. This is primarily due to the high and growing prevalence of infectious and lifestyle diseases in these countries. Globally, China has the highest number of diabetes patients, with around 114 million people suffering from diabetes in the country in 2017. Similarly, in emerging countries such as Brazil and India, the prevalence of diabetes, CVDs, and HIV/AIDS is very high. In India, heart diseases accounted for 28% of all deaths in 2016, or ~2.8 million people; this is projected to reach ~4.8 million by 2020 (Source: CCDC, India).
To meet the increasing demand for POC diagnostics in emerging markets, manufacturers focus on acquiring or entering into agreements and partnerships with regional/domestic players for product distribution and manufacturing. Some developments in this regard have been listed below:
Regulatory policies in the Asia Pacific are more adaptive and business-friendly due to less stringent regulations and data requirements than the North American and European markets. Also, the increasing competition in mature markets will compel POC testing manufacturers to shift focus to emerging markets across the APAC and LATAM.
POC test results lack proper alignment with central lab methods due to a large number of pre- and post-analytical errors. Pre-analytical errors for POC testing include unsuitable indications for the performance of the test, inappropriate sampling times and techniques, lack of information about patient conditions, and other factors such as fasting before functional tests or variations in posture/position during similar tests. On the other hand, post-analytical errors include inadequate technical validation, false assignment of results, and errors in data storage.
POC testing is often conducted in emergency situations to facilitate rapid clinical decision-making. In many cases, these tests are carried out by nurses or clinical team members and not by physicians. Such situations can lead to inappropriate order and result documentation. These issues can potentially lead to erroneous diagnoses and affect the quality of care provided to patients. Considering such issues, patients and doctors can decide not to opt for POC testing. This is one of the key challenges to the greater acceptance of POC testing. Furthermore, there are certain disadvantages associated with POC testing over central lab methods. These include:
As a result of these disadvantages, POC testing is largely restricted to automatically measurable parameters and cannot completely replace central laboratory methods.
To know about the assumptions considered for the study, download the pdf brochure
Glucose monitoring products are used to continuously monitor and track glucose levels in the body, which also provides information regarding the amount of insulin being released. The use of such monitoring devices offers better glucose control and enables accurate treatment decisions. POC glucose monitoring kits make use of small amounts of blood (usually through a finger prick) for analyzing results, making them less invasive as compared to lab tests. These kits can also be easily used by elderly patients. Glucose monitoring kits also help patients with type I and type II diabetes to monitor their glucose levels and prevent complications.
Market growth can largely be attributed to the growing global prevalence of diabetes, ongoing technological advancements in blood glucose self-monitoring devices, and growing patient awareness about POC testing. The IDF Diabetes Atlas estimates that the number of people living with diabetes will increase from 425 million in 2017 to 642 million by 2040; the majority will be under the age of 80 years and from low- and middle-income countries. In addition, the IDF Atlas estimates ~352 million people globally to have pre-diabetes; this is estimated to rise to 531 million by 2045.
The growth potential of this market has prompted a number of companies to focus on developing innovative self-monitoring glucose meters. In June 2018, Dexcom, Inc. (US) launched the Dexcom G6 CGM System, a continuous glucose monitoring system that uses an app to provide real-time glucose data and a small sensor under the skin, instead of conventional finger pricking. Other innovative products include Medtronic’s Guardian Sensor 3—a diagnostic chip that automatically monitors health, Roche’s Accu-Chek Blood Glucose Monitoring System with wireless connectivity and app support, and LabStyle Innovations’ Dario Blood Glucose Monitoring System.
On the other hand, reimbursement cuts are a major factor impacting the market growth. For example, in Germany, the Federal Joint Committee (Gemeinsamer Bundesausschuss) decided to discontinue reimbursement (through the Statutory Health Insurance) for blood sugar strips for patients suffering from type 2 diabetes and those not treated with insulin.
Lateral flow assays (LFA) or lateral flow immunochromatographic assays are simple devices used to detect the presence or absence of target analytes in samples. These assays help in detecting and quantifying analytes in complex mixtures and provide results within 30 minutes after the sample is placed on the device.
In the past few years, the POC diagnostics market for LFA has grown significantly due to the increasing adoption of LFA testing products in home care settings. Companies are increasingly focusing on the development of innovative LFA-based POC devices for confirmation of pregnancy (using hCG levels) and ovulation, screening for infectious diseases and drugs of abuse, and measurement of protein markers in the blood to aid rapid clinical diagnostics during life-threatening events (such as heart attacks, stroke, and deep-vein thrombosis). Gold nanoparticle-based LFA, carbon nanomaterial-based LFA, magnetic nanomaterials-based LFA, and optical reader-based LFA are some of the commercially available LFA platforms, whereas smartphone readers for LFA are emerging platforms for LFA POC diagnostics. Quantum Dots are an example of recent progress in nanomaterials and have become an alternative to organic fluorescent dyes as they are less prone to metabolic degradation and have a broad UV excitation, greater absorption coefficients, and higher photostability.
Lateral flow assay-based POC tests are increasingly being adopted as a replacement for lengthy, conventional laboratory procedures. POC diagnostic tests require less complex infrastructure and training, owing to which the cost of these tests is lower as compared to conventional laboratory diagnostic procedures. However, regulatory bodies often need the confirmation of results by using an independent method, which makes LFA tests suitable for only primary screening at the point of care. Additionally, technological improvements may affect the apparatus cost and analysis duration of the test, which can hamper the adoption of this platform in the coming years.
The major companies providing lateral flow assays for POC diagnostics include GenPrime (US), Quidel Corporation (US), Alere, Inc. (US), and Becton, Dickinson and Company (US).
The major end users of POC diagnostics include clinical laboratories; ambulatory care facilities and physicians’ offices; pharmacies, retail clinics, and E-commerce platforms; hospitals, critical care centers, and urgent care centers; home care & self-testing; and other end users. The home care and self-testing segment is projected to register the highest CAGR during the forecast period, owing to the increasing prevalence of chronic diseases (requiring long-term care and frequent monitoring), growing awareness about home care, and the increasing availability of user-friendly and advanced POC diagnostic products.
The recent outbreak of COVID-19 positively impacted the clinical laboratories segment, as the pandemic has boosted clinical laboratory testing services. Based on the study published by the National Center for Biotechnology Information in July 2020, the use of clinical diagnostics, including molecular and serological testing approaches for severe acute respiratory syndrome‐coronavirus 2 (SARS‐CoV‐2) testing, has increased. The increasing number of COVID-19 variants is further likely to drive the growth of the clinical laboratories segment. In February 2021, Thermo Fisher Scientific launched the Towpaths COVID–19 HT Kit for use on its automated amplitude platform to increase its COVID-19 testing capacity by combining Thermo Fisher’s extraction and real-time PCR instruments with liquid handling products from Tecan Group. Increased public-private partnerships to detect and isolate patients of new COVID variants is likely to boost the growth of this segment over the forecast period.
The global point-of-care diagnostics market is segmented into North America, Europe, Asia Pacific, Latin America, and the Middle East & Africa. The Latin American market includes Brazil, Mexico, and other Latin American countries such as Argentina, Chile, Peru, Colombia, Venezuela, and Bolivia, among others. Latin American region is projected to register the highest growth during the forecast period due to government efforts to increase awareness about the early detection of diseases and regular health check-ups, further promoting point-of-care devices. Moreover, increasing healthcare expenditures, increasing the number of hospitals and clinical diagnostic laboratories, and increasing collaborations among players in the region are also expected to drive market growth.
The Latin American market includes Brazil, Mexico, and other Latin American countries such as Argentina, Chile, Peru, Colombia, Venezuela, and Bolivia. The rapid growth of the geriatric population in several Latin American countries is one of the major factors supporting the growth of the PoC diagnostics market in Latin America. In addition, the incidence of several infectious diseases, such as malaria, flu, and AIDS, is increasing in this region. This, in turn, is creating a robust demand for infectious disease diagnostics.
The Latin American market is projected to register the highest growth during the forecast period due to government efforts to increase awareness about the early detection of diseases and regular health check-ups, further promoting point-of-care devices. Moreover, increasing healthcare expenditures, growing number of hospitals and clinical diagnostic laboratories, and increasing collaborations among players in the region are also expected to drive market growth.
Prominent players in the point-of-care diagnostics market include Abbott Laboratories (US), Siemens Healthineers AG (Germany), Quidel Corporation (US), F. Hoffman-La Roche Ltd. (Switzerland), Danaher Corporation (US), Becton, Dickinson and Company (US), Chembio Diagnostics (US), EKF Diagnostics (UK), Trinity Biotech plc (Ireland), Instrumentation Laboratory (a Werfen Company) (US), Nova Biomedical (US), PTS Diagnostics (US), Sekisui Diagnostics (US), Thermo Fisher Scientific (US), and bioMérieux S.A. (France).
Abbott Laboratories is the leading player in the point-of-care diagnostics market. Its strong focus on strengthening its brand presence, continuous investments in R&D, broad customer base, and strong geographical foothold are key factors contributing to its leading position in this market. To expand its global diagnostics presence and leadership in the point-of-care diagnostics market, the company acquired Alere, Inc. in October 2017, gaining access to new channels and Alere’s high-quality products.
Abbott is also engaged in R&D to introduce novel products and improve its existing product line and processes. In 2019, the company invested ~USD 2.4 billion in R&D activities. Furthermore, the POC diagnostics business witnessed expansion in domestic and emerging markets through agreements and collaborations with other players. All these strategies are expected to help Abbott witness significant growth in the point-of-care diagnostics market during the forecast period.
Report Metric |
Details |
Market size available for years |
2020–2027 |
Base year considered |
2021 |
Forecast period |
2022–2027 |
Forecast units |
Value (USD Billion) |
Segments covered |
Product Type, Platform, Mode of Purchase, End User, and Region |
Geographies covered |
North America, Europe, Asia Pacific, Latin America, and the Middle East & Africa |
Companies covered |
Prominent players in the point-of-care diagnostics market include Abbott Laboratories (US), Siemens Healthineers AG (Germany), Quidel Corporation (US), F. Hoffman-La Roche Ltd. (Switzerland), Danaher Corporation (US), Becton, Dickinson and Company (US), Chembio Diagnostics (US), EKF Diagnostics (UK), Trinity Biotech plc (Ireland), Instrumentation Laboratory (a Werfen Company) (US), Nova Biomedical (US), PTS Diagnostics (US), Sekisui Diagnostics (US), Thermo Fisher Scientific (US), and bioMérieux S.A. (France). Other players in the market include DiaSorin S.p.A (Italy), AccuBioTech Co., Ltd. (China), Meridian Bioscience (US), Biocartis Bioscience (Europe), GeneSTAT Molecular Diagnostics, LLC (US), Terumo Corporation (Japan), Grifols, S.A (Spain), ACON Laboratories, Inc. (US), A. Menarini Diagnostics s.r.l (Italy), OraSure Technologies, Inc. (US), Mankind Pharma (India), LifeScan IP Holdings, LLC (US), Ascensia Diabetes Care Holding AG (Switzerland), Fluxergy (US), and Precision Biosensor Inc. (South Korea). |
In this report, the point of care diagnostics market is segmented based on product type, platform, mode of purchase, end user and region.
What is the expected addressable market value of global Point of Care diagnostics market over a 5-year period?
The global point of care diagnostics market is expected to reach USD 72.0 billion by 2027 from an estimated USD 43.2 billion in 2022, at a CAGR of 10.8% from 2022 to 2027.
Which segment based on product type is expected to garner the highest traction within the Point of Care diagnostics market?
Based on product type, the glucose monitoring segment commanded the largest share of the Point of Care diagnostics market in 2021.
What are the strategies adopted by the top market players to penetrate emerging regions?
The key growth strategies adopted by the top players in this market include product launches and approvals; agreements and partnerships; and acquisitions.
What are the major factors expected to limit the growth of the Point of Care diagnostics market?
Issues related to pricing pressure owing to reimbursement cuts and budget constraints are expected to hinder the growth of the point of care diagnostics market during the forecast market.
What is the adoption pattern for Point of Care across major healthcare markets?
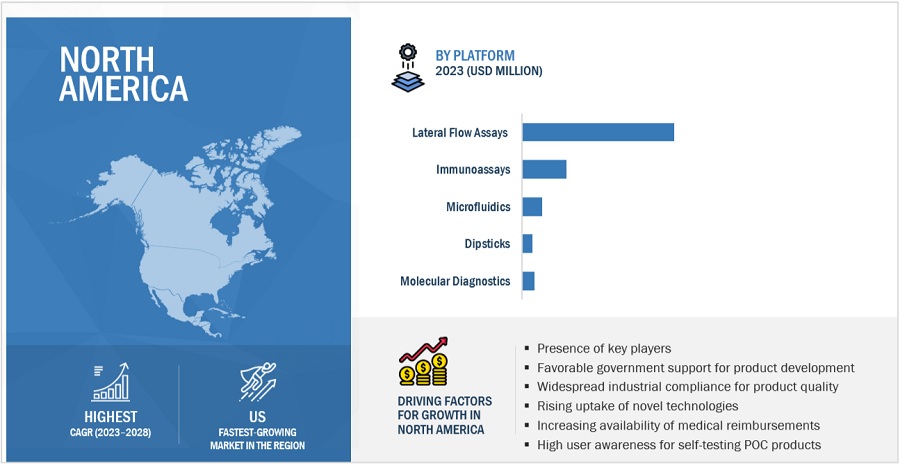
North America dominated the Point of Care diagnostics market with the largest market share in 2021. Factors such as the growing prevalence of lifestyle diseases, the increasing number of product approvals, and government initiatives to support the wider adoption of POC diagnostics are driving market growth in North America. .
To speak to our analyst for a discussion on the above findings, click Speak to Analyst
TABLE OF CONTENTS
1 INTRODUCTION (Page No. - 39)
1.1 OBJECTIVES OF THE STUDY
1.2 MARKET DEFINITION
1.2.1 INCLUSIONS & EXCLUSIONS OF THE STUDY
1.3 MARKET SCOPE
1.3.1 YEARS CONSIDERED FOR THE STUDY
1.4 CURRENCY USED FOR THE STUDY
TABLE 1 STANDARD CURRENCY CONVERSION RATES
1.5 LIMITATIONS
1.6 KEY MARKET STAKEHOLDERS
1.7 SUMMARY OF CHANGES
2 RESEARCH METHODOLOGY (Page No. - 45)
2.1 RESEARCH DATA
FIGURE 1 RESEARCH DESIGN
2.1.1 SECONDARY DATA
2.1.1.1 Indicative list of secondary sources
2.1.2 PRIMARY DATA
2.1.2.1 Key industry insights
FIGURE 2 BREAKDOWN OF PRIMARY INTERVIEWS: BY COMPANY TYPE, DESIGNATION, AND REGION
FIGURE 3 RESEARCH METHODOLOGY: HYPOTHESIS BUILDING
2.2 MARKET ESTIMATION METHODOLOGY
2.2.1 REVENUE MAPPING-BASED MARKET ESTIMATION
2.2.2 END-USER-BASED MARKET ESTIMATION
FIGURE 4 MARKET SIZE ESTIMATION METHODOLOGY: POINT-OF-CARE DIAGNOSTICS MARKET
FIGURE 5 CAGR PROJECTIONS: SUPPLY-SIDE ANALYSIS
2.2.3 PRIMARY RESEARCH VALIDATION
2.3 COVID-19 HEALTH ASSESSMENT
2.4 COVID-19 ECONOMIC ASSESSMENT
2.5 ASSESSMENT OF THE IMPACT OF COVID-19 ON THE ECONOMIC SCENARIO
FIGURE 6 CRITERIA IMPACTING THE GLOBAL ECONOMY
FIGURE 7 RECOVERY SCENARIO OF THE GLOBAL ECONOMY
2.6 DATA TRIANGULATION
FIGURE 8 DATA TRIANGULATION METHODOLOGY
2.7 RESEARCH ASSUMPTIONS & LIMITATIONS
2.7.1 ASSUMPTIONS FOR THE STUDY
2.8 RESEARCH LIMITATIONS
3 EXECUTIVE SUMMARY (Page No. - 59)
FIGURE 9 POINT-OF-CARE DIAGNOSTICS MARKET, BY PRODUCT, 2021 VS. 2027 (USD MILLION)
FIGURE 10 POINT-OF-CARE DIAGNOSTICS MARKET, BY PLATFORM, 2021 VS. 2027 (USD MILLION)
FIGURE 11 POINT-OF-CARE DIAGNOSTICS MARKET, BY MODE OF PURCHASE, 2021 VS. 2027 (USD MILLION)
FIGURE 12 POINT-OF-CARE DIAGNOSTICS MARKET, BY END USER, 2021 VS. 2027 (USD MILLION)
FIGURE 13 GEOGRAPHICAL SNAPSHOT OF THE POINT-OF-CARE DIAGNOSTICS MARKET
4 PREMIUM INSIGHTS (Page No. - 63)
4.1 POINT-OF-CARE DIAGNOSTICS MARKET OVERVIEW
FIGURE 14 RISING PREVALENCE OF TARGET DISEASES TO DRIVE MARKET GROWTH
4.2 IMPACT OF COVID-19 ON THE GLOBAL POINT-OF-CARE DIAGNOSTICS MARKET (USD MILLION)
FIGURE 15 MARKET TO WITNESS A RISE DURING 2020–2021 OWING TO THE PANDEMIC
4.3 POINT-OF-CARE DIAGNOSTICS MARKET SHARE, BY MODE OF PURCHASE (2021)
FIGURE 16 OTC TESTING PRODUCTS DOMINATED THE POINT-OF-CARE DIAGNOSTICS MARKET IN 2021
4.4 ASIA PACIFIC: POINT-OF-CARE DIAGNOSTICS MARKET, BY END USER AND COUNTRY (2021)
FIGURE 17 HOME CARE & SELF-TESTING IS THE LARGEST END-USER SEGMENT OF THE APAC POC DIAGNOSTICS MARKET
4.5 POINT-OF-CARE DIAGNOSTICS MARKET, BY REGION
FIGURE 18 LATIN AMERICA TO REGISTER THE HIGHEST GROWTH DURING THE FORECAST PERIOD (2022–2027)
5 MARKET OVERVIEW (Page No. - 67)
5.1 INTRODUCTION
5.2 MARKET DYNAMICS
FIGURE 19 POINT-OF-CARE DIAGNOSTICS MARKET: DRIVERS, RESTRAINTS, OPPORTUNITIES, AND CHALLENGES
5.2.1 DRIVERS
5.2.1.1 High prevalence of infectious diseases
5.2.1.2 Increasing incidence of target conditions
5.2.1.3 Supportive government policies
5.2.1.4 Dearth of skilled laboratory technicians
5.2.1.5 Rising number of CLIA-waived POC tests
TABLE 2 RECENT WAIVERS FOR MARKET PRODUCTS
5.2.2 RESTRAINTS
5.2.2.1 Pricing pressure owing to reimbursement cuts and budget constraints
5.2.2.2 Stringent regulatory policies
5.2.3 OPPORTUNITIES
5.2.3.1 Emerging markets
5.2.3.2 Healthcare decentralization
5.2.3.3 Increasing provider awareness about novel technologies
5.2.3.4 POC tests with multiplexing capabilities
5.2.3.5 Growing investments and funding for product development
5.2.4 CHALLENGES
5.2.4.1 Lack of alignment with definitive central lab methods
5.2.4.2 Inadequate adoption of POC devices in professional settings
5.2.4.3 Reluctance to change existing diagnostic practices
5.2.4.4 Premium pricing of novel platforms
5.3 TECHNOLOGY ANALYSIS: EMERGING POINT-OF-CARE APPLICATIONS
5.3.1 SEPSIS BIOMARKERS
5.3.2 STROKE/CARDIAC MARKERS
5.3.3 THYROID TESTING
5.3.4 DNA TESTING
5.3.5 ENDOCRINE TESTING
5.3.6 RESPIRATORY DIAGNOSTICS
5.4 REGULATORY LANDSCAPE
5.5 INDUSTRY TRENDS RELATED TO COVID-19
5.6 VALUE CHAIN ANALYSIS
FIGURE 20 VALUE CHAIN ANALYSIS—MAXIMUM VALUE IS ADDED DURING THE REGULATION AND DISTRIBUTION STAGES
5.7 SUPPLY CHAIN ANALYSIS
5.7.1 PROMINENT COMPANIES
5.7.2 SMALL & MEDIUM-SIZED ENTERPRISES
5.7.3 END USERS
FIGURE 21 SUPPLY CHAIN ANALYSIS
5.8 PRICING TREND ANALYSIS
TABLE 3 AVERAGE PRICE OF GLUCOSE MONITORING AND CARDIOMETABOLIC MONITORING PRODUCTS, BY COUNTRY, 2021 (USD)
TABLE 4 AVERAGE PRICE OF INFECTIOUS DISEASE TESTING PRODUCTS, BY COUNTRY, 2021 (USD)
TABLE 5 AVERAGE PRICE OF OTHER POINT-OF-CARE TESTING PRODUCTS, BY COUNTRY, 2021 (USD)
5.9 PORTER’S FIVE FORCES
5.9.1 OVERVIEW
TABLE 6 POINT-OF-CARE DIAGNOSTICS MARKET: PORTER’S FIVE FORCES ANALYSIS
5.9.2 BARGAINING POWER OF BUYERS
5.9.3 BARGAINING POWER OF SUPPLIERS
5.9.4 THREAT OF NEW ENTRANTS
5.9.5 THREAT OF SUBSTITUTES
5.9.6 INTENSITY OF COMPETITIVE RIVALRY
5.10 PATENT ANALYSIS
FIGURE 22 PATENT APPLICANTS FOR POINT-OF-CARE TESTING
FIGURE 23 PATENT APPLICANTS FOR POINT-OF-CARE DIAGNOSTICS
FIGURE 24 ECOSYSTEM COVERAGE: PARENT MARKET (IN VITRO DIAGNOSTICS)
6 POINT-OF-CARE DIAGNOSTICS MARKET, BY PRODUCT (Page No. - 86)
6.1 INTRODUCTION
TABLE 7 POINT-OF-CARE DIAGNOSTICS MARKET, BY PRODUCT, 2020–2027 (USD MILLION)
6.2 GLUCOSE MONITORING PRODUCTS
TABLE 8 POINT-OF-CARE DIAGNOSTICS MARKET FOR GLUCOSE MONITORING PRODUCTS, BY TYPE, 2020–2027 (USD MILLION)
TABLE 9 POINT-OF-CARE DIAGNOSTICS MARKET FOR GLUCOSE MONITORING PRODUCTS, BY PLATFORM, 2020–2027 (USD MILLION)
TABLE 10 POINT-OF-CARE DIAGNOSTICS MARKET FOR GLUCOSE MONITORING PRODUCTS, BY MODE OF PURCHASE, 2020–2027 (USD MILLION)
TABLE 11 POINT-OF-CARE DIAGNOSTICS MARKET FOR GLUCOSE MONITORING PRODUCTS, BY END USER, 2020–2027 (USD MILLION)
TABLE 12 POINT-OF-CARE DIAGNOSTICS MARKET FOR GLUCOSE MONITORING PRODUCTS, BY REGION, 2020–2027 (USD MILLION)
6.2.1 STRIPS
6.2.1.1 Strips make blood glucose testing easy and hassle-free
TABLE 13 GLUCOSE MONITORING STRIPS MARKET, BY REGION, 2020–2027 (USD MILLION)
6.2.2 METERS
6.2.2.1 Blood glucose meters are extremely helpful in the monitoring of blood glucose levels and adjusting therapeutic regimens
TABLE 14 GLUCOSE MONITORING METERS MARKET, BY REGION, 2020–2027 (USD MILLION)
6.2.3 LANCETS & LANCING DEVICES
6.2.3.1 Lancets & lancing devices segment to register lower growth in the glucose monitoring products market
TABLE 15 GLUCOSE MONITORING LANCETS & LANCING DEVICES MARKET, BY REGION, 2020–2027 (USD MILLION)
6.3 COVID-19 TESTING PRODUCTS
6.3.1 ONGOING PANDEMIC HAS INCREASED THE DEMAND FOR POC DIAGNOSTIC PRODUCTS
TABLE 16 POINT-OF-CARE DIAGNOSTICS MARKET FOR COVID-19 TESTING PRODUCTS, BY PLATFORM, 2020–2027 (USD MILLION)
TABLE 17 POINT-OF-CARE DIAGNOSTICS MARKET FOR COVID-19 TESTING PRODUCTS, BY MODE OF PURCHASE, 2020–2027 (USD MILLION)
TABLE 18 POINT-OF-CARE DIAGNOSTICS MARKET FOR COVID-19 TESTING PRODUCTS, BY END USER, 2020–2027 (USD MILLION)
TABLE 19 POINT-OF-CARE DIAGNOSTICS MARKET FOR COVID-19 TESTING PRODUCTS, BY REGION, 2020–2027 (USD MILLION)
6.4 CARDIOMETABOLIC MONITORING PRODUCTS
TABLE 20 POINT-OF-CARE DIAGNOSTICS MARKET FOR CARDIOMETABOLIC MONITORING PRODUCTS, BY TYPE, 2020–2027 (USD MILLION)
TABLE 21 POINT-OF-CARE DIAGNOSTICS MARKET FOR CARDIOMETABOLIC MONITORING PRODUCTS, BY PLATFORM, 2020–2027 (USD MILLION)
TABLE 22 POINT-OF-CARE DIAGNOSTICS MARKET FOR CARDIOMETABOLIC MONITORING PRODUCTS, BY MODE OF PURCHASE, 2020–2027 (USD MILLION)
TABLE 23 POINT-OF-CARE DIAGNOSTICS MARKET FOR CARDIOMETABOLIC MONITORING PRODUCTS, BY END USER, 2020–2027 (USD MILLION)
TABLE 24 POINT-OF-CARE DIAGNOSTICS MARKET FOR CARDIOMETABOLIC MONITORING PRODUCTS, BY REGION, 2020–2027 (USD MILLION)
6.4.1 CARDIAC MARKER TESTING PRODUCTS
6.4.1.1 Rising government initiatives for CVD research will contribute to market growth
TABLE 25 POINT-OF-CARE DIAGNOSTICS MARKET FOR CARDIAC MARKER TESTING PRODUCTS, BY MODE OF PURCHASE, 2020–2027 (USD MILLION)
TABLE 26 POINT-OF-CARE DIAGNOSTICS MARKET FOR CARDIAC MARKER TESTING PRODUCTS, BY END USER, 2020–2027 (USD MILLION)
TABLE 27 POINT-OF-CARE DIAGNOSTICS MARKET FOR CARDIAC MARKER TESTING PRODUCTS, BY REGION, 2020–2027 (USD MILLION)
6.4.2 BLOOD GAS/ELECTROLYTE TESTING PRODUCTS
6.4.2.1 Technological advancements in blood gas/electrolyte products will drive the growth of this market segment
TABLE 28 POINT-OF-CARE DIAGNOSTICS MARKET FOR BLOOD GAS/ELECTROLYTE TESTING PRODUCTS, BY MODE OF PURCHASE, 2020–2027 (USD MILLION)
TABLE 29 POINT-OF-CARE DIAGNOSTICS MARKET FOR BLOOD GAS/ELECTROLYTE TESTING PRODUCTS, BY END USER, 2020–2027 (USD MILLION)
TABLE 30 POINT-OF-CARE DIAGNOSTICS MARKET FOR BLOOD GAS/ELECTROLYTE TESTING PRODUCTS, BY REGION, 2020–2027 (USD MILLION)
6.4.3 HBA1C TESTING PRODUCTS
6.4.3.1 Government initiatives are promoting the regular use of HbA1c testing
TABLE 31 POINT-OF-CARE DIAGNOSTICS MARKET FOR HBA1C TESTING PRODUCTS, BY MODE OF PURCHASE, 2020–2027 (USD MILLION)
TABLE 32 POINT-OF-CARE DIAGNOSTICS MARKET FOR HBA1C TESTING PRODUCTS, BY END USER, 2020–2027 (USD MILLION)
TABLE 33 POINT-OF-CARE DIAGNOSTICS MARKET FOR HBA1C TESTING PRODUCTS, BY REGION, 2020–2027 (USD MILLION)
6.5 INFECTIOUS DISEASE TESTING PRODUCTS
TABLE 34 POINT-OF-CARE DIAGNOSTICS MARKET FOR INFECTIOUS DISEASE TESTING PRODUCTS, BY TYPE, 2020–2027 (USD MILLION)
TABLE 35 POINT-OF-CARE DIAGNOSTICS MARKET FOR INFECTIOUS DISEASE TESTING PRODUCTS, BY PLATFORM, 2020–2027 (USD MILLION)
TABLE 36 POINT-OF-CARE DIAGNOSTICS MARKET FOR INFECTIOUS DISEASE TESTING PRODUCTS, BY MODE OF PURCHASE, 2020–2027 (USD MILLION)
TABLE 37 POINT-OF-CARE DIAGNOSTICS MARKET FOR INFECTIOUS DISEASE TESTING PRODUCTS, BY END USER, 2020–2027 (USD MILLION)
TABLE 38 POINT-OF-CARE DIAGNOSTICS MARKET FOR INFECTIOUS DISEASE TESTING PRODUCTS, BY REGION, 2020–2027 (USD MILLION)
6.5.1 HIV TESTING PRODUCTS
6.5.1.1 Rising prevalence of HIV to drive market growth
TABLE 39 POINT-OF-CARE DIAGNOSTICS MARKET FOR HIV TESTING PRODUCTS, BY MODE OF PURCHASE, 2020–2027 (USD MILLION)
TABLE 40 POINT-OF-CARE DIAGNOSTICS MARKET FOR HIV TESTING PRODUCTS, BY END USER, 2020–2027 (USD MILLION)
TABLE 41 POINT-OF-CARE DIAGNOSTICS MARKET FOR HIV TESTING PRODUCTS, BY REGION, 2020–2027 (USD MILLION)
6.5.2 RESPIRATORY INFECTION TESTING PRODUCTS
6.5.2.1 POCT products for the diagnosis of respiratory infections offer lower sensitivity as compared to other tests
TABLE 42 POINT-OF-CARE DIAGNOSTICS MARKET FOR RESPIRATORY INFECTION TESTING PRODUCTS, BY MODE OF PURCHASE, 2020–2027 (USD MILLION)
TABLE 43 POINT-OF-CARE DIAGNOSTICS MARKET FOR RESPIRATORY INFECTION TESTING PRODUCTS, BY END USER, 2020–2027 (USD MILLION)
TABLE 44 POINT-OF-CARE DIAGNOSTICS MARKET FOR RESPIRATORY INFECTION TESTING PRODUCTS, BY REGION, 2020–2027 (USD MILLION)
6.5.3 HEPATITIS C TESTING PRODUCTS
6.5.3.1 Central and East Asia are among the highly affected regions with hepatitis C
TABLE 45 POINT-OF-CARE DIAGNOSTICS MARKET FOR HEPATITIS C TESTING PRODUCTS, BY MODE OF PURCHASE, 2020–2027 (USD MILLION)
TABLE 46 POINT-OF-CARE DIAGNOSTICS MARKET FOR HEPATITIS C TESTING PRODUCTS, BY END USER, 2020–2027 (USD MILLION)
TABLE 47 POINT-OF-CARE DIAGNOSTICS MARKET FOR HEPATITIS C TESTING PRODUCTS, BY REGION, 2020–2027 (USD MILLION)
6.5.4 HEALTHCARE-ASSOCIATED INFECTION TESTING PRODUCTS
6.5.4.1 Rising prevalence of HAIs is the key factor driving market growth
TABLE 48 POINT-OF-CARE DIAGNOSTICS MARKET FOR HEALTHCARE-ASSOCIATED INFECTION TESTING PRODUCTS, BY MODE OF PURCHASE, 2020–2027 (USD MILLION)
TABLE 49 POINT-OF-CARE DIAGNOSTICS MARKET FOR HEALTHCARE-ASSOCIATED INFECTION TESTING PRODUCTS, BY END USER, 2020–2027 (USD MILLION)
TABLE 50 POINT-OF-CARE DIAGNOSTICS MARKET FOR HEALTHCARE-ASSOCIATED INFECTION TESTING PRODUCTS, BY REGION, 2020–2027 (USD MILLION)
6.5.5 INFLUENZA TESTING PRODUCTS
6.5.5.1 Rising influenza prevalence has driven the demand for influenza testing products
TABLE 51 POINT-OF-CARE DIAGNOSTICS MARKET FOR INFLUENZA TESTING PRODUCTS, BY MODE OF PURCHASE, 2020–2027 (USD MILLION)
TABLE 52 POINT-OF-CARE DIAGNOSTICS MARKET FOR INFLUENZA TESTING PRODUCTS, BY END USER, 2020–2027 (USD MILLION)
TABLE 53 POINT-OF-CARE DIAGNOSTICS MARKET FOR INFLUENZA TESTING PRODUCTS, BY REGION, 2020–2027 (USD MILLION)
6.5.6 TROPICAL DISEASE TESTING PRODUCTS
6.5.6.1 Increasing government funding for the use of POC in tropical disease testing will support market growth
TABLE 54 POINT-OF-CARE DIAGNOSTICS MARKET FOR TROPICAL DISEASE TESTING PRODUCTS, BY MODE OF PURCHASE, 2020–2027 (USD MILLION)
TABLE 55 POINT-OF-CARE DIAGNOSTICS MARKET FOR TROPICAL DISEASE TESTING PRODUCTS, BY END USER, 2020–2027 (USD MILLION)
TABLE 56 POINT-OF-CARE DIAGNOSTICS MARKET FOR TROPICAL DISEASE TESTING PRODUCTS, BY REGION, 2020–2027 (USD MILLION)
6.5.7 SEXUALLY TRANSMITTED DISEASE TESTING PRODUCTS
6.5.7.1 Privacy and confidentiality issues are the key factors leading to the adoption of POC STD testing products
TABLE 57 POINT-OF-CARE DIAGNOSTICS MARKET FOR STD TESTING PRODUCTS, BY MODE OF PURCHASE, 2020–2027 (USD MILLION)
TABLE 58 POINT-OF-CARE DIAGNOSTICS MARKET FOR STD TESTING PRODUCTS, BY END USER, 2020–2027 (USD MILLION)
TABLE 59 POINT-OF-CARE DIAGNOSTICS MARKET FOR STD TESTING PRODUCTS, BY REGION, 2020–2027 (USD MILLION)
6.5.8 OTHER INFECTIOUS DISEASE TESTING PRODUCTS
TABLE 60 POINT-OF-CARE DIAGNOSTICS MARKET FOR OTHER INFECTIOUS DISEASE TESTING PRODUCTS, BY MODE OF PURCHASE, 2020–2027 (USD MILLION)
TABLE 61 POINT-OF-CARE DIAGNOSTICS MARKET FOR OTHER INFECTIOUS DISEASE TESTING PRODUCTS, BY END USER, 2020–2027 (USD MILLION)
TABLE 62 POINT-OF-CARE DIAGNOSTICS MARKET FOR OTHER INFECTIOUS DISEASE TESTING PRODUCTS, BY REGION, 2020–2027 (USD MILLION)
6.6 COAGULATION MONITORING PRODUCTS
TABLE 63 POINT-OF-CARE DIAGNOSTICS MARKET FOR COAGULATION MONITORING PRODUCTS, BY TYPE, 2020–2027 (USD MILLION)
TABLE 64 POINT-OF-CARE DIAGNOSTICS MARKET FOR COAGULATION MONITORING PRODUCTS, BY PLATFORM, 2020–2027 (USD MILLION)
TABLE 65 POINT-OF-CARE DIAGNOSTICS MARKET FOR COAGULATION MONITORING PRODUCTS, BY MODE OF PURCHASE, 2020–2027 (USD MILLION)
TABLE 66 POINT-OF-CARE DIAGNOSTICS MARKET FOR COAGULATION MONITORING PRODUCTS, BY END USER, 2020–2027 (USD MILLION)
TABLE 67 POINT-OF-CARE DIAGNOSTICS MARKET FOR COAGULATION MONITORING PRODUCTS, BY REGION, 2020–2027 (USD MILLION)
6.6.1 PT/INR TESTING PRODUCTS
6.6.1.1 PT/INR is one of the most commonly used coagulation monitoring methods
TABLE 68 POINT-OF-CARE DIAGNOSTICS MARKET FOR PT/INR TESTING PRODUCTS, BY MODE OF PURCHASE, 2020–2027 (USD MILLION)
TABLE 69 POINT-OF-CARE DIAGNOSTICS MARKET FOR PT/INR TESTING PRODUCTS, BY END USER, 2020–2027 (USD MILLION)
TABLE 70 POINT-OF-CARE DIAGNOSTICS MARKET FOR PT/INR TESTING PRODUCTS, BY REGION, 2020–2027 (USD MILLION)
6.6.2 ACT/APTT TESTING PRODUCTS
6.6.2.1 Rising number of patients undergoing angioplasty and dialysis globally to support market growth
TABLE 71 POINT-OF-CARE DIAGNOSTICS MARKET FOR ACT/APTT TESTING PRODUCTS, BY MODE OF PURCHASE, 2020–2027 (USD MILLION)
TABLE 72 POINT-OF-CARE DIAGNOSTICS MARKET FOR ACT/APTT TESTING PRODUCTS, BY END USER, 2020–2027 (USD MILLION)
TABLE 73 POINT-OF-CARE DIAGNOSTICS MARKET FOR ACT/APTT TESTING PRODUCTS, BY REGION, 2020–2027 (USD MILLION)
6.7 PREGNANCY & FERTILITY TESTING PRODUCTS
TABLE 74 POINT-OF-CARE DIAGNOSTICS MARKET FOR PREGNANCY & FERTILITY TESTING PRODUCTS, BY TYPE, 2020–2027 (USD MILLION)
TABLE 75 POINT-OF-CARE DIAGNOSTICS MARKET FOR PREGNANCY & FERTILITY TESTING PRODUCTS, BY PLATFORM, 2020–2027 (USD MILLION)
TABLE 76 POINT-OF-CARE DIAGNOSTICS MARKET FOR PREGNANCY & FERTILITY TESTING PRODUCTS, BY MODE OF PURCHASE, 2020–2027 (USD MILLION)
TABLE 77 POINT-OF-CARE DIAGNOSTICS MARKET FOR PREGNANCY & FERTILITY TESTING PRODUCTS, BY END USER, 2020–2027 (USD MILLION)
TABLE 78 POINT-OF-CARE DIAGNOSTICS MARKET FOR PREGNANCY & FERTILITY TESTING PRODUCTS, BY REGION, 2020–2027 (USD MILLION)
6.7.1 PREGNANCY TESTING PRODUCTS
6.7.1.1 Rising inclination toward home testing to support market growth
TABLE 79 POINT-OF-CARE DIAGNOSTICS MARKET FOR PREGNANCY TESTING PRODUCTS, BY MODE OF PURCHASE, 2020–2027 (USD MILLION)
TABLE 80 POINT-OF-CARE DIAGNOSTICS MARKET FOR PREGNANCY TESTING PRODUCTS, BY END USER, 2020–2027 (USD MILLION)
TABLE 81 POINT-OF-CARE DIAGNOSTICS MARKET FOR PREGNANCY TESTING PRODUCTS, BY REGION, 2020–2027 (USD MILLION)
6.7.2 FERTILITY TESTING PRODUCTS
6.7.2.1 Increasing awareness of fertility testing to drive market growth
TABLE 82 POINT-OF-CARE DIAGNOSTICS MARKET FOR FERTILITY TESTING PRODUCTS, BY MODE OF PURCHASE, 2020–2027 (USD MILLION)
TABLE 83 POINT-OF-CARE DIAGNOSTICS MARKET FOR FERTILITY TESTING PRODUCTS, BY END USER, 2020–2027 (USD MILLION)
TABLE 84 POINT-OF-CARE DIAGNOSTICS MARKET FOR FERTILITY TESTING PRODUCTS, BY REGION, 2020–2027 (USD MILLION)
6.8 TUMOR/CANCER MARKER TESTING PRODUCTS
6.8.1 INCREASING INVESTMENTS FOR RESEARCH RELATED TO POC CANCER TESTING ARE DRIVING MARKET GROWTH
TABLE 85 POINT-OF-CARE DIAGNOSTICS MARKET FOR TUMOR/CANCER MARKER TESTING PRODUCTS, BY PLATFORM, 2020–2027 (USD MILLION)
TABLE 86 POINT-OF-CARE DIAGNOSTICS MARKET FOR TUMOR/CANCER MARKER TESTING PRODUCTS, BY MODE OF PURCHASE, 2020–2027 (USD MILLION)
TABLE 87 POINT-OF-CARE DIAGNOSTICS MARKET FOR TUMOR/CANCER MARKER TESTING PRODUCTS, BY END USER, 2020–2027 (USD MILLION)
TABLE 88 POINT-OF-CARE DIAGNOSTICS MARKET FOR HEMATOLOGY TESTING PRODUCTS, BY MODE OF PURCHASE, 2020–2027 (USD MILLION)
TABLE 89 POINT-OF-CARE DIAGNOSTICS MARKET FOR HEMATOLOGY TESTING PRODUCTS, BY END USER, 2020–2027 (USD MILLION)
TABLE 90 POINT-OF-CARE DIAGNOSTICS MARKET FOR HEMATOLOGY TESTING PRODUCTS, BY REGION, 2020–2027 (USD MILLION)
6.9 DRUGS-OF-ABUSE TESTING PRODUCTS
6.9.1 RISING CONSUMPTION OF ILLICIT DRUGS HAS BOOSTED THE DEMAND FOR TESTING
TABLE 91 POINT-OF-CARE DIAGNOSTICS MARKET FOR DRUGS-OF-ABUSE TESTING PRODUCTS, BY PLATFORM, 2020–2027 (USD MILLION)
TABLE 92 POINT-OF-CARE DIAGNOSTICS MARKET FOR DRUGS-OF-ABUSE TESTING PRODUCTS, BY MODE OF PURCHASE, 2020–2027 (USD MILLION)
TABLE 93 POINT-OF-CARE DIAGNOSTICS MARKET FOR DRUGS-OF-ABUSE TESTING PRODUCTS, BY END USER, 2020–2027 (USD MILLION)
TABLE 94 POINT-OF-CARE DIAGNOSTICS MARKET FOR DRUGS-OF-ABUSE TESTING PRODUCTS, BY REGION, 2020–2027 (USD MILLION)
6.10 FECAL OCCULT TESTING PRODUCTS
6.10.1 LACK OF PROPER TRAINING IN THE USE OF FECAL OCCULT TESTING TO HAMPER MARKET ADOPTION
TABLE 95 POINT-OF-CARE DIAGNOSTICS MARKET FOR FECAL OCCULT TESTING PRODUCTS, BY PLATFORM, 2020–2027 (USD MILLION)
TABLE 96 POINT-OF-CARE DIAGNOSTICS MARKET FOR FECAL OCCULT TESTING PRODUCTS, BY MODE OF PURCHASE, 2020–2027 (USD MILLION)
TABLE 97 POINT-OF-CARE DIAGNOSTICS MARKET FOR FECAL OCCULT TESTING PRODUCTS, BY END USER, 2020–2027 (USD MILLION)
TABLE 98 POINT-OF-CARE DIAGNOSTICS MARKET FOR FECAL OCCULT TESTING PRODUCTS, BY REGION, 2020–2027 (USD MILLION)
6.11 OTHER PRODUCTS
TABLE 99 POINT-OF-CARE DIAGNOSTICS MARKET FOR OTHER POC PRODUCTS, BY PLATFORM, 2020–2027 (USD MILLION)
TABLE 100 POINT-OF-CARE DIAGNOSTICS MARKET FOR OTHER PRODUCTS, BY MODE OF PURCHASE, 2020–2027 (USD MILLION)
TABLE 101 POINT-OF-CARE DIAGNOSTICS MARKET FOR OTHER POC PRODUCTS, BY END USER, 2020–2027 (USD MILLION)
TABLE 102 POINT-OF-CARE DIAGNOSTICS MARKET FOR OTHER POC PRODUCTS, BY REGION, 2020–2027 (USD MILLION)
7 POINT-OF-CARE DIAGNOSTICS MARKET, BY PLATFORM (Page No. - 147)
7.1 INTRODUCTION
TABLE 103 POINT-OF-CARE DIAGNOSTICS MARKET, BY PLATFORM, 2020–2027 (USD MILLION)
7.2 LATERAL FLOW ASSAYS
7.2.1 INCREASING ADOPTION OF LFA TESTING PRODUCTS IN HOME CARE SETTINGS TO DRIVE MARKET GROWTH
TABLE 104 POINT-OF-CARE DIAGNOSTICS MARKET FOR LATERAL FLOW ASSAYS, BY REGION, 2020–2027 (USD MILLION)
7.3 IMMUNOASSAYS
7.3.1 RISING INCIDENCE OF CANCER AND GROWING AWARENESS ABOUT IMMUNOASSAY PLATFORMS TO SUPPORT MARKET GROWTH
TABLE 105 POINT-OF-CARE DIAGNOSTICS MARKET FOR IMMUNOASSAYS, BY REGION, 2020–2027 (USD MILLION)
7.4 MICROFLUIDICS
7.4.1 MICROFLUIDICS IS AN EMERGING PLATFORM IN THE POC DIAGNOSTICS MARKET
TABLE 106 POINT-OF-CARE DIAGNOSTICS MARKET FOR MICROFLUIDICS, BY REGION, 2020–2027 (USD MILLION)
7.5 DIPSTICKS
7.5.1 DIPSTICKS HELP IN THE ROUTINE ANALYSIS OF SEVERAL MEDICAL CONDITIONS
TABLE 107 POINT-OF-CARE DIAGNOSTICS MARKET FOR DIPSTICKS, BY REGION, 2020–2027 (USD MILLION)
7.6 MOLECULAR DIAGNOSTICS
7.6.1 INCREASING INITIATIVES BY MARKET PLAYERS FOR DEVELOPING POC MOLECULAR DIAGNOSTIC PRODUCTS TO DRIVE MARKET GROWTH
TABLE 108 POINT-OF-CARE DIAGNOSTICS MARKET FOR MOLECULAR DIAGNOSTICS, BY REGION, 2020–2027 (USD MILLION)
8 POINT-OF-CARE DIAGNOSTICS MARKET, BY MODE OF PURCHASE (Page No. - 154)
8.1 INTRODUCTION
TABLE 109 POINT-OF-CARE DIAGNOSTICS MARKET, BY MODE OF PURCHASE, 2020–2027 (USD MILLION)
8.2 OTC TESTING PRODUCTS
8.2.1 RISING FOCUS ON HOME CARE HAS BOOSTED THE DEMAND FOR OTC TESTING PRODUCTS
TABLE 110 OTC POINT-OF-CARE TESTING PRODUCTS MARKET, BY REGION, 2020–2027 (USD MILLION)
8.3 PRESCRIPTION-BASED TESTING PRODUCTS
8.3.1 GROWING PREVALENCE OF LIFESTYLE DISEASES AND FAVORABLE REIMBURSEMENT HAVE DRIVEN MARKET GROWTH
TABLE 111 PRESCRIPTION-BASED POINT-OF-CARE TESTING PRODUCTS MARKET, BY REGION, 2020–2027 (USD MILLION)
9 POINT-OF-CARE DIAGNOSTICS MARKET, BY END USER (Page No. - 158)
9.1 INTRODUCTION
TABLE 112 POINT-OF-CARE DIAGNOSTICS MARKET, BY END USER, 2020–2027 (USD MILLION)
9.2 CLINICAL LABORATORIES
9.2.1 IMPROVEMENTS IN CLINICAL DIAGNOSTICS AND TESTING TECHNOLOGIES WILL BOOST MARKET GROWTH
TABLE 113 POINT-OF-CARE DIAGNOSTICS MARKET FOR CLINICAL LABORATORIES, BY REGION, 2020–2027 (USD MILLION)
9.3 AMBULATORY CARE FACILITIES & PHYSICIANS’ OFFICES
9.3.1 RAPID RESULT GENERATION AND AVAILABILITY OF IMMEDIATE PATIENT CARE ARE THE MAJOR FACTORS DRIVING MARKET GROWTH
TABLE 114 POINT-OF-CARE DIAGNOSTICS MARKET FOR AMBULATORY CARE FACILITIES & PHYSICIANS’ OFFICES, BY REGION, 2020–2027 (USD MILLION)
9.4 PHARMACIES, RETAIL CLINICS, & E-COMMERCE PLATFORMS
9.4.1 CONVENIENCE AND EASE OF EXPERT ACCESS TO DRIVE MARKET GROWTH
TABLE 115 POINT-OF-CARE DIAGNOSTICS MARKET FOR PHARMACIES, RETAIL CLINICS, & E-COMMERCE PLATFORMS, BY REGION, 2020–2027 (USD MILLION)
9.5 HOSPITALS, CRITICAL CARE CENTERS, & URGENT CARE CENTERS
9.5.1 HOSPITALS ARE AMONG THE LARGEST END USERS OF POC DIAGNOSTICS
TABLE 116 POINT-OF-CARE DIAGNOSTICS MARKET FOR HOSPITALS, CRITICAL CARE CENTERS, & URGENT CARE CENTERS, BY REGION, 2020–2027 (USD MILLION)
9.6 HOME CARE & SELF-TESTING
9.6.1 INCREASING INCLINATION TOWARD HOME HEALTHCARE IS DRIVING THE GROWTH OF THIS END-USER SEGMENT
TABLE 117 POINT-OF-CARE DIAGNOSTICS MARKET FOR HOME CARE & SELF TESTING, BY REGION, 2020–2027 (USD MILLION)
9.7 OTHER END USERS
TABLE 118 POINT-OF-CARE DIAGNOSTICS MARKET FOR OTHER END USERS, BY REGION, 2020–2027 (USD MILLION)
10 POINT-OF-CARE DIAGNOSTICS MARKET, BY REGION (Page No. - 166)
10.1 INTRODUCTION
TABLE 119 POINT-OF-CARE DIAGNOSTICS MARKET, BY REGION, 2020–2027 (USD MILLION)
10.2 NORTH AMERICA
FIGURE 25 NORTH AMERICA: POINT-OF-CARE DIAGNOSTICS MARKET SNAPSHOT
TABLE 120 NORTH AMERICA: POINT-OF-CARE DIAGNOSTICS MARKET, BY COUNTRY, 2020–2027 (USD MILLION)
TABLE 121 NORTH AMERICA: POINT-OF-CARE DIAGNOSTICS MARKET, BY PRODUCT, 2020–2027 (USD MILLION)
TABLE 122 NORTH AMERICA: POINT-OF-CARE DIAGNOSTICS MARKET FOR GLUCOSE MONITORING PRODUCTS, BY TYPE, 2020–2027 (USD MILLION)
TABLE 123 NORTH AMERICA: POINT-OF-CARE DIAGNOSTICS MARKET FOR CARDIOMETABOLIC MONITORING PRODUCTS, BY TYPE, 2020–2027 (USD MILLION)
TABLE 124 NORTH AMERICA: POINT-OF-CARE DIAGNOSTICS MARKET FOR INFECTIOUS DISEASE TESTING PRODUCTS, BY TYPE, 2020–2027 (USD MILLION)
TABLE 125 NORTH AMERICA: POINT-OF-CARE DIAGNOSTICS MARKET FOR COAGULATION MONITORING PRODUCTS, BY TYPE, 2020–2027 (USD MILLION)
TABLE 126 NORTH AMERICA: POINT-OF-CARE DIAGNOSTICS MARKET FOR PREGNANCY & FERTILITY TESTING PRODUCTS, BY TYPE, 2020–2027 (USD MILLION)
TABLE 127 NORTH AMERICA: POINT-OF-CARE DIAGNOSTICS MARKET, BY PLATFORM, 2020–2027 (USD MILLION)
TABLE 128 NORTH AMERICA: POINT-OF-CARE DIAGNOSTICS MARKET, BY MODE OF PURCHASE, 2020–2027 (USD MILLION)
TABLE 129 NORTH AMERICA: POINT-OF-CARE DIAGNOSTICS MARKET, BY END USER, 2020–2027 (USD MILLION)
10.2.1 US
10.2.1.1 The US dominates the North American POC diagnostics market
TABLE 130 US: POINT-OF-CARE DIAGNOSTICS MARKET, BY PRODUCT, 2020–2027 (USD MILLION)
TABLE 131 US: POINT-OF-CARE DIAGNOSTICS MARKET FOR CARDIOMETABOLIC MONITORING PRODUCTS, BY TYPE, 2020–2027 (USD MILLION)
TABLE 132 US: POINT-OF-CARE DIAGNOSTICS MARKET FOR INFECTIOUS DISEASE TESTING PRODUCTS, BY TYPE, 2020–2027 (USD MILLION)
TABLE 133 US: POINT-OF-CARE DIAGNOSTICS MARKET FOR COAGULATION MONITORING PRODUCTS, BY TYPE, 2020–2027 (USD MILLION)
TABLE 134 US: POINT-OF-CARE DIAGNOSTICS MARKET FOR PREGNANCY & FERTILITY TESTING PRODUCTS, BY TYPE, 2020–2027 (USD MILLION)
10.2.2 CANADA
10.2.2.1 Rising government initiatives to support the growth of the POC diagnostics market in Canada
TABLE 135 CANADA: POINT-OF-CARE DIAGNOSTICS MARKET, BY PRODUCT, 2020–2027 (USD MILLION)
TABLE 136 CANADA: POINT-OF-CARE DIAGNOSTICS MARKET FOR CARDIOMETABOLIC MONITORING PRODUCTS, BY TYPE, 2020–2027 (USD MILLION)
TABLE 137 CANADA: POINT-OF-CARE DIAGNOSTICS MARKET FOR INFECTIOUS DISEASE TESTING PRODUCTS, BY TYPE, 2020–2027 (USD MILLION)
TABLE 138 CANADA: POINT-OF-CARE DIAGNOSTICS MARKET FOR COAGULATION MONITORING PRODUCTS, BY TYPE, 2020–2027 (USD MILLION)
TABLE 139 CANADA: POINT-OF-CARE DIAGNOSTICS MARKET FOR PREGNANCY & FERTILITY TESTING PRODUCTS, BY TYPE, 2020–2027 (USD MILLION)
10.3 EUROPE
TABLE 140 EUROPE: POINT-OF-CARE DIAGNOSTICS MARKET, BY COUNTRY, 2020–2027 (USD MILLION)
TABLE 141 EUROPE: POINT-OF-CARE DIAGNOSTICS MARKET, BY PRODUCT, 2020–2027 (USD MILLION)
TABLE 142 EUROPE: POINT-OF-CARE DIAGNOSTICS MARKET FOR GLUCOSE MONITORING PRODUCTS, BY TYPE, 2020–2027 (USD MILLION)
TABLE 143 EUROPE: POINT-OF-CARE DIAGNOSTICS MARKET FOR CARDIOMETABOLIC MONITORING PRODUCTS, BY TYPE, 2020–2027 (USD MILLION)
TABLE 144 EUROPE: POINT-OF-CARE DIAGNOSTICS MARKET FOR INFECTIOUS DISEASE TESTING PRODUCTS, BY TYPE, 2020–2027 (USD MILLION)
TABLE 145 EUROPE: POINT-OF-CARE DIAGNOSTICS MARKET FOR COAGULATION MONITORING PRODUCTS, BY TYPE, 2020–2027 (USD MILLION)
TABLE 146 EUROPE: POINT-OF-CARE DIAGNOSTICS MARKET FOR PREGNANCY & FERTILITY TESTING PRODUCTS, BY TYPE, 2020–2027 (USD MILLION)
TABLE 147 EUROPE: POINT-OF-CARE DIAGNOSTICS MARKET, BY PLATFORM, 2020–2027 (USD MILLION)
TABLE 148 EUROPE: POINT-OF-CARE DIAGNOSTICS MARKET, BY MODE OF PURCHASE, 2020–2027 (USD MILLION)
TABLE 149 EUROPE: POINT-OF-CARE DIAGNOSTICS MARKET, BY END USER, 2020–2027 (USD MILLION)
10.3.1 GERMANY
10.3.1.1 Germany accounts for the largest share of the European market
TABLE 150 GERMANY: POINT-OF-CARE DIAGNOSTICS MARKET, BY PRODUCT, 2020–2027 (USD MILLION)
TABLE 151 GERMANY: POINT-OF-CARE DIAGNOSTICS MARKET FOR CARDIOMETABOLIC MONITORING PRODUCTS, BY TYPE, 2020–2027 (USD MILLION)
TABLE 152 GERMANY: POINT-OF-CARE DIAGNOSTICS MARKET FOR INFECTIOUS DISEASE TESTING PRODUCTS, BY TYPE, 2020–2027 (USD MILLION)
TABLE 153 GERMANY: POINT-OF-CARE DIAGNOSTICS MARKET FOR COAGULATION MONITORING PRODUCTS, BY TYPE, 2020–2027 (USD MILLION)
TABLE 154 GERMANY: POINT-OF-CARE DIAGNOSTICS MARKET FOR PREGNANCY & FERTILITY TESTING PRODUCTS, BY TYPE, 2020–2027 (USD MILLION)
10.3.2 FRANCE
10.3.2.1 Growing public-private collaborations for product development to drive market growth
TABLE 155 FRANCE: POINT-OF-CARE DIAGNOSTICS MARKET, BY PRODUCT, 2020–2027 (USD MILLION)
TABLE 156 FRANCE: POINT-OF-CARE DIAGNOSTICS MARKET FOR CARDIOMETABOLIC MONITORING PRODUCTS, BY TYPE, 2020–2027 (USD MILLION)
TABLE 157 FRANCE: POINT-OF-CARE DIAGNOSTICS MARKET FOR INFECTIOUS DISEASE TESTING PRODUCTS, BY TYPE, 2020–2027 (USD MILLION)
TABLE 158 FRANCE: POINT-OF-CARE DIAGNOSTICS MARKET FOR COAGULATION MONITORING PRODUCTS, BY TYPE, 2020–2027 (USD MILLION)
TABLE 159 FRANCE: POINT-OF-CARE DIAGNOSTICS MARKET FOR PREGNANCY & FERTILITY TESTING PRODUCTS, BY TYPE, 2020–2027 (USD MILLION)
10.3.3 UK
10.3.3.1 Growing awareness of the benefits offered by POC diagnostics to support market growth in the UK
TABLE 160 UK: POINT-OF-CARE DIAGNOSTICS MARKET, BY PRODUCT, 2020–2027 (USD MILLION)
TABLE 161 UK: POINT-OF-CARE DIAGNOSTICS MARKET FOR CARDIOMETABOLIC MONITORING PRODUCTS, BY TYPE, 2020–2027 (USD MILLION)
TABLE 162 UK: POINT-OF-CARE DIAGNOSTICS MARKET FOR INFECTIOUS DISEASE TESTING PRODUCTS, BY TYPE, 2020–2027 (USD MILLION)
TABLE 163 UK: POINT-OF-CARE DIAGNOSTICS MARKET FOR COAGULATION MONITORING PRODUCTS, BY TYPE, 2020–2027 (USD MILLION)
TABLE 164 UK: POINT-OF-CARE DIAGNOSTICS MARKET FOR PREGNANCY & FERTILITY TESTING PRODUCTS, BY TYPE, 2020–2027 (USD MILLION)
10.3.4 ITALY
10.3.4.1 Rising prevalence of chronic diseases in Italy to drive the demand for point-of-care diagnostics
TABLE 165 ITALY: POINT-OF-CARE DIAGNOSTICS MARKET, BY PRODUCT, 2020–2027 (USD MILLION)
TABLE 166 ITALY: POINT-OF-CARE DIAGNOSTICS MARKET FOR CARDIOMETABOLIC MONITORING PRODUCTS, BY TYPE, 2020–2027 (USD MILLION)
TABLE 167 ITALY: POINT-OF-CARE DIAGNOSTICS MARKET FOR INFECTIOUS DISEASE TESTING PRODUCTS, BY TYPE, 2020–2027 (USD MILLION)
TABLE 168 ITALY: POINT-OF-CARE DIAGNOSTICS MARKET FOR COAGULATION MONITORING PRODUCTS, BY TYPE, 2020–2027 (USD MILLION)
TABLE 169 ITALY: POINT-OF-CARE DIAGNOSTICS MARKET FOR PREGNANCY & FERTILITY TESTING PRODUCTS, BY TYPE, 2020–2027 (USD MILLION)
10.3.5 SPAIN
10.3.5.1 Increasing funding for research in Spain to boost the market growth
TABLE 170 SPAIN: POINT-OF-CARE DIAGNOSTICS MARKET, BY PRODUCT, 2020–2027 (USD MILLION)
TABLE 171 SPAIN: POINT-OF-CARE DIAGNOSTICS MARKET FOR CARDIOMETABOLIC MONITORING PRODUCTS, BY TYPE, 2020–2027 (USD MILLION)
TABLE 172 SPAIN: POINT-OF-CARE DIAGNOSTICS MARKET FOR INFECTIOUS DISEASE TESTING PRODUCTS, BY TYPE, 2020–2027 (USD MILLION)
TABLE 173 SPAIN: POINT-OF-CARE DIAGNOSTICS MARKET FOR COAGULATION MONITORING PRODUCTS, BY TYPE, 2020–2027 (USD MILLION)
TABLE 174 SPAIN: POINT-OF-CARE DIAGNOSTICS MARKET FOR PREGNANCY & FERTILITY TESTING PRODUCTS, BY TYPE, 2020–2027 (USD MILLION)
10.3.6 REST OF EUROPE
TABLE 175 REST OF EUROPE: POINT-OF-CARE DIAGNOSTICS MARKET, BY PRODUCT, 2020–2027 (USD MILLION)
TABLE 176 REST OF EUROPE: POINT-OF-CARE DIAGNOSTICS MARKET FOR CARDIOMETABOLIC MONITORING PRODUCTS, BY TYPE, 2020–2027 (USD MILLION)
TABLE 177 REST OF EUROPE: POINT-OF-CARE DIAGNOSTICS MARKET FOR INFECTIOUS DISEASE TESTING PRODUCTS, BY TYPE, 2020–2027 (USD MILLION)
TABLE 178 REST OF EUROPE: POINT-OF-CARE DIAGNOSTICS MARKET FOR COAGULATION MONITORING PRODUCTS, BY TYPE, 2020–2027 (USD MILLION)
TABLE 179 REST OF EUROPE: POINT-OF-CARE DIAGNOSTICS MARKET FOR PREGNANCY & FERTILITY TESTING PRODUCTS, BY TYPE, 2020–2027 (USD MILLION)
10.4 ASIA PACIFIC
TABLE 180 ASIA PACIFIC: POINT-OF-CARE DIAGNOSTICS MARKET, BY COUNTRY, 2020–2027 (USD MILLION)
TABLE 181 ASIA PACIFIC: POINT-OF-CARE DIAGNOSTICS MARKET, BY PRODUCT, 2020–2027 (USD MILLION)
TABLE 182 ASIA PACIFIC: POINT-OF-CARE DIAGNOSTICS MARKET FOR GLUCOSE MONITORING PRODUCTS, BY TYPE, 2020–2027 (USD MILLION)
TABLE 183 ASIA PACIFIC: POINT-OF-CARE DIAGNOSTICS MARKET FOR CARDIOMETABOLIC MONITORING PRODUCTS, BY TYPE, 2020–2027 (USD MILLION)
TABLE 184 ASIA PACIFIC: POINT-OF-CARE DIAGNOSTICS MARKET FOR INFECTIOUS DISEASE TESTING PRODUCTS, BY TYPE, 2020–2027 (USD MILLION)
TABLE 185 ASIA PACIFIC: POINT-OF-CARE DIAGNOSTICS MARKET FOR COAGULATION MONITORING PRODUCTS, BY TYPE, 2020–2027 (USD MILLION)
TABLE 186 ASIA PACIFIC: POINT-OF-CARE DIAGNOSTICS MARKET FOR PREGNANCY & FERTILITY TESTING PRODUCTS, BY TYPE, 2020–2027 (USD MILLION)
TABLE 187 ASIA PACIFIC: POINT-OF-CARE DIAGNOSTICS MARKET, BY PLATFORM, 2020–2027 (USD MILLION)
TABLE 188 ASIA PACIFIC: POINT-OF-CARE DIAGNOSTICS MARKET, BY MODE OF PURCHASE, 2020–2027 (USD MILLION)
TABLE 189 ASIA PACIFIC: POINT-OF-CARE DIAGNOSTICS MARKET, BY END USER, 2020–2027 (USD MILLION)
10.4.1 JAPAN
10.4.1.1 Japan to dominate the APAC POC diagnostics market during the forecast period
TABLE 190 JAPAN: POINT-OF-CARE DIAGNOSTICS MARKET, BY PRODUCT, 2020–2027 (USD MILLION)
TABLE 191 JAPAN: POINT-OF-CARE DIAGNOSTICS MARKET FOR CARDIOMETABOLIC MONITORING PRODUCTS, BY TYPE, 2020–2027 (USD MILLION)
TABLE 192 JAPAN: POINT-OF-CARE DIAGNOSTICS MARKET FOR INFECTIOUS DISEASE TESTING PRODUCTS, BY TYPE, 2020–2027 (USD MILLION)
TABLE 193 JAPAN: POINT-OF-CARE DIAGNOSTICS MARKET FOR COAGULATION MONITORING PRODUCTS, BY TYPE, 2020–2027 (USD MILLION)
TABLE 194 JAPAN: POINT-OF-CARE DIAGNOSTICS MARKET FOR PREGNANCY & FERTILITY TESTING PRODUCTS, BY TYPE, 2020–2027 (USD MILLION)
10.4.2 CHINA
10.4.2.1 Rising investments by market players and the Chinese government to drive market growth
TABLE 195 CHINA: POINT-OF-CARE DIAGNOSTICS MARKET, BY PRODUCT, 2020–2027 (USD MILLION)
TABLE 196 CHINA: POINT-OF-CARE DIAGNOSTICS MARKET FOR CARDIOMETABOLIC MONITORING PRODUCTS, BY TYPE, 2020–2027 (USD MILLION)
TABLE 197 CHINA: POINT-OF-CARE DIAGNOSTICS MARKET FOR INFECTIOUS DISEASE TESTING PRODUCTS, BY TYPE, 2020–2027 (USD MILLION)
TABLE 198 CHINA: POINT-OF-CARE DIAGNOSTICS MARKET FOR COAGULATION MONITORING PRODUCTS, BY TYPE, 2020–2027 (USD MILLION)
TABLE 199 CHINA: POINT-OF-CARE DIAGNOSTICS MARKET FOR PREGNANCY & FERTILITY TESTING PRODUCTS, BY TYPE, 2020–2027 (USD MILLION)
10.4.3 INDIA
10.4.3.1 High burden of chronic diseases to support market growth
TABLE 200 INDIA: POINT-OF-CARE DIAGNOSTICS MARKET, BY PRODUCT, 2020–2027 (USD MILLION)
TABLE 201 INDIA: POINT-OF-CARE DIAGNOSTICS MARKET FOR CARDIOMETABOLIC MONITORING PRODUCTS, BY TYPE, 2020–2027 (USD MILLION)
TABLE 202 INDIA: POINT-OF-CARE DIAGNOSTICS MARKET FOR INFECTIOUS DISEASE TESTING PRODUCTS, BY TYPE, 2020–2027 (USD MILLION)
TABLE 203 INDIA: POINT-OF-CARE DIAGNOSTICS MARKET FOR COAGULATION MONITORING PRODUCTS, BY TYPE, 2020–2027 (USD MILLION)
10.4.4 AUSTRALIA
10.4.4.1 Government initiatives to support the adoption of point-of-care testing
TABLE 204 AUSTRALIA: POINT-OF-CARE DIAGNOSTICS MARKET, BY PRODUCT, 2020–2027 (USD MILLION)
TABLE 205 AUSTRALIA: POINT-OF-CARE DIAGNOSTICS MARKET FOR CARDIOMETABOLIC MONITORING PRODUCTS, BY TYPE, 2020–2027 (USD MILLION)
TABLE 206 AUSTRALIA: POINT-OF-CARE DIAGNOSTICS MARKET FOR INFECTIOUS DISEASE TESTING PRODUCTS, BY TYPE, 2020–2027 (USD MILLION)
TABLE 207 AUSTRALIA: POINT-OF-CARE DIAGNOSTICS MARKET FOR COAGULATION MONITORING PRODUCTS, BY TYPE, 2020–2027 (USD MILLION)
TABLE 208 AUSTRALIA: POINT-OF-CARE DIAGNOSTICS MARKET FOR PREGNANCY & FERTILITY TESTING PRODUCTS, BY TYPE, 2020–2027 (USD MILLION)
10.4.5 SOUTH KOREA
10.4.5.1 Increased funding and product development to propel market growth
TABLE 209 SOUTH KOREA: POINT-OF-CARE DIAGNOSTICS MARKET, BY PRODUCT, 2020–2027 (USD MILLION)
TABLE 210 SOUTH KOREA: POINT-OF-CARE DIAGNOSTICS MARKET FOR CARDIOMETABOLIC MONITORING PRODUCTS, BY TYPE, 2020–2027 (USD MILLION)
TABLE 211 SOUTH KOREA: POINT-OF-CARE DIAGNOSTICS MARKET FOR INFECTIOUS DISEASE TESTING PRODUCTS, BY TYPE, 2020–2027 (USD MILLION)
TABLE 212 SOUTH KOREA: POINT-OF-CARE DIAGNOSTICS MARKET FOR COAGULATION MONITORING PRODUCTS, BY TYPE, 2020–2027 (USD MILLION)
TABLE 213 SOUTH KOREA: POINT-OF-CARE DIAGNOSTICS MARKET FOR PREGNANCY & FERTILITY TESTING PRODUCTS, BY TYPE, 2020–2027 (USD MILLION)
10.4.6 REST OF ASIA PACIFIC
TABLE 214 REST OF ASIA PACIFIC: POINT-OF-CARE DIAGNOSTICS MARKET, BY PRODUCT, 2020–2027 (USD MILLION)
TABLE 215 REST OF ASIA PACIFIC: POINT-OF-CARE DIAGNOSTICS MARKET FOR CARDIOMETABOLIC MONITORING PRODUCTS, BY TYPE, 2020–2027 (USD MILLION)
TABLE 216 REST OF ASIA PACIFIC: POINT-OF-CARE DIAGNOSTICS MARKET FOR INFECTIOUS DISEASE TESTING PRODUCTS, BY TYPE, 2020–2027 (USD MILLION)
TABLE 217 REST OF ASIA PACIFIC: POINT-OF-CARE DIAGNOSTICS MARKET FOR COAGULATION MONITORING PRODUCTS, BY TYPE, 2020–2027 (USD MILLION)
TABLE 218 REST OF ASIA PACIFIC: POINT-OF-CARE DIAGNOSTICS MARKET FOR PREGNANCY & FERTILITY TESTING PRODUCTS, BY TYPE, 2020–2027 (USD MILLION)
10.5 LATIN AMERICA
FIGURE 26 LATIN AMERICA: POINT-OF-CARE DIAGNOSTICS MARKET SNAPSHOT
TABLE 219 LATIN AMERICA: POINT-OF-CARE DIAGNOSTICS MARKET, BY COUNTRY, 2020–2027 (USD MILLION)
TABLE 220 LATIN AMERICA: POINT-OF-CARE DIAGNOSTICS MARKET, BY PRODUCT, 2020–2027 (USD MILLION)
TABLE 221 LATIN AMERICA: POINT-OF-CARE DIAGNOSTICS MARKET FOR GLUCOSE MONITORING PRODUCTS, BY TYPE, 2020–2027 (USD MILLION)
TABLE 222 LATIN AMERICA: POINT-OF-CARE DIAGNOSTICS MARKET FOR CARDIOMETABOLIC MONITORING PRODUCTS, BY TYPE, 2020–2027 (USD MILLION)
TABLE 223 LATIN AMERICA: POINT-OF-CARE DIAGNOSTICS MARKET FOR INFECTIOUS DISEASE TESTING PRODUCTS, BY TYPE, 2020–2027 (USD MILLION)
TABLE 224 LATIN AMERICA: POINT-OF-CARE DIAGNOSTICS MARKET FOR COAGULATION MONITORING PRODUCTS, BY TYPE, 2020–2027 (USD MILLION)
TABLE 225 LATIN AMERICA: POINT-OF-CARE DIAGNOSTICS MARKET FOR PREGNANCY & FERTILITY TESTING PRODUCTS, BY TYPE, 2020–2027 (USD MILLION)
TABLE 226 LATIN AMERICA: POINT-OF-CARE DIAGNOSTICS MARKET, BY PLATFORM, 2020–2027 (USD MILLION)
TABLE 227 LATIN AMERICA: POINT-OF-CARE DIAGNOSTICS MARKET, BY MODE OF PURCHASE, 2020–2027 (USD MILLION)
TABLE 228 LATIN AMERICA: POINT-OF-CARE DIAGNOSTICS MARKET, BY END USER, 2020–2027 (USD MILLION)
10.5.1 BRAZIL
10.5.1.1 Rising prevalence of diabetes to support market growth in Brazil
TABLE 229 BRAZIL: POINT-OF-CARE DIAGNOSTICS MARKET, BY PRODUCT, 2020–2027 (USD MILLION)
TABLE 230 BRAZIL: POINT-OF-CARE DIAGNOSTICS MARKET FOR CARDIOMETABOLIC MONITORING PRODUCTS, BY TYPE, 2020–2027 (USD MILLION)
TABLE 231 BRAZIL: POINT-OF-CARE DIAGNOSTICS MARKET FOR INFECTIOUS DISEASE TESTING PRODUCTS, BY TYPE, 2020–2027 (USD MILLION)
TABLE 232 BRAZIL: POINT-OF-CARE DIAGNOSTICS MARKET FOR COAGULATION MONITORING PRODUCTS, BY TYPE, 2020–2027 (USD MILLION)
TABLE 233 BRAZIL: POINT-OF-CARE DIAGNOSTICS MARKET FOR PREGNANCY & FERTILITY TESTING PRODUCTS, BY TYPE, 2020–2027 (USD MILLION)
10.5.2 MEXICO
10.5.2.1 Rising prevalence of diabetes and cancer to support market growth in Mexico
TABLE 234 MEXICO: POINT-OF-CARE DIAGNOSTICS MARKET, BY PRODUCT, 2020–2027 (USD MILLION)
TABLE 235 MEXICO: POINT-OF-CARE DIAGNOSTICS MARKET FOR CARDIOMETABOLIC MONITORING PRODUCTS, BY TYPE, 2020–2027 (USD MILLION)
TABLE 236 MEXICO: POINT-OF-CARE DIAGNOSTICS MARKET FOR INFECTIOUS DISEASE TESTING PRODUCTS, BY TYPE, 2020–2027 (USD MILLION)
TABLE 237 MEXICO: POINT-OF-CARE DIAGNOSTICS MARKET FOR COAGULATION MONITORING PRODUCTS, BY TYPE, 2020–2027 (USD MILLION)
TABLE 238 MEXICO: POINT-OF-CARE DIAGNOSTICS MARKET FOR PREGNANCY & FERTILITY TESTING PRODUCTS, BY TYPE, 2020–2027 (USD MILLION)
10.5.3 REST OF LATIN AMERICA
TABLE 239 REST OF LATIN AMERICA: POINT-OF-CARE DIAGNOSTICS MARKET, BY PRODUCT, 2020–2027 (USD MILLION)
TABLE 240 REST OF LATIN AMERICA: POINT-OF-CARE DIAGNOSTICS MARKET FOR CARDIOMETABOLIC MONITORING PRODUCTS, BY TYPE, 2020–2027 (USD MILLION)
TABLE 241 REST OF LATIN AMERICA: POINT-OF-CARE DIAGNOSTICS MARKET FOR INFECTIOUS DISEASE TESTING PRODUCTS, BY TYPE, 2020–2027 (USD MILLION)
TABLE 242 REST OF LATIN AMERICA: POINT-OF-CARE DIAGNOSTICS MARKET FOR COAGULATION MONITORING PRODUCTS, BY TYPE, 2020–2027 (USD MILLION)
TABLE 243 REST OF LATIN AMERICA: POINT-OF-CARE DIAGNOSTICS MARKET FOR PREGNANCY & FERTILITY TESTING PRODUCTS, BY TYPE, 2020–2027 (USD MILLION)
10.6 MIDDLE EAST & AFRICA
10.6.1 RISING PREVALENCE OF CANCER TO SUPPORT MARKET GROWTH IN THE MEA
TABLE 244 MIDDLE EAST & AFRICA: POINT-OF-CARE DIAGNOSTICS MARKET, BY PRODUCT, 2020–2027 (USD MILLION)
TABLE 245 MIDDLE EAST & AFRICA: POINT-OF-CARE DIAGNOSTICS MARKET FOR GLUCOSE MONITORING PRODUCTS, BY TYPE, 2020–2027 (USD MILLION)
TABLE 246 MIDDLE EAST & AFRICA: POINT-OF-CARE DIAGNOSTICS MARKET FOR CARDIOMETABOLIC MONITORING PRODUCTS, BY TYPE, 2020–2027 (USD MILLION)
TABLE 247 MIDDLE EAST & AFRICA: POINT-OF-CARE DIAGNOSTICS MARKET FOR INFECTIOUS DISEASE TESTING PRODUCTS, BY TYPE, 2020–2027 (USD MILLION)
TABLE 248 MIDDLE EAST & AFRICA: POINT-OF-CARE DIAGNOSTICS MARKET FOR COAGULATION MONITORING PRODUCTS, BY TYPE, 2020–2027 (USD MILLION)
TABLE 249 MIDDLE EAST & AFRICA: POINT-OF-CARE DIAGNOSTICS MARKET FOR PREGNANCY & FERTILITY TESTING PRODUCTS, BY TYPE, 2020–2027 (USD MILLION)
TABLE 250 MIDDLE EAST & AFRICA: POINT-OF-CARE DIAGNOSTICS MARKET, BY PLATFORM, 2020–2027 (USD MILLION)
TABLE 251 MIDDLE EAST & AFRICA: POINT-OF-CARE DIAGNOSTICS MARKET, BY MODE OF PURCHASE, 2020–2027 (USD MILLION)
TABLE 252 MIDDLE EAST & AFRICA: POINT-OF-CARE DIAGNOSTICS MARKET, BY END USER, 2020–2027 (USD MILLION)
11 COMPETITIVE LANDSCAPE (Page No. - 245)
11.1 INTRODUCTION
FIGURE 27 KEY DEVELOPMENTS BY LEADING PLAYERS IN THE POINT-OF-CARE DIAGNOSTICS MARKET, JANUARY 2018–FEBRUARY 2022
11.2 KEY PLAYER STRATEGIES/RIGHT TO WIN
11.3 REVENUE SHARE ANALYSIS
FIGURE 28 REVENUE SHARE ANALYSIS OF THE TOP PLAYERS IN THE POINT-OF-CARE DIAGNOSTICS MARKET
11.4 MARKET SHARE ANALYSIS
FIGURE 29 TOTAL POINT-OF-CARE DIAGNOSTICS MARKET SHARE, BY KEY PLAYER, 2021
FIGURE 30 TOTAL POINT-OF-CARE DIAGNOSTICS (WITHOUT COVID) MARKET SHARE, BY KEY PLAYER, 2021
FIGURE 31 TOTAL POINT-OF-CARE DIAGNOSTICS (ONLY COVID) MARKET SHARE, BY KEY PLAYER, 2021
TABLE 253 POINT-OF-CARE DIAGNOSTICS MARKET: DEGREE OF COMPETITION
11.5 COMPETITIVE LEADERSHIP MAPPING: COMPANY EVALUATION QUADRANT (2021)
11.5.1 STARS
11.5.2 EMERGING LEADERS
11.5.3 PERVASIVE PLAYERS
11.5.4 PARTICIPANTS
FIGURE 32 POINT-OF-CARE DIAGNOSTICS MARKET: COMPETITIVE LEADERSHIP MAPPING (2021)
11.6 COMPETITIVE LEADERSHIP MAPPING: START-UP/ SME EVALUATION QUADRANT (2021)
11.6.1 PROGRESSIVE COMPANIES
11.6.2 RESPONSIVE COMPANIES
11.6.3 DYNAMIC COMPANIES
11.6.4 STARTING BLOCKS
FIGURE 33 POINT OF CARE MARKET: COMPETITIVE LEADERSHIP MAPPING (SMES/START-UPS) (2021)
11.7 COMPETITIVE BENCHMARKING
TABLE 254 COMPANY FOOTPRINT ANALYSIS IN THE POINT-OF-CARE DIAGNOSTICS MARKET
11.8 COMPETITIVE SCENARIO
11.8.1 PRODUCT LAUNCHES & APPROVALS
11.8.2 DEALS
12 COMPANY PROFILES (Page No. - 266)
12.1 KEY PLAYERS
(Business Overview, Products Offered, Recent Developments, and MnM View)*
12.1.1 F. HOFFMANN-LA ROCHE LTD.
TABLE 255 F. HOFFMANN-LA ROCHE LTD.: BUSINESS OVERVIEW
FIGURE 34 F. HOFFMANN-LA ROCHE LTD.: COMPANY SNAPSHOT (2021)
12.1.2 ABBOTT
TABLE 256 ABBOTT: BUSINESS OVERVIEW
FIGURE 35 ABBOTT: COMPANY SNAPSHOT (2021)
12.1.3 SIEMENS HEALTHINEERS AG
TABLE 257 SIEMENS HEALTHINEERS AG: BUSINESS OVERVIEW
FIGURE 36 SIEMENS HEALTHINEERS AG: COMPANY SNAPSHOT (2021)
12.1.4 QUIDEL CORPORATION
TABLE 258 QUIDEL CORPORATION: BUSINESS OVERVIEW
FIGURE 37 QUIDEL CORPORATION: COMPANY SNAPSHOT (2021)
12.1.5 DANAHER CORPORATION
TABLE 259 DANAHER CORPORATION: BUSINESS OVERVIEW
FIGURE 38 DANAHER CORPORATION: COMPANY SNAPSHOT (2020)
12.1.6 BECTON, DICKINSON AND COMPANY
TABLE 260 BECTON, DICKINSON AND COMPANY: BUSINESS OVERVIEW
FIGURE 39 BECTON, DICKINSON AND COMPANY: COMPANY SNAPSHOT (2021)
12.1.7 THERMO FISHER SCIENTIFIC
TABLE 261 THERMO FISHER SCIENTIFIC: BUSINESS OVERVIEW
FIGURE 40 THERMO FISHER SCIENTIFIC: COMPANY SNAPSHOT (2020)
12.1.8 BIOMÉRIEUX S.A.
TABLE 262 BIOMÉRIEUX S.A.: BUSINESS OVERVIEW
FIGURE 41 BIOMÉRIEUX S.A.: COMPANY SNAPSHOT (2020)
12.1.9 CHEMBIO DIAGNOSTICS, INC.
TABLE 263 CHEMBIO DIAGNOSTICS, INC.: BUSINESS OVERVIEW
FIGURE 42 CHEMBIO DIAGNOSTICS: COMPANY SNAPSHOT (2020)
12.1.10 EKF DIAGNOSTICS
TABLE 264 EKF DIAGNOSTICS: BUSINESS OVERVIEW
FIGURE 43 EKF DIAGNOSTICS: COMPANY SNAPSHOT (2020)
12.1.11 TRINITY BIOTECH PLC
TABLE 265 TRINITY BIOTECH PLC: BUSINESS OVERVIEW
FIGURE 44 TRINITY BIOTECH PLC: COMPANY SNAPSHOT (2020)
12.1.12 INSTRUMENTATION LABORATORY (A WERFEN COMPANY)
TABLE 266 INSTRUMENTATION LABORATORY: BUSINESS OVERVIEW
12.1.13 NOVA BIOMEDICAL
TABLE 267 NOVA BIOMEDICAL: BUSINESS OVERVIEW
12.1.14 PTS DIAGNOSTICS
TABLE 268 PTS DIAGNOSTICS: BUSINESS OVERVIEW
12.1.15 SEKISUI DIAGNOSTICS
TABLE 269 SEKISUI DIAGNOSTICS: BUSINESS OVERVIEW
12.1.16 HOLOGIC, INC.
TABLE 270 HOLOGIC, INC.: BUSINESS OVERVIEW
FIGURE 45 HOLOGIC, INC.: COMPANY SNAPSHOT (2021)
12.1.17 QIAGEN
TABLE 271 QIAGEN: BUSINESS OVERVIEW
FIGURE 46 QIAGEN: COMPANY SNAPSHOT (2021)
* Business Overview, Products Offered, Recent Developments, and MnM View might not be captured in case of unlisted companies.
12.2 OTHER PLAYERS
12.2.1 LIFESCAN IP HOLDINGS, LLC
12.2.2 ASCENSIA DIABETES CARE HOLDINGS AG
12.2.3 FLUXERGY
12.2.4 PRESCISION BIOSENSOR, INC.
12.2.5 ACON LABORATORIES, INC.
12.2.6 A. MENARINI DIAGNOSTICS S.R.L
12.2.7 ORASURE TECHNOLOGIES, INC.
12.2.8 MANKIND PHARMA
12.2.9 TERUMO CORPORATION
12.2.10 GRIFOLS, S.A.
12.2.11 DIASORIN S.P.A.
12.2.12 ACCUBIOTECH CO., LTD.
12.2.13 MERIDIAN BIOSCIENCE
12.2.14 BIOCARTIS
12.2.15 GENESTAT MOLECULAR DIAGNOSTICS, LLC.
12.2.16 ELLUME LIMITED
12.2.17 LUCIRA HEALTH, INC.
12.2.18 CUE HEALTH
12.2.19 BINX HEALTH, INC.
12.2.20 MOLBIO DIAGNOSTICS PVT. LTD.
12.2.21 VISBY MEDICAL, INC.
12.2.22 QUIKPATH PTE. LTD.
13 APPENDIX (Page No. - 362)
13.1 DISCUSSION GUIDE
13.2 KNOWLEDGE STORE: MARKETSANDMARKETS’ SUBSCRIPTION PORTAL
13.3 AVAILABLE CUSTOMIZATIONS
13.4 RELATED REPORTS
13.5 AUTHOR DETAILS
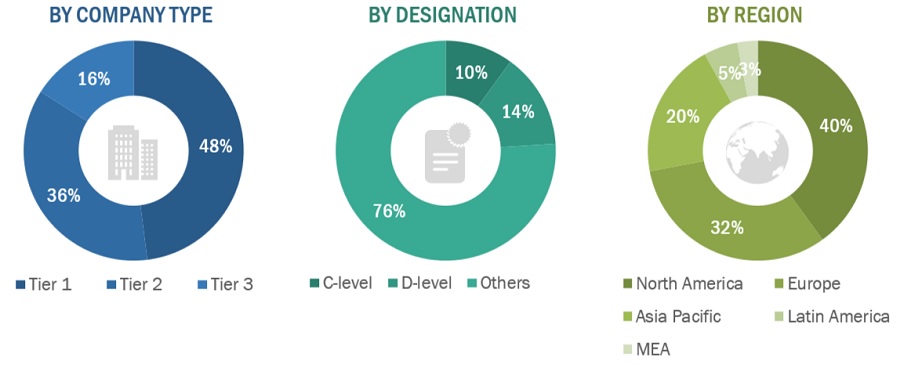
This study involved the extensive use of both primary and secondary sources. The research process involved the study of various factors affecting the industry to identify the segmentation types, industry trends, key players, competitive landscape, fundamental market dynamics, and key player strategies.
The research study involved the extensive use of secondary sources; directories; databases such as D&B Hoovers, Bloomberg Business, and Factiva; white papers; annual reports; company house documents; and SEC filings of companies. Societies and organizations such as the World Health Organization (WHO) and Centers for Disease Control and Prevention (CDC) were also considered while estimating the size of the global point of care diagnostics market.
In the primary research process, various respondents from the supply and demand side were interviewed to obtain qualitative and quantitative information for this report. Primary sources from the supply side include industry experts such as CEOs, vice presidents, marketing directors, technology and innovation directors, and related key executives from various key companies and organizations operating in the point of care diagnostics market. Primary sources from the demand side include research institutes, academic institutes, and pharmaceutical & biotechnology companies.
To know about the assumptions considered for the study, download the pdf brochure
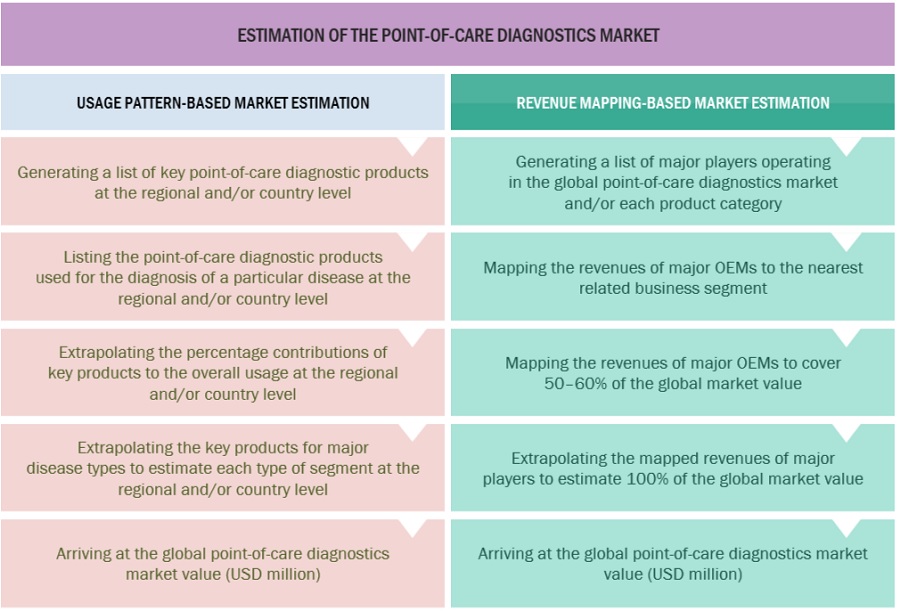
The total size of the point of care diagnostics market was arrived at after data triangulation from four different approaches, as mentioned below. After each approach, the weighted average of the two approaches was taken based on the level of assumptions used in each approach.
The following figure shows the overall market size estimation process employed for this study.
To know about the assumptions considered for the study, Request for Free Sample Report
After arriving at the overall market size from the market size estimation process explained above, the total market was split into several segments. Data triangulation and market breakdown procedures were employed wherever applicable to complete the overall market engineering process and arrive at the exact statistics for all the segments. The data was triangulated by studying various factors and trends from the demand and supply sides. The market was also validated using the top-down and bottom-up approaches.
With the given market data, MarketsandMarkets offers customizations as per the company’s specific needs. The following customization options are available for the present global point of care diagnostics market report:
Growth opportunities and latent adjacency in Point of Care & Rapid Diagnostics Market