Polyetherimide (PEI) Market by Form (Film, Sheet, Granule, Tube, Rod), Grade (Reinforced, Unreinforced), Process Type (Injection Molding, Extrusion, Thermoforming, Compression Molding), End-use Industry, and Region - Global Forecast to 2024


[150 Pages Report] The market for PEI is projected to grow from USD 522 million in 2019 to USD 714 million by 2024, at a CAGR of 6.5% during the forecast period. PEI is a high-performance polymer with both ether links and imide groups in its polymer chain. It is used in high-temperature applications where fast dissipation of heat is essential. Due to its creep resistance, low smoke emission, and flame resistance, the demand for PEI as a thermally conductive plastic has increased significantly. PEI, along with thermally conductive fillers, is a cost-effective solution to metals due to lesser manufacturing steps and joints. PEI is widely used as an alternative to metals in compact electronic gadgets, as it increases the performance of compact electronics by heat dissipation. In addition to the electronics industry, PEI is used in transportation, medical, consumer good, and industrial end-use industries.
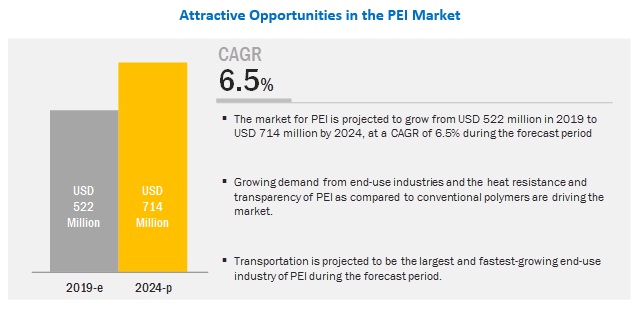
Transportation is projected to be the fastest-growing end-use industry during the forecast period.
The transportation end-use industry is the fastest-growing segment of the polyetherimide (PEI) market. In terms of volume, the transportation end-use industry is estimated to lead the PEI market, while the electrical & electronics segment is estimated to account for the second-largest share of the global polyetherimide (PEI) market. The use of PEI has been increasing due to its ability to replace metal and other thermosets and bulk molding compounds. PEI is apt for applications that require high heat resistance, strength, and chemical resistance. The largest application of PEI is in the electrical and lighting systems, followed by under-the-hood applications.
Reinforced is projected to be the largest grade segment of the PEI market during the forecast period.
Reinforced PEI is formulated to meet the various engineering demands. It can be categorized into two types, namely, glass reinforced and fiber reinforced. Glass reinforced PEI provides greater dimensional stability and improved electrical and mechanical properties while retaining excellent processibility. Fiber reinforced PEI is known for its mechanical strength and hence preferred in applications such as corrosion protection. The major functions of fiber reinforced PEI is to carry the load, provide strength and stiffness, and replace metallic materials in various applications.
PEI sheet is projected to be the largest form segment of the PEI market during the forecast period.
PEI sheet is made of amorphous PEI that is commonly used as high-performance plastic material. This sheet provides good thermal performance as well as high strength & stiffness. PEI sheet is flame retardant, resistant to acids, and can be operated in the presence of steam and hot water. PEI provides high heat resistance, high strength modulus, and good electrical & insulation properties. PEI sheet has low moisture absorption and excellent dimensional stability in a variety of environments. It is internally lubricated by carbon fiber for good friction and wear characteristics.
Injection molding is projected to be the largest segment of the PEI market during the forecast period.
Injection molding is a manufacturing process used for the fabrication of plastic parts. Different varieties of products, in terms of size, application, and complexity, are manufactured using the injection molding process. This process requires an injection molding machine, raw plastic material, and a mold. PEI is used in applications such as medical and electronics due to its strength and rigidity. This amber, high-performance polymer also provides properties such as dimensional stability and chemical resistance. PEI is ideal for environments that include hot air and water, as it is hydrolytically stable, can be resistant to heat for an extended period, and has excellent electrical properties. PEI processed through injection molding is used in applications such as medical devices, instrument trays, and electrical enclosures.
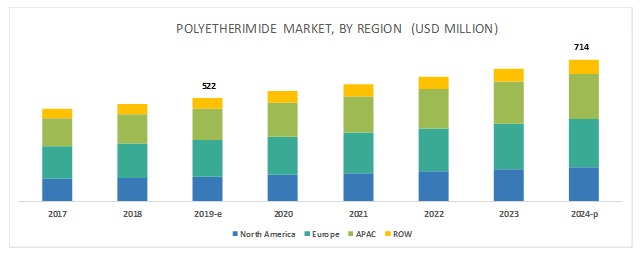
APAC is projected to be the largest market during the forecast period.
APAC is projected to be the largest polyetherimide (PEI) market during the forecast period. There is an increase in the consumption of PEI in various applications due to continued industrialization and growth in the transportation, electronics, and medical sectors of the region. In addition, growing innovation & development and the rising demand for specialty polymers in the industrial sector are driving the use of PEI. The increasing population and growing industrialization are also driving the polyetherimide (PEI) market in China, along with the growing export of different consumer electronics products by China to various European and North American countries.
Key Players
The leading players in the polyetherimide (PEI) market are SABIC (Saudi Arabia), RTP Company (US), Ensinger Plastics (Germany), R�chling Group (Germany), Kuraray Europe (Germany), Mitsubishi Chemical Advanced Materials (Japan), Solvay SA (Belgium), and Toray Industries (Japan). These players adopted expansions, acquisitions, and new product development, as their key growth strategies from 2017 to 2018, which helped them increase their capacities and cater to the widening customer base.
Scope of the Report:
|
Report Metric |
Details |
|
Years considered for the study |
2017�2024 |
|
Base year |
2018 |
|
Forecast period |
2019�2024 |
|
Units considered |
Value (USD Thousand) and Volume (Ton) |
|
Segments |
Grade, Form, Process Type, End-use Industry, and Region |
|
Regions |
North America, APAC, Europe, and RoW |
|
Companies |
SABIC (Saudi Arabia), RTP Company (US), Ensinger Plastics (Germany), R�chling Group (Germany), Kuraray Europe (Germany), Mitsubishi Chemical Advanced Materials (Japan), Solvay SA (Belgium), and Toray Industries (Japan ) among the total 10 major players covered |
This research report categorizes the global PEI market on the basis of grade, form, process type, end-use industry, and region.
On the basis of form:
- Film
- Sheet
- Granule
- Tube
- Rod
On the basis of grade:
- Reinforced
- Unreinforced
On the basis of process type:
- Injection Molding
- Extrusion
- Thermoforming
- Compression Molding
On the basis of end-use industry:
- Transportation
- Electrical & Electronics
- Consumer Goods
- Medical
- Industrial
- Others
On the basis of region:
- North America
- Europe
- APAC
- RoW
The market is further analyzed for the key countries in each of these regions.
Recent Developments
- SABIC (Saudi Arabia) launched polyetherimide (PEI) film - ULTEM film UTF120. This new product is designed to address the increasing need for high energy density capacitors that can store a large amount of electrical energy for a long period without the loss of charge. This product has application in the electrical & electronics end-use industry. Potential applications of the product include automotive components, electrical compressors, LED lighting, and LCD backlight in electronics and film capacitors in renewable energy.
- SABIC announced plans to expand capacity for ULTEM resin production in Singapore, aiming to increase global production by 50%. This has helped the company to localize its production for customers in Asia and meet increasing customer demands.
- RTP Company started a new 86,000 square foot manufacturing facility in Wroclaw, Poland, and this will help the company to support the regional demand and will offer a consistent supply in Europe.
- The R�chling Group inaugurated its second plant in Vadodara with an investment of around 200 million rupees. This expansion will help the company to grow its roots in the Indian subcontinent and meet the demand of the region.
Key Questions Addressed by the Report
- What are the global demand trends for PEI? Will the market witness an increase or decline in demand in the coming years?
- What is the estimated demand for PEI? Which type is used the most in end-use industries?
- What were the revenue pockets for the polyetherimide (PEI) market in 2018?
- What are the upcoming technologies/product areas that will have a significant impact on the market in the future?
- Who are the major PEI manufacturers, globally?
To speak to our analyst for a discussion on the above findings, click Speak to Analyst
 Exclusive indicates content/data unique to MarketsandMarkets and not available with any competitors.
Table of Contents
1 Introduction (Page No. - 20)
1.1 Objectives of the Study
1.2 Market Definition
1.3 Market Scope
1.3.1 Market Segmentation
1.3.2 Regions Covered
1.3.3 Years Considered for the Study
1.4 Currency
1.5 Unit Considered
1.6 Limitations
1.7 Stakeholders
2 Research Methodology (Page No. - 24)
2.1 Research Data
2.1.1 Secondary Data
2.1.1.1 Key Data From Secondary Sources
2.1.2 Primary Data
2.1.2.1 Key Data From Primary Sources
2.1.2.2 Key Industry Insights
2.1.2.3 Breakdown of Primary Interviews
2.2 Market Size Estimation
2.2.1 Bottom-Up Approach
2.2.2 Top-Down Approach
2.3 Data Triangulation
2.4 Assumptions
3 Executive Summary (Page No. - 31)
4 Premium Insights (Page No. - 35)
4.1 Attractive Opportunities in the PEI Market
4.2 Polyetherimide (PEI) Market, By Grade
4.3 PEI Market, By Form
4.4 Polyetherimide (PEI) Market, By Process Type
4.5 PEI Market, By End-Use Industry
4.6 APAC PEI Market, By Grade and Country
4.7 Polyetherimide (PEI) Market, By Key Countries
5 Market Overview (Page No. - 39)
5.1 Introduction
5.2 Market Dynamics
5.2.1 Drivers
5.2.1.1 Increasing Demand From the Transportation Sector
5.2.1.2 Consumption of PEI Over Metals and Other Conventional Polymers
5.2.1.3 Electrification of Vehicles
5.2.1.4 Growth in Emerging Economies
5.2.2 Restraints
5.2.2.1 Lower Thermal Conductivity Than Traditional Materials
5.2.2.2 Increasing Competition From Hybrid Polymers and Composites
5.2.3 Opportunities
5.2.3.1 Emerging Applications of PEI
5.2.4 Challenges
5.2.4.1 Higher Price than that of Conventional Polymers
5.3 Porter�s Five Forces Analysis
5.3.1 Threat of Substitutes
5.3.2 Threat of New Entrants
5.3.3 Bargaining Power of Suppliers
5.3.4 Bargaining Power of Buyers
5.3.5 Intensity of Competitive Rivalry
6 Polyetherimide (PEI) Market, By Grade (Page No. - 45)
6.1 Introduction
6.2 Reinforced
6.2.1 Greater Stability and Improved Physical Properties of Reinforced PEI are Driving Its Demand
6.3 Unreinforced
6.3.1 Rapid Growth in the Aerospace and Medical Industries is Expected to Drive the Unreinforced PEI Market
7 PEI Market, By Process Type (Page No. - 51)
7.1 Introduction
7.2 Injection Molding
7.2.1 PEI Processed Through Injection Molding is Majorly Used in Medical and Electrical Applications Due to Its Strength and Rigidity
7.3 Extrusion
7.3.1 The Excellent Mechanical, thermal, and Electrical Properties of the Extrusion Process is Boosting the PEI Market
7.4 Thermoforming
7.4.1 Cost-Effectiveness, Easy Modification, and Design Freedom of PEI Compounded Through the Thermoforming Process is Driving the PEI Market
7.5 Compression Molding
7.5.1 The Ability to Create Complex Parts is Fueling the Growth of the Compression Molding Segment
8 Polyetherimide (PEI) Market, By Form (Page No. - 58)
8.1 Introduction
8.2 Film
8.2.1 Increasing Demand in CAPACitors is Expected to Drive the PEI Film Market
8.3 Sheet
8.3.1 Favorable Applications in Consumer Goods and Automotive Industries Have A Positive Impact on the PEI Sheet Market
8.4 Granule
8.4.1 PEI Granule�s Stability at High Temperatures and Good Toughness and Strength are Fueling Its Demand
8.5 Tube
8.5.1 The Use of PEI Tube in Medical and Pharmaceuticals Applications is Expected to Drive the Market
8.6 Rod
8.6.1 PEI Rod has Major Applications in Electrical Switchgear, Connectors, and High Voltage Circuit Breaker Housings
9 PEI Market, By End-Use Industry (Page No. - 64)
9.1 Introduction
9.2 Transportation
9.2.1 Automotive
9.2.1.1 The Increase in Consumption of Heat-Resistant Polymers in Automotive Applications is Augmenting the Market Growth
9.2.2 Aerospace
9.2.2.1 The Rise in Demand for Fuel-Efficient and High-Performance Polymers in the Aerospace Sector is Increasing the Demand for PEI
9.3 Electrical & Electronics
9.3.1 Rising Demand in CAPACitor and Molded Interconnect Devices to Foster the Market Growth
9.4 Medical
9.4.1 The Demand for the Latest Material Solution That Meets Safety, Quality, and Regulations is Boosting the PEI Market in This Segment
9.5 Consumer Goods
9.5.1 Replacement of Metal Parts With PEI in A Wide Range of Consumer Goods Products is Driving the Market
9.6 Industrial
9.6.1 Low Maintenance Cost and Long Service Life of PEI is Increasing Its Consumption in the Industrial Sector
9.7 Others
10 Polyetherimide (PEI) Market, By Region (Page No. - 73)
10.1 Introduction
10.2 North America
10.2.1 US
10.2.1.1 Increase in Healthcare Expenditure and Aircraft Production, Along With the Presence of PEI Manufacturers, are Projected to Drive the Market
10.2.2 Canada
10.2.2.1 Increasing Focus on Improving the Efficiency of an Aircraft and the Growth of the Telecommunication Industry is Spurring the Demand for PEI 82
10.2.3 Mexico
10.2.3.1 The Low Operational Cost of Manufacturing and Increasing Focus on Electronic Components are Expected to Boost the Demand for PEI
10.3 Europe
10.3.1 Germany
10.3.1.1 Increasing Investment in Energy-Efficient Products and the Healthcare Sector are Expected to Drive the Demand for PEI
10.3.2 UK
10.3.2.1 Growth in the Transportation Sector is Likely to Increase the Demand for PEI
10.3.3 France
10.3.3.1 Focus on High Value-Added Technologies is Contributing to the Market Growth
10.3.4 Italy
10.3.4.1 Increasing Advancement and Production of Power Electronics, Electric & Hybrid Drivetrains, and Electric Motors are Boosting the Demand for PEI
10.3.5 Spain
10.3.5.1 Demand for Healthcare Products and Increasing Activities in the Automotive Sector are Augmenting the Demand for PEI
10.3.6 Rest of Europe
10.4 APAC
10.4.1 China
10.4.1.1 Programs Such as Made in China 2025 are Expected to Drive the Market for PEI
10.4.2 India
10.4.2.1 Favorable Government Regulations and the Growing Economy of India are Aiding Market Growth
10.4.3 Japan
10.4.3.1 Growing Medical & Healthcare Infrastructure is Increasing the Demand for PEI
10.4.4 South Korea
10.4.4.1 Government Reforms on Tax and Investment in Infrastructure are Fueling the Growth of the PEI Market
10.4.5 Rest of APAC
10.5 RoW
10.5.1 Brazil
10.5.1.1 Government�s Plan to Launch Business-Friendly Programs to Boost Its Economy is Driving the PEI Market
10.5.2 Saudi Arabia
10.5.2.1 The Focus of the Country on Non-Oil Sectors and Reducing the Dependence of Its Economy on the Oil Sector is Driving the Demand for PEI
10.5.3 Argentina
10.5.3.1 Increasing Focus on Industrialization is Expected to Fuel the Demand for PEI
10.5.4 Others
11 Competitive Landscape (Page No. - 128)
11.1 Introduction
11.2 Competitive Scenario
11.2.1 Expansions
11.2.2 Acquisitions
11.2.3 New Product Developments
12 Company Profiles (Page No. - 131)
12.1 SABIC
12.1.1 Business Overview
12.1.2 Products Offered
12.1.3 Recent Developments
12.1.4 SWOT Analysis
12.1.5 MnM View
12.2 RTP Company
12.2.1 Business Overview
12.2.2 Products Offered
12.2.3 Recent Developments
12.2.4 SWOT Analysis
12.2.5 MnM View
12.3 Ensinger Plastics
12.3.1 Business Overview
12.3.2 Products Offered
12.3.3 SWOT Analysis
12.3.4 MnM View
12.4 Solvay SA
12.4.1 Business Overview
12.4.2 Products Offered
12.4.3 SWOT Analysis
12.4.4 MnM View
12.5 Rochling Group
12.5.1 Business Overview
12.5.2 Products Offered
12.5.3 Recent Developments
12.6 Kuraray Europe
12.6.1 Business Overview
12.6.2 Products Offered
12.7 Toray Industries
12.7.1 Business Overview
12.7.2 Products Offered
12.7.3 Recent Developments
12.8 Mitsubishi Chemical Advanced Materials
12.8.1 Business Overview
12.8.2 Products Offered
12.8.3 MnM View
12.8.4 Business Overview
12.8.5 Products Offered
12.9 Polymer Industries
12.9.1 Business Overview
12.9.2 Products Offered
13 Appendix (Page No. - 146)
13.1 Discussion Guide
13.2 Related Reports
13.3 Author Details
List of Tables (161 Tables)
Table 1 Mechanical Properties: Unfilled PEI vs Filled PEI
Table 2 Physical Properties: Unfilled PEI vs Filled PEI
Table 3 Polyetherimide (PEI) Market Size, By Grade, 2017�2024 (Ton)
Table 4 PEI Market Size, By Grade, 2017�2024 (USD Thousand)
Table 5 Reinforced PEI Market Size, By Region, 2017�2024 (Ton)
Table 6 Reinforced PEI Market Size, By Region, 2017�2024 (USD Thousand)
Table 7 Unreinforced PEI Market Size, By Region, 2017�2024 (Ton)
Table 8 Unreinforced PEI Market Size, By Region, 2017�2024 (USD Thousand)
Table 9 PEI Market Size, By Process Type, 2017�2024 (Ton)
Table 10 Polyetherimide (PEI) Market Size, By Process Type, 2017�2024 (USD Thousand)
Table 11 Injection Molding: PEI Market Size, By Region, 2017�2024 (Ton)
Table 12 Injection Molding: PEI Market Size, By Region, 2017�2024 (USD Thousand)
Table 13 Extrusion: PEI Market Size, By Region, 2017�2024 (Ton)
Table 14 Extrusion: PEI Market Size, By Region, 2017�2024 (USD Thousand)
Table 15 Thermoforming: PEI Market Size, By Region, 2017�2024 (Ton)
Table 16 Thermoforming: PEI Market Size, By Region, 2017�2024 (USD Thousand)
Table 17 Compression Molding: PEI Market Size, By Region, 2017�2024 (Ton)
Table 18 Compression Molding: PEI Market Size, By Region, 2017�2024 (USD Thousand)
Table 19 PEI Market Size, By Form, 2017�2024 (Ton)
Table 20 Polyetherimide (PEI) Market Size, By Form, 2017�2024 (USD Thousand)
Table 21 PEI Film Market Size, By Region, 2017�2024 (Ton)
Table 22 Polyetherimide (PEI) Film Market Size, By Region, 2017�2024 (USD Thousand)
Table 23 PEI Sheet Market Size, By Region, 2017�2024 (Ton)
Table 24 Polyetherimide (PEI) Sheet Market Size, By Region, 2017�2024 (USD Thousand)
Table 25 PEI Granule Market Size, By Region, 2017�2024 (Ton)
Table 26 Polyetherimide (PEI) Granule Market Size, By Region, 2017�2024 (USD Thousand)
Table 27 PEI Tube Market Size, By Region, 2017�2024 (Ton)
Table 28 Polyetherimide (PEI) Tube Market Size, By Region, 2017�2024 (USD Thousand)
Table 29 PEI Rod Market Size, By Region, 2017�2024 (Ton)
Table 30 Polyetherimide (PEI) Rod Market Size, By Region, 2017�2024 (USD Thousand)
Table 31 PEI Market Size, By End-Use Industry, 2017�2024 (Ton)
Table 32 Polyetherimide (PEI) Market Size, By End-Use Industry, 2017�2024 (USD Thousand)
Table 33 PEI Market Size in Transportation, By Region, 2017�2024 (Ton)
Table 34 Polyetherimide (PEI) Market Size in Transportation, By Region, 2017�2024 (USD Thousand)
Table 35 PEI Market Size in Electrical & Electronics, By Region, 2017�2024 (Ton)
Table 36 Polyetherimide (PEI) Market Size in Electrical & Electronics, By Region, 2017�2024 (USD Thousand)
Table 37 PEI Market Size in Medical, By Region, 2017�2024 (Ton)
Table 38 Polyetherimide (PEI) Market Size in Medical, By Region, 2017�2024 (USD Thousand)
Table 39 PEI Market Size in Consumer Goods, By Region, 2017�2024 (Ton)
Table 40 Polyetherimide (PEI) Market Size in Consumer Goods, By Region, 2017�2024 (USD Thousand)
Table 41 PEI Market Size in Industrial, By Region, 2017�2024 (Ton)
Table 42 Polyetherimide (PEI) Market Size in Industrial, By Region, 2017�2024 (USD Thousand)
Table 43 PEI Market Size in Other End-Use Industries, By Region, 2017�2024 (Ton)
Table 44 Polyetherimide (PEI) Market Size in Other End-Use Industries, By Region, 2017�2024 (USD Thousand)
Table 45 PEI Market Size, By Region, 2017�2024 (Ton)
Table 46 Polyetherimide (PEI) Market Size, By Region, 2017�2024 (USD Thousand)
Table 47 North America: PEI Market Size, By Country, 2017�2024 (Ton)
Table 48 North America: Polyetherimide (PEI) Market Size, By Country, 2017�2024 (USD Thousand)
Table 49 North America: Polyetherimide Market Size, By Form, 2017�2024 (Ton)
Table 50 North America: Market Size, By Form, 2017�2024 (USD Thousand)
Table 51 North America: Market Size, By Process Type, 2017�2024 (Ton)
Table 52 North America: Market Size, By Process Type, 2017�2024 (USD Thousand)
Table 53 North America: Market Size, By Grade, 2017�2024 (Ton)
Table 54 North America: Market Size, By Grade, 2017�2024 (USD Thousand)
Table 55 North America: Market Size, By End-Use Industry, 2017�2024 (Ton)
Table 56 North America: Market Size, By End-Use Industry, 2017�2024 (USD Thousand)
Table 57 US: PEI Market Size, By Grade, 2017�2024 (Ton)
Table 58 US: Polyetherimide (PEI) Market Size, By Grade, 2017�2024 (USD Thousand)
Table 59 US: Polyetherimide Market Size, By End-Use Industry, 2017�2024 (Ton)
Table 60 US: Market Size, By End-Use Industry, 2017�2024 (USD Thousand)
Table 61 Canada: PEI Market Size, By Grade, 2017�2024 (Ton)
Table 62 Canada: Polyetherimide (PEI) Market Size, By Grade, 2017�2024 (USD Thousand)
Table 63 Canada: Polyetherimide Market Size, By End-Use Industry, 2017�2024 (Ton)
Table 64 Canada: Market Size, By End-Use Industry, 2017�2024 (USD Thousand)
Table 65 Mexico: PEI Market Size, By Grade, 2017�2024 (Ton)
Table 66 Mexico: Polyetherimide (PEI) Market Size, By Grade, 2017�2024 (USD Thousand)
Table 67 Mexico: Polyetherimide Market Size, By End-Use Industry, 2017�2024 (Ton)
Table 68 Mexico: Market Size, By End-Use Industry, 2017�2024 (USD Thousand)
Table 69 Europe: PEI Market Size, By Country, 2017�2024 (Ton)
Table 70 Europe: Polyetherimide (PEI) Market Size, By Country, 2017�2024 (USD Thousand)
Table 71 Europe: Polyetherimide Market Size, By Grade, 2017�2024 (Ton)
Table 72 Europe: Market Size, By Grade, 2017�2024 (USD Thousand)
Table 73 Europe: Market Size, By End-Use Industry, 2017�2024 (Ton)
Table 74 Europe: Market Size, By End-Use Industry, 2017�2024 (USD Thousand)
Table 75 Europe: Market Size, By Form, 2017�2024 (Ton)
Table 76 Europe: Market Size, By Form, 2017�2024 (USD Thousand)
Table 77 Europe: Market Size, By Process Type, 2017�2024 (Ton)
Table 78 Europe: Market Size, By Process Type, 2017�2024 (USD Thousand)
Table 79 Germany: PEI Market Size, By Grade, 2017�2024 (Ton)
Table 80 Germany: Polyetherimide (PEI) Market Size, By Grade, 2017�2024 (USD Thousand)
Table 81 Germany: Polyetherimide Market Size, By End-Use Industry, 2017�2024 (Ton)
Table 82 Germany: Market Size, By End-Use Industry, 2017�2024 (USD Thousand)
Table 83 UK: PEI Market Size, By Grade, 2017�2024 (Ton)
Table 84 UK: Polyetherimide (PEI) Market Size, By Grade, 2017�2024 (USD Thousand)
Table 85 UK: Polyetherimide Market Size, By End-Use Industry, 2017�2024 (Ton)
Table 86 UK: Market Size, By End-Use Industry, 2017�2024 (USD Thousand)
Table 87 France: PEI Market Size, By Grade, 2017�2024 (Ton)
Table 88 France: Polyetherimide (PEI) Market Size, By Grade, 2017�2024 (USD Thousand)
Table 89 France: Polyetherimide Market Size, By End-Use Industry, 2017�2024 (Ton)
Table 90 France: Market Size, By End-Use Industry, 2017�2024 (USD Thousand)
Table 91 Italy: PEI Market Size, By Grade, 2017�2024 (Ton)
Table 92 Italy: Polyetherimide (PEI) Market Size, By Grade, 2017�2024 (USD Thousand)
Table 93 Italy: Polyetherimide Market Size, By End-Use Industry, 2017�2024 (Ton)
Table 94 Italy: Market Size, By End-Use Industry, 2017�2024 (USD Thousand)
Table 95 Spain: PEI Market Size, By Grade, 2017�2024 (Ton)
Table 96 Spain: Polyetherimide (PEI) Market Size, By Grade, 2017�2024 (USD Thousand)
Table 97 Spain: Polyetherimide Market Size, By End-Use Industry, 2017�2024 (Ton)
Table 98 Spain: Market Size, By End-Use Industry, 2017�2024 (USD Thousand)
Table 99 Rest of Europe: PEI Market Size, By Grade, 2017�2024 (Ton)
Table 100 Rest of Europe: Polyetherimide (PEI) Market Size, By Grade, 2017�2024 (USD Thousand)
Table 101 Rest of Europe: Polyetherimide Market Size, By End-Use Industry, 2017�2024 (Ton)
Table 102 Rest of Europe: Market Size, By End-Use Industry, 2017�2024 (USD Thousand)
Table 103 APAC: PEI Market Size, By Country, 2017�2024 (Ton)
Table 104 APAC: Polyetherimide (PEI) Market Size, By Country, 2017�2024 (USD Thousand)
Table 105 APAC: Polyetherimide Market Size, By Grade, 2017�2024 (Ton)
Table 106 APAC: Market Size, By Grade, 2017�2024 (USD Thousand)
Table 107 APAC: Market Size, By Form, 2017�2024 (Ton)
Table 108 APAC: Market Size, By Form, 2017�2024 (USD Thousand)
Table 109 APAC: Market Size, By Process Type, 2017�2024 (Ton)
Table 110 APAC: Market Size, By Process Type, 2017�2024 (USD Thousand)
Table 111 APAC: Market Size, By End-Use Industry, 2017�2024 (Ton)
Table 112 APAC: Market Size, By End-Use Industry, 2017�2024 (USD Thousand)
Table 113 China: PEI Market Size, By Grade, 2017�2024 (Ton)
Table 114 China: Polyetherimide (PEI) Market Size, By Grade, 2017�2024 (USD Thousand)
Table 115 China: Polyetherimide Market Size, By End-Use Industry, 2017�2024 (Ton)
Table 116 China: Market Size, By End-Use Industry, 2017�2024 (USD Thousand)
Table 117 India: PEI Market Size, By Grade, 2017�2024 (Ton)
Table 118 India: Polyetherimide (PEI) Market Size, By Grade, 2017�2024 (USD Thousand)
Table 119 India: Polyetherimide Market Size, By End-Use Industry, 2017�2024 (Ton)
Table 120 India: Market Size, By End-Use Industry, 2017�2024 (USD Thousand)
Table 121 Japan: PEI Market Size, By Grade, 2017�2024 (Ton)
Table 122 Japan: Polyetherimide (PEI) Market Size, By Grade, 2017�2024 (USD Thousand)
Table 123 Japan: Polyetherimide Market Size, By End-Use Industry, 2017�2024 (Ton)
Table 124 Japan: Market Size, By End-Use Industry, 2017�2024 (USD Thousand)
Table 125 South Korea: PEI Market Size, By Grade, 2017�2024 (Ton)
Table 126 South Korea: Polyetherimide (PEI) Market Size, By Grade, 2017�2024 (USD Thousand)
Table 127 South Korea: Polyetherimide Market Size, By End-Use Industry, 2017�2024 (Ton)
Table 128 South Korea: Market Size, By End-Use Industry, 2017�2024 (USD Thousand)
Table 129 Rest of APAC: PEI Market Size, By Grade, 2017�2024 (Ton)
Table 130 Rest of APAC: Polyetherimide (PEI) Market Size, By Grade, 2017�2024 (USD Thousand)
Table 131 Rest of APAC: Polyetherimide Market Size, By End-Use Industry, 2017�2024 (Ton)
Table 132 Rest of APAC: Market Size, By End-Use Industry, 2017�2024 (USD Thousand)
Table 133 RoW: PEI Market Size, By Country, 2017�2024 (Ton)
Table 134 RoW: Polyetherimide (PEI) Market Size, By Country, 2017�2024 (USD Thousand)
Table 135 RoW: Polyetherimide Market Size, By Grade, 2017�2024 (Ton)
Table 136 RoW: Market Size, By Grade, 2017�2024 (USD Thousand)
Table 137 RoW: Market Size, By Form, 2017�2024 (Ton)
Table 138 RoW: Market Size, By Form, 2017�2024 (USD Thousand)
Table 139 RoW: Market Size, By Process Type, 2017�2024 (Ton)
Table 140 RoW: Market Size, By Process Type, 2017�2024 (USD Thousand)
Table 141 RoW: Market Size, By End-Use Industry, 2017�2024 (Ton)
Table 142 RoW: Market Size, By End-Use Industry, 2017�2024 (USD Thousand)
Table 143 Brazil: PEI Market Size, By Grade, 2017�2024 (Ton)
Table 144 Brazil: Polyetherimide (PEI) Market Size, By Grade, 2017�2024 (USD Thousand)
Table 145 Brazil: Polyetherimide Market Size, By End-Use Industry, 2017�2024 (Ton)
Table 146 Brazil: Market Size, By End-Use Industry, 2017�2024 (USD Thousand)
Table 147 Saudi Arabia: PEI Market Size, By Grade, 2017�2024 (Ton)
Table 148 Saudi Arabia: Polyetherimide (PEI) Market Size, By Grade, 2017�2024 (USD Thousand)
Table 149 Saudi Arabia: Polyetherimide Market Size, By End-Use Industry, 2017�2024 (Ton)
Table 150 Saudi Arabia: Market Size, By End-Use Industry, 2017�2024 (USD Thousand)
Table 151 Argentina: PEI Market Size, By Grade, 2017�2024 (Ton)
Table 152 Argentina: Polyetherimide (PEI) Market Size, By Grade, 2017�2024 (USD Thousand)
Table 153 Argentina: Polyetherimide Market Size, By End-Use Industry, 2017�2024 (Ton)
Table 154 Argentina: Market Size, By End-Use Industry, 2017�2024 (USD Thousand)
Table 155 Others: PEI Market Size, By Grade, 2017�2024 (Ton)
Table 156 Others: Polyetherimide (PEI) Market Size, By Grade, 2017�2024 (USD Thousand)
Table 157 Others: Polyetherimide Market Size, By End-Use Industry, 2017�2024 (Ton)
Table 158 Others: Market Size, By End-Use Industry, 2017�2024 (USD Thousand)
Table 159 Expansions, 2017�2018
Table 160 Acquisitions, 2017
Table 161 New Product Developments, 2017
List of Figures (40 Figures)
Figure 1 PEI Market: Research Design
Figure 2 Polyetherimide (PEI) Market: Bottom-Up Approach
Figure 3 Polyetherimide Market: Top-Down Approach
Figure 4 PEI Market: Data Triangulation
Figure 5 Reinforced PEI Was The Larger Grade Segment in the PEI Market in 2018
Figure 6 Film Held the Largest Share in the PEI Market in 2018
Figure 7 Injection Molding Was the Largest Process Type Segment in the PEI Market in 2018
Figure 8 Transportation to Be the Fastest-Growing End-Use Industry of PEI
Figure 9 APAC to Be the Fastest-Growing PEI Market During the Forecast Period
Figure 10 Heat Resistance and Transparency of PEI to Drive the Market Between 2019 and 2024
Figure 11 Reinforced Segment to Register the Highest CAGR
Figure 12 Sheet Segment to Register the Highest CAGR During the Forecast Period
Figure 13 Injection Molding Segment to Register the Highest CAGR During the Forecast Period
Figure 14 Transportation to Be the Fastest-Growing End-Use Industry
Figure 15 Reinforced Segment and China Accounted for the Largest Market Share in APAC in 2018
Figure 16 China to Be the Fastest-Growing Market for PEI
Figure 17 Drivers, Restraints, Opportunities, and Challenges in the PEI Market
Figure 18 PEI Market: Porter�s Five Forces Analysis
Figure 19 Reinforced Segment Dominated the PEI Market in 2018
Figure 20 Injection Molding Segment LED the PEI Market in 2018
Figure 21 Transportation Segment LED the PEI Market in 2018
Figure 22 India is Projected to Be the Fastest-Growing Polyetherimide (PEI) Market
Figure 23 North America: PEI Market Snapshot
Figure 24 APAC: PEI Market Snapshot
Figure 25 Companies Adopted Both Organic and Inorganic Growth Strategies Between 2017 to 2018
Figure 26 Market Evaluation Framework
Figure 27 SABIC: Company Snapshot
Figure 28 SABIC: SWOT Analysis
Figure 29 RTP Company: Company Snapshot
Figure 30 RTP Company: SWOT Analysis
Figure 31 Ensinger Plastics: Company Snapshot
Figure 32 Ensinger Plastics: SWOT Analysis
Figure 33 Solvay SA: Company Snapshot
Figure 34 Solvay SA: SWOT Analysis
Figure 35 Rochling Group: Company Snapshot
Figure 36 Kuraray Europe: Company Snapshot
Figure 37 Toray Industries: Company Snapshot
Figure 38 Mitsubishi Chemical Advanced Materials: Company Snapshot
Figure 39 Encom Polymers: Company Snapshot
Figure 40 Polymer Industries: Company Snapshot
This study involved four major activities to estimate the current market size of PEI. Exhaustive secondary research was carried out to collect information on the peer and parent markets. The next step was to validate these findings, assumptions, and sizing with industry experts across the value chain through primary research. Both top-down and bottom-up approaches were employed to estimate the overall market size. Thereafter, market breakdown and data triangulation were used to estimate the market size of segments and sub-segments.
Secondary Research
In the secondary research process, various sources such as annual reports, press releases, and investor presentations of companies; white papers; publications by recognized websites; and databases were referred to for identifying and collecting information. Secondary research was used to obtain key information about the supply chain of the industry, the total pool of key players, market classification, and segmentation according to the industry trends to the bottom-most level, regional markets, and key developments from both, the market- and technology-oriented perspectives.
Primary Research
The PEI market comprises several stakeholders, such as raw material suppliers, processors, end-product manufacturers, and regulatory organizations in the supply chain. The demand side of this market is characterized by the development of the building & construction, industrial, transportation, power generation, and other industries. The supply side is characterized by advancements in technology and diverse end-use industries. Various primary sources from both the supply and demand sides of the market were interviewed to obtain qualitative and quantitative information.
Following is the breakdown of primary respondents
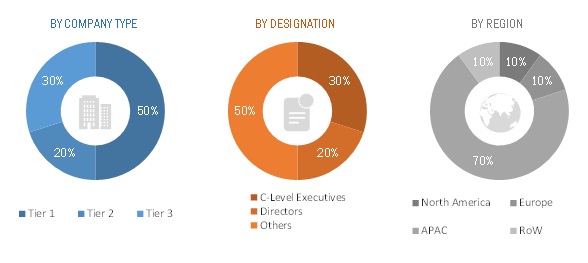
To know about the assumptions considered for the study, download the pdf brochure
Market Size Estimation
Both top-down and bottom-up approaches were used to estimate and validate the size of the global PEI market and to estimate the sizes of various other dependent submarkets. The research methodology used to estimate the market size includes the following:
- The key players in the industry were identified through extensive secondary research.
- The supply chain of the industry and market size, in terms of value and volume, were determined through primary and secondary research.
- All percentage shares were determined using secondary sources and verified through primary sources.
- All possible parameters that affect the markets covered in this research study were accounted for, viewed in extensive detail, verified through primary research, and analyzed to obtain the final quantitative and qualitative data.
- The research includes the study of reports, reviews, and newsletters of key industry players along with extensive interviews with key officials such as directors and marketing executives.
Data Triangulation
After arriving at the total market size through the estimation process, the overall market was split into several segments and sub-segments. The data triangulation and market breakdown procedures were employed, wherever applicable, to complete the overall market size estimation process and arrive at the exact statistics for all segments and sub-segments. The data was triangulated by studying various factors and trends from both the demand and supply sides. In addition, the market size was validated by using the top-down and bottom-up approaches. Then, it was verified through primary interviews. Thus, for every data segment, there were three sources�top-down approach, bottom-up approach, and expert interviews. The data were assumed to be correct when the values arrived at from the three sources matched.
Report Objectives
- To define, describe, and forecast the PEI market size, in terms of value and volume
- To provide detailed information regarding the significant factors (drivers, restraints, opportunities, and challenges) influencing the market growth
- To analyze and forecast the market size based on grade, form, process type, and end-use industry
- To forecast the market size of different segments with respect to five main regions, namely, North America, Europe, Asia Pacific APAC, and RoW
- To analyze the opportunities in the market for stakeholders by identifying the high-growth segments of the market
- To analyze the competitive developments such as expansions, new product developments, and acquisitions
- To strategically profile the key players and comprehensively analyze their growth strategies
Available Customizations:
With the given market data, MarketsandMarkets offers customizations according to the company�s specific needs. The following customization options are available for the report:
Regional Analysis:
- Country-level analysis of the global PEI market
Company Information:
- Detailed analysis and profiles of additional market players
Product Analysis
- Product Matrix, which gives a detailed comparison of the product portfolio of each company


Growth opportunities and latent adjacency in Polyetherimide (PEI) Market