Polyurea Coatings Market by Raw Material Type, Polyurea Type (Pure and Hybrid), Technology (Spraying, Pouring, Hand Mixing) and End-Use (Building & Construction, Transportation, Industrial, Landscape) - Global Forecast to 2030
Updated on : September 02, 2025
Polyurea Coatings Market
The global polyurea coatings market was valued at USD 1.2 billion in 2022 and is projected to reach USD 2.7 billion by 2030, growing at 10.3% cagr from 2022 to 2030. The spraying, by technology segment in Asia Pacific region is expecting a boom in the forecasted period and will lead to an increase in the demand for polyurea coatings.
Attractive Opportunities in the Polyurea Coatings Market
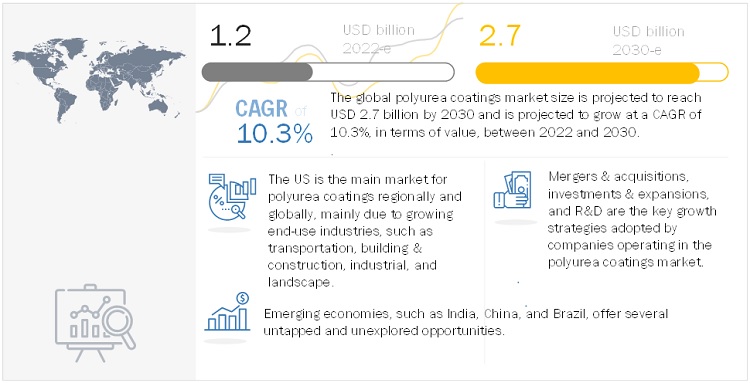
Note: e – estimated, p - projected
Source: Expert Interviews, Secondary Sources, and MarketsandMarkets Analysis
To know about the assumptions considered for the study, Request for Free Sample Report
Polyurea Coatings Market Dynamics
Drivers: Polyurea coatings replacing other competitive systems
As the polyurea coating technology continues to develop, it is expected to substitute the existing coating technologies, such as epoxy and polyurethane. Before polyurea coatings were introduced, polyurethane coatings used to deliver high cure rates when accumulated with catalysts. They were used in a number of industrial and commercial applications, but were sensitive to moisture. Polyurea coatings, due to their superior properties, provide high-quality coating and gloss and are more consistent than other coating technologies.
Restraints: Costlier than competitive coating technologies
Polyurea coatings are expensive when compared to their substitutes, such as epoxy and polyurethane coatings. The increased cost is due to the high cost of raw materials, cost involved in polyurea systems, and high investments made by manufacturers in R&D. The requirement of a skilled workforce during formulations and operations also increases the cost during the application of coatings. However, in the commercial sector, skilled labor and fast curing time can balance the effect of high costs.
Opportunities: Advancement in coating technologies and emerging applications
The polyurea coating technology came into existence almost three decades ago. It has transformed the coatings industry. The unique chemical and physical properties, along with their performance in different application surfaces, such as concrete and metal, have changed the way these coatings were used in various end-use industries. Polyurea coatings have wide usage and can be used in every application where coatings can be applied.
Challenges: Skilled manpower required to handle toxic raw material
Polyurea coatings are two-component coatings with isocyanates as reactive components and resin blend (amine-terminated chain extender) as the second component. Isocyanates are chemicals categorized by chemical formula R (NCO) x; the two most commonly used types are methylene diphenyl diisocyanate (MDI) and toluene diisocyanate (TDI). They are toxic chemical products and can cause health issues and breathing problems to the person exposed to them. The use of such chemicals requires special skill, precautions, and proper training.
Spraying technology accounted for the largest segment of the polyurea coatings market.
Market drivers in this segment are infrastructural growth in various countries, and growth in applications, including polyurea floor coatings, roof coatings, bed-linings, secondary containment, and wastewater treatments. There is strong demand for these applications from the Asia Pacific region, especially from developing countries such as China, India, Thailand, Indonesia, and Malaysia. Global polyurea coating manufacturers are establishing their manufacturing facilities or sales offices in these emerging regions to cater to the increasing demand.
Aliphatic to be fastest-growing raw material segment of the polyurea coatings market between 2022 and 2030
Fsdf The use of aliphatic polyurea coatings in industries such as building & construction and transportation is increasing. Leading manufacturers are coming up with new products to cater to the rising demand in the global market. Aliphatic polyurea is more stable than aromatic isocyanate-based polyurea; it does not change color when exposed to UV light and is weather-resistant. The development of aliphatic isocyanate-based coatings with superior characteristics, such as gloss retention and color stability, has transformed the polyurea polyaspartic coatings market. Most manufacturers have patented the formation technologies of aliphatic polyurea and are regulating its use in different applications; this has resulted in a small market size.
Asia Pacific is the fastest-growing polyurea coatings market.
Asia Pacific is the fastest-growing market for polyurea coatings mainly due to the high economic growth, and heavy investment in industries such as automotive, marine, building & construction, and manufacturing. Kukdo Chemicals (South Korea), Asia Polyurethane (Singapore), and other leading global players are adopting various strategies to increase their market share in the region’s polyurea coatings market.
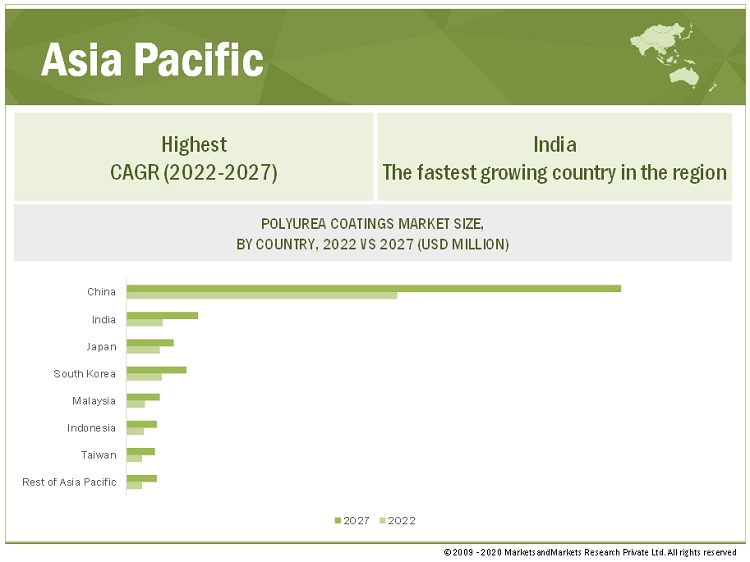
To know about the assumptions considered for the study, download the pdf brochure
Technological advancements in manufacturing processes and techniques
The technological advancements related to the process and techniques involved in the manufacture of polyurea coatings are boosting market growth. The ease in the production processes ultimately lowers the total cost. R&D spending has increased, and manufacturers are coming up with advanced technologies in terms of chemistry with changes in the functioning of the products. Innovations in the formulation of isocyanate components and resin blend (amine-terminated chain extenders) and ongoing technological advancements in the manufacturing process are leading to the development of higher performance properties of polyurea polyaspartic coatings. The introduction of spray and injection technologies for the application of polyurea coatings is increasing their use in various end-use industries.
Polyurea Coatings Market Players
PPG Industries (US), Sherwin-Williams Company (US), Kukdo Chemical Co., Ltd. (South Korea), Nukote Coatings Systems (US), and VIP GmbH (Germany) are the key players in the polyurea coatings market.
Polyurea Coatings Market Report Scope
|
Report Metric |
Details |
|
Years considered for the study |
2018–2027 |
|
Base year |
2021 |
|
Forecast period |
2022–2027 |
|
Units considered |
Value (USD Million/Billion) and Volume (Kiloton) |
|
Segments |
Raw Material Type, Polyurea Type, Technology and End – Use Industry |
|
Regions |
Asia Pacific, North America, Europe, the Middle East & Africa, and South America |
|
Companies |
PPG Industries Inc. (US), Sherwin-Williams Company (US) |
This research report categorizes the polyurea coatings market based on raw material type, polyurea type, technology, end – use industry, and region.
Polyurea Coatings Market based on raw material type:
- Aliphatic
- Aromatic
Polyurea Coatings Market based on polyurea type:
- Pure
- Hybrid
Polyurea Coatings Market based on technology:
- Spraying
- Pouring
- Hand Mixing
Polyurea Coatings Market based on end – use industry:
- Building & Construction
- Transportation
- Industrial
- Landscape
Polyurea Coatings Market based on region:
- Asia Pacific
- North America
- Europe
- Middle East & Africa
- South America
Recent Developments
- In February 2021, The company acquired VersaFlex, which specializes in polyurea, epoxy and polyurethane coatings for water and wastewater infrastructure, polyurea flooring, transportation infrastructure, and industrial applications. Since the date of acquisition, the results of this business have been reported under the protective and marine coatings business within the Performance Coatings reportable business segment.
Frequently Asked Questions (FAQ):
What are the factors influencing the growth of polyurea coatings?
The global polyurea coatings market is driven by the growing use in various end-use industries.
What are the major applications for polyurea coatings?
The major end-use industries of polyurea coatings are building & construction, transportation, industrial and landscape
Who are the major manufacturers?
PPG Industries (US), Sherwin Williams Company (US), Kukdo Chemical Co., Ltd. (South Korea),Nukote Coatings Systems (US), and VIP GmbH(Germany are some of the leading players operating in the global polyurea coatings market.
Why polyurea coatings are gaining market share?
The growth of this market is attributed to the increasing investments made in this region by global chemical companies. .
To speak to our analyst for a discussion on the above findings, click Speak to Analyst

TABLE OF CONTENTS
1 INTRODUCTION (Page No. - 41)
1.1 OBJECTIVES OF THE STUDY
1.2 MARKET DEFINITION
1.2.1 MARKET SCOPE
FIGURE 1 POLYUREA COATINGS MARKET SEGMENTATION
1.2.2 REGIONS COVERED
1.3 MARKET INCLUSIONS AND EXCLUSIONS
1.3.1 MARKET INCLUSIONS
1.3.2 MARKET EXCLUSIONS
1.4 YEARS CONSIDERED FOR THE STUDY
1.5 CURRENCY
1.6 UNIT CONSIDERED
1.7 STAKEHOLDERS
1.8 SUMMARY OF CHANGES
2 RESEARCH METHODOLOGY (Page No. - 45)
2.1 RESEARCH DATA
FIGURE 2 POLYUREA COATINGS MARKET: RESEARCH DESIGN
2.1.1 SECONDARY DATA
2.1.1.1 Critical secondary inputs
2.1.1.2 Key data from secondary sources
2.1.2 PRIMARY DATA
2.1.2.1 Critical primary inputs
2.1.2.2 Key data from primary sources
2.1.2.3 Key primary data sources
2.1.2.4 Key industry insights
2.1.2.5 Breakdown of primary interviews
2.2 MARKET SIZE ESTIMATION
2.2.1 TOP-DOWN APPROACH
FIGURE 3 MARKET SIZE ESTIMATION: TOP-DOWN APPROACH
FIGURE 4 POLYUREA COATINGS MARKET, BY VALUE
FIGURE 5 POLYUREA COATINGS MARKET, BY REGION
FIGURE 6 POLYUREA COATINGS MARKET, BY END-USE INDUSTRY
FIGURE 7 POLYUREA COATINGS MARKET, BY RAW MATERIAL TYPE
2.2.2 BOTTOM-UP APPROACH
FIGURE 8 MARKET SIZE ESTIMATION: BOTTOM-UP APPROACH, BY END-USE INDUSTRY
FIGURE 9 POLYUREA COATINGS MARKET SIZE ESTIMATION, BY END-USE INDUSTRY
2.3 MARKET FORECAST APPROACH
2.3.1 SUPPLY-SIDE FORECAST
FIGURE 10 POLYUREA COATINGS MARKET: SUPPLY-SIDE FORECAST
FIGURE 11 METHODOLOGY FOR SUPPLY-SIDE SIZING OF POLYUREA COATINGS MARKET
2.3.2 DEMAND-SIDE FORECAST
FIGURE 12 POLYUREA COATINGS MARKET: DEMAND-SIDE FORECAST
2.4 FACTOR ANALYSIS
FIGURE 13 FACTOR ANALYSIS OF POLYUREA COATINGS MARKET
2.5 DATA TRIANGULATION
FIGURE 14 POLYUREA COATINGS MARKET: DATA TRIANGULATION
2.6 ASSUMPTIONS
2.7 LIMITATIONS
2.8 GROWTH RATE ASSUMPTIONS/GROWTH FORECAST
3 EXECUTIVE SUMMARY (Page No. - 59)
TABLE 1 POLYUREA COATINGS MARKET SNAPSHOT, 2022 VS. 2027 VS. 2030
FIGURE 15 AROMATIC ISOCYANATE TO BE LARGER SEGMENT DURING FORECAST YEAR
FIGURE 16 PURE POLYUREA TO BE FASTER-GROWING SEGMENT
FIGURE 17 BUILDING & CONSTRUCTION END-USE INDUSTRY TO DOMINATE MARKET
FIGURE 18 SPRAYING TECHNOLOGY TO DOMINATE MARKET
FIGURE 19 ASIA PACIFIC TO BE FASTEST-GROWING POLYUREA COATINGS MARKET
4 PREMIUM INSIGHTS (Page No. - 64)
4.1 ATTRACTIVE OPPORTUNITIES IN POLYUREA COATINGS MARKET
FIGURE 20 POLYUREA COATINGS MARKET TO REGISTER ROBUST GROWTH BETWEEN 2022 AND 2030
4.2 POLYUREA COATINGS MARKET, BY RAW MATERIAL
FIGURE 21 ALIPHATIC ISOCYANATE SEGMENT TO SHOW FASTER GROWTH
4.3 POLYUREA COATINGS MARKET, DEVELOPED VS. EMERGING COUNTRIES
FIGURE 22 EMERGING COUNTRIES TO GROW FASTER THAN DEVELOPED COUNTRIES
4.4 ASIA PACIFIC POLYUREA COATINGS MARKET, BY POLYUREA TYPE AND END-USE INDUSTRY
FIGURE 23 PURE POLYUREA AND BUILDING & CONSTRUCTION SEGMENTS ACCOUNT FOR LARGEST SHARES
4.5 POLYUREA COATINGS MARKET, BY KEY COUNTRIES
FIGURE 24 INDIA TO REGISTER HIGHEST CAGR
5 MARKET OVERVIEW (Page No. - 67)
5.1 INTRODUCTION
5.2 RAW MATERIAL ANALYSIS
FIGURE 25 FORMATION OF POLYUREA COATINGS
5.2.1 ISOCYANATES
5.2.2 RESIN BLEND
5.3 VALUE CHAIN OVERVIEW
5.3.1 VALUE CHAIN ANALYSIS
FIGURE 26 POLYUREA COATINGS – VALUE CHAIN ANALYSIS
TABLE 2 POLYUREA COATINGS MARKET: SUPPLY CHAIN ECOSYSTEM
5.3.2 DISRUPTION IN VALUE CHAIN DUE TO COVID-19
5.3.2.1 Action plan against such vulnerability
5.4 MARKET DYNAMICS
FIGURE 27 DRIVERS, RESTRAINTS, OPPORTUNITIES, AND CHALLENGES IN POLYUREA COATINGS MARKET
5.4.1 DRIVERS
5.4.1.1 Polyurea coatings replacing other competitive coating systems
5.4.1.2 Technological advancements in manufacturing processes and techniques
5.4.1.3 Growing use in various end-use industries
5.4.2 RESTRAINTS
5.4.2.1 Costlier than competitive coating technologies
5.4.3 OPPORTUNITIES
5.4.3.1 Advancements in coating technologies and emerging applications
5.4.3.2 Growing opportunities in Asia Pacific
5.4.4 CHALLENGES
5.4.4.1 Skilled manpower required to handle toxic raw materials
5.4.4.2 Popularity of existing coating technologies
5.5 PORTER’S FIVE FORCES ANALYSIS
FIGURE 28 PORTER’S FIVE FORCES ANALYSIS OF POLYUREA COATINGS MARKET
TABLE 3 POLYUREA COATINGS MARKET: PORTER’S FIVE FORCES ANALYSIS
5.5.1 INTENSITY OF COMPETITIVE RIVALRY
5.5.2 BARGAINING POWER OF BUYERS
5.5.3 BARGAINING POWER OF SUPPLIERS
5.5.4 THREAT OF SUBSTITUTES
5.5.5 THREAT OF NEW ENTRANTS
5.6 KEY STAKEHOLDERS & BUYING CRITERIA
5.6.1 KEY STAKEHOLDERS IN BUYING PROCESS
FIGURE 29 INFLUENCE OF STAKEHOLDERS ON BUYING PROCESS
TABLE 4 INFLUENCE OF STAKEHOLDERS ON BUYING PROCESS FOR TOP INDUSTRIES (%)
5.6.2 BUYING CRITERIA
FIGURE 30 KEY BUYING CRITERIA FOR POLYUREA COATINGS
TABLE 5 KEY BUYING CRITERIA FOR POLYUREA COATINGS
5.7 MACROECONOMIC INDICATORS
5.7.1 INTRODUCTION
5.7.2 GDP TRENDS AND FORECAST
TABLE 6 GDP TRENDS AND FORECAST, PERCENTAGE CHANGE
5.7.2.1 COVID-19 impact on the global economy
5.7.3 TRENDS AND FORECAST OF GLOBAL CONSTRUCTION INDUSTRY
FIGURE 31 GLOBAL SPENDING IN CONSTRUCTION INDUSTRY, 2014–2035
5.7.3.1 COVID-19 impact on construction industry
5.8 TECHNOLOGY OVERVIEW
5.9 CASE STUDY
5.10 AVERAGE PRICING ANALYSIS
FIGURE 32 PRICING ANALYSIS OF POLYUREA COATINGS MARKET, BY REGION, 2021
5.10.1 AVERAGE SELLING PRICE, BY END-USE INDUSTRY
FIGURE 33 AVERAGE SELLING PRICE, BY END-USE INDUSTRY
5.11 KEY COUNTRIES EXPORTING AND IMPORTING POLYUREA COATINGS
TABLE 7 INTENSITY OF TRADE, BY KEY COUNTRIES
5.11.1 EXPORT-IMPORT TRADE STATISTICS
TABLE 8 EXPORT DATA FOR NON-REFRACTORY SURFACING PREPARATIONS FOR FACADES, INSIDE WALLS, FLOORS, CEILINGS (USD THOUSAND)
TABLE 9 IMPORT DATA OF NON-REFRACTORY SURFACING PREPARATIONS FOR FACADES, INSIDE WALLS, FLOORS, CEILINGS (USD THOUSAND)
5.12 SUPPLY CHAIN CRISES SINCE COVID-19
5.13 GLOBAL SCENARIOS
5.13.1 CHINA
5.13.1.1 China’s debt problem
5.13.1.2 Australia-China trade war
5.13.1.3 Environmental commitments
5.13.2 EUROPE
5.13.2.1 Political instability in Germany
5.13.2.2 Energy crisis in Europe
5.14 ECOSYSTEM MAP
FIGURE 34 PAINTS & COATINGS ECOSYSTEM
5.15 TRENDS/DISRUPTIONS IMPACTING CUSTOMERS’ BUSINESSES
FIGURE 35 TRENDS IN END-USE INDUSTRIES IMPACTING STRATEGIES OF COATINGS MANUFACTURERS
5.16 GLOBAL REGULATORY LANDSCAPE
5.16.1 REGULATORY BODIES, GOVERNMENT AGENCIES, AND OTHER ORGANIZATIONS
TABLE 10 NORTH AMERICA: REGULATORY BODIES, GOVERNMENT AGENCIES, AND OTHER ORGANIZATIONS
TABLE 11 EUROPE: REGULATORY BODIES, GOVERNMENT AGENCIES, AND OTHER ORGANIZATIONS
TABLE 12 ASIA PACIFIC: REGULATORY BODIES, GOVERNMENT AGENCIES, AND OTHER ORGANIZATIONS
TABLE 13 REST OF THE WORLD: REGULATORY BODIES, GOVERNMENT AGENCIES, AND OTHER ORGANIZATIONS
5.17 PATENT ANALYSIS
5.17.1 METHODOLOGY
5.17.2 PUBLICATION TRENDS
FIGURE 36 PUBLICATION TRENDS, 2018–2022
5.17.3 INSIGHTS
5.17.4 JURISDICTION ANALYSIS
FIGURE 37 JURISDICTION ANALYSIS OF REGISTERED PATENTS, 2018–2022
5.17.5 TOP APPLICANTS
FIGURE 38 NUMBER OF PATENTS, BY COMPANY, 2018–2022
5.18 COVID-19 IMPACT ANALYSIS
5.18.1 COVID-19 ECONOMIC ASSESSMENT
FIGURE 39 LATEST WORLD ECONOMIC OUTLOOK GROWTH PROJECTIONS
5.18.2 ECONOMIC IMPACT OF COVID-19 – SCENARIO ASSESSMENT
FIGURE 40 FACTORS IMPACTING ECONOMIES OF SELECT G20 COUNTRIES IN 2020
5.19 KEY CONFERENCES & EVENTS IN 2022–2023
TABLE 14 POLYUREA COATINGS MARKET: DETAILED LIST OF CONFERENCES & EVENTS
6 POLYUREA COATINGS MARKET, BY RAW MATERIAL (Page No. - 102)
6.1 INTRODUCTION
FIGURE 41 AROMATIC ISOCYANATE SEGMENT TO HOLD LARGER MARKET SHARE
TABLE 15 POLYUREA COATINGS MARKET SIZE, BY RAW MATERIAL, 2018–2021 (THOUSAND LITERS)
TABLE 16 POLYUREA COATINGS MARKET SIZE, BY RAW MATERIAL, 2022–2027 (THOUSAND LITERS)
TABLE 17 POLYUREA COATINGS MARKET SIZE, BY RAW MATERIAL, 2028–2030 (THOUSAND LITERS)
TABLE 18 POLYUREA COATINGS MARKET SIZE, BY RAW MATERIAL, 2018–2021 (USD MILLION)
TABLE 19 POLYUREA COATINGS MARKET SIZE, BY RAW MATERIAL, 2022–2027 (USD MILLION)
TABLE 20 POLYUREA COATINGS MARKET SIZE, BY RAW MATERIAL, 2028–2030 (USD MILLION)
6.2 AROMATIC ISOCYANATE
6.2.1 GROWTH OF END USE SECTORS TO INFLUENCE MARKET
TABLE 21 AROMATIC ISOCYANATE-BASED POLYUREA COATINGS MARKET SIZE, BY REGION, 2018–2021 (THOUSAND LITERS)
TABLE 22 AROMATIC ISOCYANATE-BASED POLYUREA COATINGS MARKET SIZE, BY REGION, 2022–2027 (THOUSAND LITERS)
TABLE 23 AROMATIC ISOCYANATE-BASED POLYUREA COATINGS MARKET SIZE, BY REGION, 2028–2030 (THOUSAND LITERS)
TABLE 24 AROMATIC ISOCYANATE-BASED POLYUREA COATINGS MARKET SIZE, BY REGION, 2018–2021 (USD MILLION)
TABLE 25 AROMATIC ISOCYANATE-BASED POLYUREA COATINGS MARKET SIZE, BY REGION, 2022–2027 (USD MILLION)
TABLE 26 AROMATIC ISOCYANATE-BASED POLYUREA COATINGS MARKET SIZE, BY REGION, 2028–2030 (USD MILLION)
6.3 ALIPHATIC ISOCYANATE
6.3.1 DEMAND FROM BUILDING & CONSTRUCTION AND TRANSPORTATION INDUSTRIES EXPECTED TO DRIVE MARKET
TABLE 27 ALIPHATIC ISOCYANATE-BASED POLYUREA COATINGS MARKET SIZE, BY REGION, 2018–2021 (THOUSAND LITERS)
TABLE 28 ALIPHATIC ISOCYANATE-BASED POLYUREA COATINGS MARKET SIZE, BY REGION, 2022–2027 (THOUSAND LITERS)
TABLE 29 ALIPHATIC ISOCYANATE-BASED POLYUREA COATINGS MARKET SIZE, BY REGION, 2028–2030 (THOUSAND LITERS)
TABLE 30 ALIPHATIC ISOCYANATE-BASED POLYUREA COATINGS MARKET SIZE, BY REGION, 2018–2021 (USD MILLION)
TABLE 31 ALIPHATIC ISOCYANATE-BASED POLYUREA COATINGS MARKET SIZE, BY REGION, 2022–2027 (USD MILLION)
TABLE 32 ALIPHATIC ISOCYANATE-BASED POLYUREA COATINGS MARKET SIZE, BY REGION, 2028–2030 (USD MILLION)
7 POLYUREA COATINGS MARKET, BY POLYUREA TYPE (Page No. - 110)
7.1 INTRODUCTION
FIGURE 42 PURE POLYUREA TO BE LARGER SEGMENT
TABLE 33 POLYUREA COATINGS MARKET SIZE, BY POLYUREA TYPE, 2018–2021 (THOUSAND LITERS)
TABLE 34 POLYUREA COATINGS MARKET SIZE, BY POLYUREA TYPE, 2022–2027 (THOUSAND LITERS)
TABLE 35 POLYUREA COATINGS MARKET SIZE, BY POLYUREA TYPE, 2028–2030 (THOUSAND LITERS)
TABLE 36 POLYUREA COATINGS MARKET SIZE, BY POLYUREA TYPE, 2018–2021 (USD MILLION)
TABLE 37 POLYUREA COATINGS MARKET SIZE, BY POLYUREA TYPE, 2022–2027 (USD MILLION)
TABLE 38 POLYUREA COATINGS MARKET SIZE, BY POLYUREA TYPE, 2028–2030 (USD MILLION)
7.2 PURE POLYUREA
7.2.1 NEW PRODUCT DEVELOPMENT TO BOOST DEMAND
TABLE 39 PURE POLYUREA COATINGS MARKET SIZE, BY REGION, 2018–2021 (THOUSAND LITERS)
TABLE 40 PURE POLYUREA COATINGS MARKET SIZE, BY REGION, 2022–2027 (THOUSAND LITERS)
TABLE 41 PURE POLYUREA COATINGS MARKET SIZE, BY REGION, 2028–2030 (THOUSAND LITERS)
TABLE 42 PURE POLYUREA COATINGS MARKET SIZE, BY REGION, 2018–2021 (USD MILLION)
TABLE 43 PURE POLYUREA COATINGS MARKET SIZE, BY REGION, 2022–2027 (USD MILLION)
TABLE 44 PURE POLYUREA COATINGS MARKET SIZE, BY REGION, 2028–2030 (USD MILLION)
7.3 HYBRID POLYUREA
7.3.1 GROWTH OF INFRASTRUCTURE SECTOR IN ASIA PACIFIC TO PROPEL MARKET
TABLE 45 HYBRID POLYUREA COATINGS MARKET SIZE, BY REGION, 2018–2021 (THOUSAND LITERS)
TABLE 46 HYBRID POLYUREA COATINGS MARKET SIZE, BY REGION, 2022–2027 (THOUSAND LITERS)
TABLE 47 HYBRID POLYUREA COATINGS MARKET SIZE, BY REGION, 2028–2030 (THOUSAND LITERS)
TABLE 48 HYBRID POLYUREA COATINGS MARKET SIZE, BY REGION, 2018–2021 (USD MILLION)
TABLE 49 HYBRID POLYUREA COATINGS MARKET SIZE, BY REGION, 2022–2027 (USD MILLION)
TABLE 50 HYBRID POLYUREA COATINGS MARKET SIZE, BY REGION, 2028–2030 (USD MILLION)
8 POLYUREA COATINGS MARKET, BY TECHNOLOGY (Page No. - 118)
8.1 INTRODUCTION
FIGURE 43 SPRAYING TECHNOLOGY TO ACCOUNT FOR LARGEST MARKET SHARE
TABLE 51 POLYUREA COATINGS MARKET SIZE, BY TECHNOLOGY, 2018–2021 (THOUSAND LITERS)
TABLE 52 POLYUREA COATINGS MARKET SIZE, BY TECHNOLOGY, 2022–2027 (THOUSAND LITERS)
TABLE 53 POLYUREA COATINGS MARKET SIZE, BY TECHNOLOGY, 2028–2030 (THOUSAND LITERS)
TABLE 54 POLYUREA COATINGS MARKET SIZE, BY TECHNOLOGY, 2018–2021 (USD MILLION)
TABLE 55 POLYUREA COATINGS MARKET SIZE, BY TECHNOLOGY, 2022–2027 (USD MILLION)
TABLE 56 POLYUREA COATINGS MARKET SIZE, BY TECHNOLOGY, 2028–2030 (USD MILLION)
8.2 SPRAYING
8.2.1 MOST WIDELY USED POLYUREA COATING TECHNOLOGY DUE TO GROWING APPLICATIONS
TABLE 57 REGIONAL POLYUREA COATINGS MARKET, BY SPRAYING TECHNOLOGY, 2018–2021 (THOUSAND LITERS)
TABLE 58 REGIONAL POLYUREA COATINGS MARKET, BY SPRAYING TECHNOLOGY 2022–2027 (THOUSAND LITERS)
TABLE 59 REGIONAL POLYUREA COATINGS MARKET, BY SPRAYING TECHNOLOGY 2028–2030 (THOUSAND LITERS)
TABLE 60 REGIONAL POLYUREA COATINGS MARKET, BY SPRAYING TECHNOLOGY 2018–2021 (USD MILLION)
TABLE 61 REGIONAL POLYUREA COATINGS MARKET, BY SPRAYING TECHNOLOGY 2022–2027 (USD MILLION)
TABLE 62 REGIONAL POLYUREA COATINGS MARKET, BY SPRAYING TECHNOLOGY 2028–2030 (USD MILLION)
8.3 POURING
8.3.1 STRINGENT ENVIRONMENTAL REGULATIONS REQUIRING ZERO OR NON-VOC COATINGS TO BOOST DEMAND
TABLE 63 REGIONAL POLYUREA COATINGS MARKET, BY POURING TECHNOLOGY 2018–2021 (THOUSAND LITERS)
TABLE 64 REGIONAL POLYUREA COATINGS MARKET, BY POURING TECHNOLOGY, 2022–2027 (THOUSAND LITERS)
TABLE 65 REGIONAL POLYUREA COATINGS MARKET, BY POURING TECHNOLOGY, 2028–2030 (THOUSAND LITERS)
TABLE 66 REGIONAL POLYUREA COATINGS MARKET, BY POURING TECHNOLOGY, 2018–2021 (USD MILLION)
TABLE 67 REGIONAL POLYUREA COATINGS MARKET, BY POURING TECHNOLOGY, 2022–2027 (USD MILLION)
TABLE 68 REGIONAL POLYUREA COATINGS MARKET, BY POURING TECHNOLOGY, 2028–2030 (USD MILLION)
8.4 HAND MIXING
8.4.1 HIGH DEMAND FOR DECORATIVE FLOORING AND INDUSTRIAL FLOORING APPLICATIONS
TABLE 69 REGIONAL POLYUREA COATINGS MARKET, BY HAND MIXING TECHNOLOGY, 2018–2021 (THOUSAND LITERS)
TABLE 70 REGIONAL POLYUREA COATINGS MARKET, BY HAND MIXING TECHNOLOGY 2022–2027 (THOUSAND LITERS)
TABLE 71 REGIONAL POLYUREA COATINGS MARKET, BY HAND MIXING TECHNOLOGY, 2028–2030 (THOUSAND LITERS)
TABLE 72 REGIONAL POLYUREA COATINGS MARKET, BY HAND MIXING TECHNOLOGY, 2018–2021 (USD MILLION)
TABLE 73 REGIONAL POLYUREA COATINGS MARKET, BY HAND MIXING TECHNOLOGY, 2022–2027 (USD MILLION)
TABLE 74 REGIONAL POLYUREA COATINGS MARKET, BY HAND MIXING TECHNOLOGY, 2028–2030 (USD MILLION)
9 POLYUREA COATINGS MARKET, BY END-USE INDUSTRY (Page No. - 128)
9.1 INTRODUCTION
FIGURE 44 BUILDING & CONSTRUCTION TO BE LARGEST END-USE INDUSTRY OF POLYUREA COATINGS DURING FORECAST YEAR
TABLE 75 POLYUREA COATINGS MARKET SIZE, BY END-USE INDUSTRY,2018–2021 (THOUSAND LITERS)
TABLE 76 POLYUREA COATINGS MARKET SIZE, BY END-USE INDUSTRY, 2022–2027 (THOUSAND LITERS)
TABLE 77 POLYUREA COATINGS MARKET SIZE, BY END-USE INDUSTRY, 2028–2030 (THOUSAND LITERS)
TABLE 78 POLYUREA COATINGS MARKET SIZE, BY END-USE INDUSTRY, 2018–2021 (USD MILLION)
TABLE 79 POLYUREA COATINGS MARKET SIZE, BY END-USE INDUSTRY, 2022–2027 (USD MILLION)
TABLE 80 POLYUREA COATINGS MARKET SIZE, BY END-USE INDUSTRY, 2028–2030 (USD MILLION)
9.2 BUILDING & CONSTRUCTION
9.2.1 INCREASED PER CAPITA INCOME IN EMERGING ECONOMIES TO DRIVE MARKET
TABLE 81 POLYUREA COATINGS MARKET SIZE IN BUILDING & CONSTRUCTION END-USE INDUSTRY, BY REGION, 2018–2021 (THOUSAND LITERS)
TABLE 82 POLYUREA COATINGS MARKET SIZE IN BUILDING & CONSTRUCTION END-USE INDUSTRY, BY REGION, 2022–2027 (THOUSAND LITERS)
TABLE 83 POLYUREA COATINGS MARKET SIZE IN BUILDING & CONSTRUCTION END-USE INDUSTRY, BY REGION, 2028–2030 (THOUSAND LITERS)
TABLE 84 POLYUREA COATINGS MARKET SIZE IN BUILDING & CONSTRUCTION END-USE INDUSTRY, BY REGION, 2018–2021 (USD MILLION)
TABLE 85 POLYUREA COATINGS MARKET SIZE IN BUILDING & CONSTRUCTION END-USE INDUSTRY, BY REGION, 2022–2027 (USD MILLION)
TABLE 86 POLYUREA COATINGS MARKET SIZE IN BUILDING & CONSTRUCTION END-USE INDUSTRY, BY REGION, 2028–2030 (USD MILLION)
9.3 TRANSPORTATION
9.3.1 INCREASING DEMAND FOR REFRIGERATED FOOD TRUCKS TO BOOST MARKET
TABLE 87 POLYUREA COATINGS MARKET SIZE IN TRANSPORTATION END-USE INDUSTRY, BY REGION, 2018–2021 (THOUSAND LITERS)
TABLE 88 POLYUREA COATINGS MARKET SIZE IN TRANSPORTATION END-USE INDUSTRY, BY REGION, 2022–2027 (THOUSAND LITERS)
TABLE 89 POLYUREA COATINGS MARKET SIZE IN TRANSPORTATION END-USE INDUSTRY, BY REGION, 2028–2030 (THOUSAND LITERS)
TABLE 90 POLYUREA COATINGS MARKET SIZE IN TRANSPORTATION END-USE INDUSTRY, BY REGION, 2018–2021 (USD MILLION)
TABLE 91 POLYUREA COATINGS MARKET SIZE IN TRANSPORTATION END-USE INDUSTRY, BY REGION, 2022–2027 (USD MILLION)
TABLE 92 POLYUREA COATINGS MARKET SIZE IN TRANSPORTATION END-USE INDUSTRY, BY REGION, 2028–2030 (USD MILLION)
9.4 INDUSTRIAL
9.4.1 POPULATION GROWTH AND IMPROVED STANDARD OF LIVING TO DRIVE MARKET
TABLE 93 POLYUREA COATINGS MARKET SIZE IN INDUSTRIAL SEGMENT, BY REGION, 2018–2021 (THOUSAND LITERS)
TABLE 94 POLYUREA COATINGS MARKET SIZE IN INDUSTRIAL SEGMENT, BY REGION, 2022–2027 (THOUSAND LITERS)
TABLE 95 POLYUREA COATINGS MARKET SIZE IN INDUSTRIAL SEGMENT, BY REGION, 2028–2030 (THOUSAND LITERS)
TABLE 96 POLYUREA COATINGS MARKET SIZE IN INDUSTRIAL SEGMENT, BY REGION, 2018–2021 (USD MILLION)
TABLE 97 POLYUREA COATINGS MARKET SIZE IN INDUSTRIAL SEGMENT, BY REGION, 2022–2027 (USD MILLION)
TABLE 98 POLYUREA COATINGS MARKET SIZE IN INDUSTRIAL SEGMENT, BY REGION, 2028–2030 (USD MILLION)
9.5 LANDSCAPE
9.5.1 RISING LANDSCAPE-RELATED CONSTRUCTION TO INCREASE DEMAND FOR POLYUREA COATINGS
TABLE 99 POLYUREA COATINGS MARKET SIZE IN LANDSCAPE END-USE INDUSTRY, BY REGION, 2018–2021 (THOUSAND LITERS)
TABLE 100 POLYUREA COATINGS MARKET SIZE IN LANDSCAPE END-USE INDUSTRY, BY REGION, 2022–2027 (THOUSAND LITERS)
TABLE 101 POLYUREA COATINGS MARKET SIZE IN LANDSCAPE END-USE INDUSTRY, BY REGION, 2028–2030 (THOUSAND LITERS)
TABLE 102 POLYUREA COATINGS MARKET SIZE IN LANDSCAPE END-USE INDUSTRY, BY REGION, 2018–2021 (USD MILLION)
TABLE 103 POLYUREA COATINGS MARKET SIZE IN LANDSCAPE END-USE INDUSTRY, BY REGION, 2022–2027 (USD MILLION)
TABLE 104 POLYUREA COATINGS MARKET SIZE IN LANDSCAPE END-USE INDUSTRY, BY REGION, 2028–2030 (USD MILLION)
10 POLYUREA COATINGS MARKET, BY REGION (Page No. - 142)
10.1 INTRODUCTION
FIGURE 45 MIDDLE EAST & AFRICA TO BE FASTEST-GROWING REGION IN POLYUREA COATINGS MARKET
TABLE 105 POLYUREA COATINGS MARKET SIZE, BY REGION, 2018–2021 (THOUSAND LITERS)
TABLE 106 POLYUREA COATINGS MARKET SIZE, BY REGION, 2022–2027 (THOUSAND LITERS)
TABLE 107 POLYUREA COATINGS MARKET SIZE, BY REGION, 2028–2030 (THOUSAND LITERS)
TABLE 108 POLYUREA COATINGS MARKET SIZE, BY REGION, 2018–2021 (USD MILLION)
TABLE 109 POLYUREA COATINGS MARKET SIZE, BY REGION, 2022–2027 (USD MILLION)
TABLE 110 POLYUREA COATINGS MARKET SIZE, BY REGION, 2028–2030 (USD MILLION)
10.2 NORTH AMERICA
FIGURE 46 NORTH AMERICA: POLYUREA COATINGS MARKET SNAPSHOT
TABLE 111 NORTH AMERICA: POLYUREA COATINGS MARKET SIZE, BY RAW MATERIAL, 2018–2021 (THOUSAND LITERS)
TABLE 112 NORTH AMERICA: POLYUREA COATINGS MARKET SIZE, BY RAW MATERIAL, 2022–2027 (THOUSAND LITERS)
TABLE 113 NORTH AMERICA: POLYUREA COATINGS MARKET SIZE, BY RAW MATERIAL, 2028–2030 (THOUSAND LITERS)
TABLE 114 NORTH AMERICA: POLYUREA COATINGS MARKET SIZE, BY RAW MATERIAL, 2018–2021 (USD MILLION)
TABLE 115 NORTH AMERICA: POLYUREA COATINGS MARKET SIZE, BY RAW MATERIAL, 2022–2027 (USD MILLION)
TABLE 116 NORTH AMERICA: POLYUREA COATINGS MARKET SIZE, BY RAW MATERIAL, 2028–2030 (USD MILLION)
TABLE 117 NORTH AMERICA: POLYUREA COATINGS MARKET SIZE, BY POLYUREA TYPE, 2018–2021 (THOUSAND LITERS)
TABLE 118 NORTH AMERICA: POLYUREA COATINGS MARKET SIZE, BY POLYUREA TYPE, 2022–2027 (THOUSAND LITERS)
TABLE 119 NORTH AMERICA: POLYUREA COATINGS MARKET SIZE, BY POLYUREA TYPE, 2028–2030 (THOUSAND LITERS)
TABLE 120 NORTH AMERICA: POLYUREA COATINGS MARKET SIZE, BY POLYUREA TYPE, 2018–2021 (USD MILLION)
TABLE 121 NORTH AMERICA: POLYUREA COATINGS MARKET SIZE, BY POLYUREA TYPE, 2022–2027 (USD MILLION)
TABLE 122 NORTH AMERICA: POLYUREA COATINGS MARKET SIZE, BY POLYUREA TYPE, 2028–2030 (USD MILLION)
TABLE 123 NORTH AMERICA: POLYUREA COATINGS MARKET SIZE, BY TECHNOLOGY, 2018–2021 (THOUSAND LITERS)
TABLE 124 NORTH AMERICA: POLYUREA COATINGS MARKET SIZE, BY TECHNOLOGY, 2022–2027 (THOUSAND LITERS)
TABLE 125 NORTH AMERICA: POLYUREA COATINGS MARKET SIZE, BY TECHNOLOGY, 2028–2030 (THOUSAND LITERS)
TABLE 126 NORTH AMERICA: POLYUREA COATINGS MARKET SIZE, BY TECHNOLOGY, 2018–2021 (USD MILLION)
TABLE 127 NORTH AMERICA: POLYUREA COATINGS MARKET SIZE, BY TECHNOLOGY, 2022–2027 (USD MILLION)
TABLE 128 NORTH AMERICA: POLYUREA COATINGS MARKET SIZE, BY TECHNOLOGY, 2028–2030 (USD MILLION)
TABLE 129 NORTH AMERICA: POLYUREA COATINGS MARKET SIZE, BY END-USE INDUSTRY, 2018–2021 (THOUSAND LITERS)
TABLE 130 NORTH AMERICA: POLYUREA COATINGS MARKET SIZE, BY END-USE INDUSTRY, 2022–2027 (THOUSAND LITERS)
TABLE 131 NORTH AMERICA: POLYUREA COATINGS MARKET SIZE, BY END-USE INDUSTRY, 2028–2030 (THOUSAND LITERS)
TABLE 132 NORTH AMERICA: POLYUREA COATINGS MARKET SIZE, BY END-USE INDUSTRY, 2018–2021 (USD MILLION)
TABLE 133 NORTH AMERICA: POLYUREA COATINGS MARKET SIZE, BY END-USE INDUSTRY, 2022–2027 (USD MILLION)
TABLE 134 NORTH AMERICA: POLYUREA COATINGS MARKET SIZE, BY END-USE INDUSTRY, 2028–2030 (USD MILLION)
TABLE 135 NORTH AMERICA: POLYUREA COATINGS MARKET SIZE, BY COUNTRY, 2018–2021 (THOUSAND LITERS)
TABLE 136 NORTH AMERICA: POLYUREA COATINGS MARKET SIZE, BY COUNTRY, 2022–2027 (THOUSAND LITERS)
TABLE 137 NORTH AMERICA: POLYUREA COATINGS MARKET SIZE, BY COUNTRY, 2028–2030 (THOUSAND LITERS)
TABLE 138 NORTH AMERICA: POLYUREA COATINGS MARKET SIZE, BY COUNTRY, 2018–2021 (USD MILLION)
TABLE 139 NORTH AMERICA: POLYUREA COATINGS MARKET SIZE, BY COUNTRY, 2022–2027 (USD MILLION)
TABLE 140 NORTH AMERICA: POLYUREA COATINGS MARKET SIZE, BY COUNTRY, 2028–2030 (USD MILLION)
10.2.1 US
10.2.1.1 Increase in housing investments and growing exports to emerging countries to drive market
10.2.2 CANADA
10.2.2.1 Growing construction activities and boost to transportation sector to fuel market
10.2.3 MEXICO
10.2.3.1 Changing monetary and fiscal policies to support market growth
10.3 ASIA PACIFIC
FIGURE 47 ASIA PACIFIC: POLYUREA COATINGS MARKET SNAPSHOT
TABLE 141 ASIA PACIFIC: POLYUREA COATINGS MARKET SIZE, BY RAW MATERIAL, 2018–2021 (THOUSAND LITERS)
TABLE 142 ASIA PACIFIC: POLYUREA COATINGS MARKET SIZE, BY RAW MATERIAL, 2022–2027 (THOUSAND LITERS)
TABLE 143 ASIA PACIFIC: POLYUREA COATINGS MARKET SIZE, BY RAW MATERIAL, 2028–2030 (THOUSAND LITERS)
TABLE 144 ASIA PACIFIC: POLYUREA COATINGS MARKET SIZE, BY RAW MATERIAL, 2018–2021 (USD MILLION)
TABLE 145 ASIA PACIFIC: POLYUREA COATINGS MARKET SIZE, BY RAW MATERIAL, 2022–2027 (USD MILLION)
TABLE 146 ASIA PACIFIC: POLYUREA COATINGS MARKET SIZE, BY RAW MATERIAL, 2028–2030 (USD MILLION)
TABLE 147 ASIA PACIFIC: POLYUREA COATINGS MARKET SIZE, BY POLYUREA TYPE, 2018–2021 (THOUSAND LITERS)
TABLE 148 ASIA PACIFIC: POLYUREA COATINGS MARKET SIZE, BY POLYUREA TYPE, 2022–2027 (THOUSAND LITERS)
TABLE 149 ASIA PACIFIC: POLYUREA COATINGS MARKET SIZE, BY POLYUREA TYPE, 2028–2030 (THOUSAND LITERS)
TABLE 150 ASIA PACIFIC: POLYUREA COATINGS MARKET SIZE, BY POLYUREA TYPE, 2018–2021 (USD MILLION)
TABLE 151 ASIA PACIFIC: POLYUREA COATINGS MARKET SIZE, BY POLYUREA TYPE, 2022–2027 (USD MILLION)
TABLE 152 ASIA PACIFIC: POLYUREA COATINGS MARKET SIZE, BY POLYUREA TYPE, 2028–2030 (USD MILLION)
TABLE 153 ASIA PACIFIC: POLYUREA COATINGS MARKET SIZE, BY TECHNOLOGY, 2018–2021 (THOUSAND LITERS)
TABLE 154 ASIA PACIFIC: POLYUREA COATINGS MARKET SIZE, BY TECHNOLOGY, 2022–2027 (THOUSAND LITERS)
TABLE 155 ASIA PACIFIC: POLYUREA COATINGS MARKET SIZE, BY TECHNOLOGY, 2028–2030 (THOUSAND LITERS)
TABLE 156 ASIA PACIFIC: POLYUREA COATINGS MARKET SIZE, BY TECHNOLOGY, 2018–2021 (USD MILLION)
TABLE 157 ASIA PACIFIC: POLYUREA COATINGS MARKET SIZE, BY TECHNOLOGY, 2022–2027 (USD MILLION)
TABLE 158 ASIA PACIFIC: POLYUREA COATINGS MARKET SIZE, BY TECHNOLOGY, 2028–2030 (USD MILLION)
TABLE 159 ASIA PACIFIC: POLYUREA COATINGS MARKET SIZE, BY END-USE INDUSTRY, 2018–2021 (THOUSAND LITERS)
TABLE 160 ASIA PACIFIC: POLYUREA COATINGS MARKET SIZE, BY END-USE INDUSTRY, 2022–2027 (THOUSAND LITERS)
TABLE 161 ASIA PACIFIC: POLYUREA COATINGS MARKET SIZE, BY END-USE INDUSTRY, 2028–2030 (THOUSAND LITERS)
TABLE 162 ASIA PACIFIC: POLYUREA COATINGS MARKET SIZE, BY END-USE INDUSTRY, 2018–2021 (USD MILLION)
TABLE 163 ASIA PACIFIC: POLYUREA COATINGS MARKET SIZE, BY END-USE INDUSTRY, 2022–2027 (USD MILLION)
TABLE 164 ASIA PACIFIC: POLYUREA COATINGS MARKET SIZE, BY END-USE INDUSTRY, 2028–2030 (USD MILLION)
TABLE 165 ASIA PACIFIC: POLYUREA COATINGS MARKET SIZE, BY COUNTRY, 2018–2021 (THOUSAND LITERS)
TABLE 166 ASIA PACIFIC: POLYUREA COATINGS MARKET SIZE, BY COUNTRY, 2022–2027 (THOUSAND LITERS)
TABLE 167 ASIA PACIFIC: POLYUREA COATINGS MARKET SIZE, BY COUNTRY, 2028–2030 (THOUSAND LITERS)
TABLE 168 ASIA PACIFIC: POLYUREA COATINGS MARKET SIZE, BY COUNTRY, 2018–2021 (USD MILLION)
TABLE 169 ASIA PACIFIC: POLYUREA COATINGS MARKET SIZE, BY COUNTRY, 2022–2027 (USD MILLION)
TABLE 170 ASIA PACIFIC: POLYUREA COATINGS MARKET SIZE, BY COUNTRY, 2028–2030 (USD MILLION)
10.3.1 CHINA
10.3.1.1 Increasing foreign investments to propel market
10.3.2 INDIA
10.3.2.1 Rising disposable income and urbanization contribute to demand for polyurea coatings
10.3.3 JAPAN
10.3.3.1 Well-established building & construction industry to boost market
10.3.4 SOUTH KOREA
10.3.4.1 Government initiatives to promote advanced technologies and manufacturing activities support market growth
10.3.5 MALAYSIA
10.3.5.1 Increasing construction activities to boost demand
10.3.6 INDONESIA
10.3.6.1 Rising domestic consumption and FDIs to push market growth
10.3.7 TAIWAN
10.3.7.1 Growing demand for polyurea coatings in construction & infrastructure industry to propel market
10.3.8 REST OF ASIA PACIFIC
10.4 EUROPE
FIGURE 48 EUROPE: POLYUREA COATINGS MARKET SNAPSHOT
TABLE 171 EUROPE: POLYUREA COATINGS MARKET SIZE, BY RAW MATERIAL, 2018–2021 (THOUSAND LITERS)
TABLE 172 EUROPE: POLYUREA COATINGS MARKET SIZE, BY RAW MATERIAL, 2022–2027 (THOUSAND LITERS)
TABLE 173 EUROPE: POLYUREA COATINGS MARKET SIZE, BY RAW MATERIAL, 2028–2030 (THOUSAND LITERS)
TABLE 174 EUROPE: POLYUREA COATINGS MARKET SIZE, BY RAW MATERIAL, 2018–2021 (USD MILLION)
TABLE 175 EUROPE: POLYUREA COATINGS MARKET SIZE, BY RAW MATERIAL, 2022–2027 (USD MILLION)
TABLE 176 EUROPE: POLYUREA COATINGS MARKET SIZE, BY RAW MATERIAL, 2028–2030 (USD MILLION)
TABLE 177 EUROPE: POLYUREA COATINGS MARKET SIZE, BY POLYUREA TYPE, 2018–2021 (THOUSAND LITERS)
TABLE 178 EUROPE: POLYUREA COATINGS MARKET SIZE, BY POLYUREA TYPE, 2022–2027 (THOUSAND LITERS)
TABLE 179 EUROPE: POLYUREA COATINGS MARKET SIZE, BY POLYUREA TYPE, 2028–2030 (THOUSAND LITERS)
TABLE 180 EUROPE: POLYUREA COATINGS MARKET SIZE, BY POLYUREA TYPE, 2018–2021 (USD MILLION)
TABLE 181 EUROPE: POLYUREA COATINGS MARKET SIZE, BY POLYUREA TYPE, 2022–2027 (USD MILLION)
TABLE 182 EUROPE: POLYUREA COATINGS MARKET SIZE, BY POLYUREA TYPE, 2028–2030 (USD MILLION)
TABLE 183 EUROPE: POLYUREA COATINGS MARKET SIZE, BY TECHNOLOGY, 2018–2021 (THOUSAND LITERS)
TABLE 184 EUROPE: POLYUREA COATINGS MARKET SIZE, BY TECHNOLOGY, 2022–2027 (THOUSAND LITERS)
TABLE 185 EUROPE: POLYUREA COATINGS MARKET SIZE, BY TECHNOLOGY, 2028–2030 (THOUSAND LITERS)
TABLE 186 EUROPE: POLYUREA COATINGS MARKET SIZE, BY TECHNOLOGY, 2018–2021 (USD MILLION)
TABLE 187 EUROPE: POLYUREA COATINGS MARKET SIZE, BY TECHNOLOGY, 2022–2027 (USD MILLION)
TABLE 188 EUROPE: POLYUREA COATINGS MARKET SIZE, BY TECHNOLOGY, 2028–2030 (USD MILLION)
TABLE 189 EUROPE: POLYUREA COATINGS MARKET SIZE, BY END-USE INDUSTRY, 2018–2021 (THOUSAND LITERS)
TABLE 190 EUROPE: POLYUREA COATINGS MARKET SIZE, BY END-USE INDUSTRY, 2022–2027 (THOUSAND LITER)
TABLE 191 EUROPE: POLYUREA COATINGS MARKET SIZE, BY END-USE INDUSTRY, 2028–2030 (THOUSAND LITERS)
TABLE 192 EUROPE: POLYUREA COATINGS MARKET SIZE, BY END-USE INDUSTRY, 2018–2021 (USD MILLION)
TABLE 193 EUROPE: POLYUREA COATINGS MARKET SIZE, BY END-USE INDUSTRY, 2022–2027 (USD MILLION)
TABLE 194 EUROPE: POLYUREA COATINGS MARKET SIZE, BY END-USE INDUSTRY, 2028–2030 (USD MILLION)
TABLE 195 EUROPE: POLYUREA COATINGS MARKET SIZE, BY COUNTRY, 2018–2021 (THOUSAND LITERS)
TABLE 196 EUROPE: POLYUREA COATINGS MARKET SIZE, BY COUNTRY, 2022–2027 (THOUSAND LITERS)
TABLE 197 EUROPE: POLYUREA COATINGS MARKET SIZE, BY COUNTRY, 2028–2030 (THOUSAND LITERS)
TABLE 198 EUROPE: POLYUREA COATINGS MARKET SIZE, BY COUNTRY, 2018–2021 (USD MILLION)
TABLE 199 EUROPE: POLYUREA COATINGS MARKET SIZE, BY COUNTRY, 2022–2027 (USD MILLION)
TABLE 200 EUROPE: POLYUREA COATINGS MARKET SIZE, BY COUNTRY, 2028–2030 (USD MILLION)
10.4.1 GERMANY
10.4.1.1 Presence of large number of polyurea coating manufacturers promotes market growth
10.4.2 BENELUX
10.4.2.1 Rising exports and increasing investments in energy and transport infrastructure to fuel market
10.4.3 UK
10.4.3.1 Expanding construction industry to drive market
10.4.4 FRANCE
10.4.4.1 Government construction policies to be growth drivers
10.4.5 SPAIN
10.4.5.1 Increasing construction activities and automotive production to propel market
10.4.6 ITALY
10.4.6.1 Rapidly expanding construction industry to boost market
10.4.7 RUSSIA
10.4.7.1 Government initiatives to expand infrastructure to boost market
10.4.8 REST OF EUROPE
10.5 MIDDLE EAST & AFRICA
FIGURE 49 MIDDLE EAST & AFRICA: POLYUREA COATINGS MARKET SNAPSHOT
TABLE 201 MIDDLE EAST & AFRICA: POLYUREA COATINGS MARKET SIZE, BY RAW MATERIAL, 2018–2021 (THOUSAND LITERS)
TABLE 202 MIDDLE EAST & AFRICA: POLYUREA COATINGS MARKET SIZE, BY RAW MATERIAL, 2022–2027 (THOUSAND LITERS)
TABLE 203 MIDDLE EAST & AFRICA: POLYUREA COATINGS MARKET SIZE, BY RAW MATERIAL, 2028–2030 (THOUSAND LITERS)
TABLE 204 MIDDLE EAST & AFRICA: POLYUREA COATINGS MARKET SIZE, BY RAW MATERIAL, 2018–2021 (USD MILLION)
TABLE 205 MIDDLE EAST & AFRICA: POLYUREA COATINGS MARKET SIZE, BY RAW MATERIAL, 2022–2027 (USD MILLION)
TABLE 206 MIDDLE EAST & AFRICA: POLYUREA COATINGS MARKET SIZE, BY RAW MATERIAL, 2028–2030 (USD MILLION)
TABLE 207 MIDDLE EAST & AFRICA: POLYUREA COATINGS MARKET SIZE, BY POLYUREA TYPE, 2018–2021 (THOUSAND LITERS)
TABLE 208 MIDDLE EAST & AFRICA: POLYUREA COATINGS MARKET SIZE, BY POLYUREA TYPE, 2022–2027 (THOUSAND LITERS)
TABLE 209 MIDDLE EAST & AFRICA: POLYUREA COATINGS MARKET SIZE, BY POLYUREA TYPE, 2028–2030 (THOUSAND LITERS)
TABLE 210 MIDDLE EAST & AFRICA: POLYUREA COATINGS MARKET SIZE, BY POLYUREA TYPE, 2018–2021 (USD MILLION)
TABLE 211 MIDDLE EAST & AFRICA: POLYUREA COATINGS MARKET SIZE, BY POLYUREA TYPE, 2022–2027 (USD MILLION)
TABLE 212 MIDDLE EAST & AFRICA: POLYUREA COATINGS MARKET SIZE, BY POLYUREA TYPE, 2028–2030 (USD MILLION)
TABLE 213 MIDDLE EAST & AFRICA: POLYUREA COATINGS MARKET SIZE, BY TECHNOLOGY, 2018–2021 (THOUSAND LITERS)
TABLE 214 MIDDLE EAST & AFRICA: POLYUREA COATINGS MARKET SIZE, BY TECHNOLOGY, 2022–2027 (THOUSAND LITERS)
TABLE 215 MIDDLE EAST & AFRICA: POLYUREA COATINGS MARKET SIZE, BY TECHNOLOGY, 2028–2030 (THOUSAND LITERS)
TABLE 216 MIDDLE EAST & AFRICA: POLYUREA COATINGS MARKET SIZE, BY TECHNOLOGY, 2018–2021 (USD MILLION)
TABLE 217 MIDDLE EAST & AFRICA: POLYUREA COATINGS MARKET SIZE, BY TECHNOLOGY, 2022–2027 (USD MILLION)
TABLE 218 MIDDLE EAST & AFRICA: POLYUREA COATINGS MARKET SIZE, BY TECHNOLOGY, 2028–2030 (USD MILLION)
TABLE 219 MIDDLE EAST & AFRICA: POLYUREA COATINGS MARKET SIZE, BY END-USE INDUSTRY, 2018–2021 (THOUSAND LITERS)
TABLE 220 MIDDLE EAST & AFRICA: POLYUREA COATINGS MARKET SIZE, BY END-USE INDUSTRY, 2018–2027 (THOUSAND LITER)
TABLE 221 MIDDLE EAST & AFRICA: POLYUREA COATINGS MARKET SIZE, BY END-USE INDUSTRY, 2028–2030 (THOUSAND LITERS)
TABLE 222 MIDDLE EAST & AFRICA: POLYUREA COATINGS MARKET SIZE, BY END-USE INDUSTRY, 2018–2021 (USD MILLION)
TABLE 223 MIDDLE EAST & AFRICA: POLYUREA COATINGS MARKET SIZE, BY END-USE INDUSTRY, 2022–2027 (USD MILLION)
TABLE 224 MIDDLE EAST & AFRICA: POLYUREA COATINGS MARKET SIZE, BY END-USE INDUSTRY, 2028–2030 (USD MILLION)
TABLE 225 MIDDLE EAST & AFRICA: POLYUREA COATINGS MARKET SIZE, BY COUNTRY, 2018–2021 (THOUSAND LITERS)
TABLE 226 MIDDLE EAST & AFRICA: POLYUREA COATINGS MARKET SIZE, BY COUNTRY, 2022–2027 (THOUSAND LITERS)
TABLE 227 MIDDLE EAST & AFRICA: POLYUREA COATINGS MARKET SIZE, BY COUNTRY, 2028–2030 (THOUSAND LITERS)
TABLE 228 MIDDLE EAST & AFRICA: POLYUREA COATINGS MARKET SIZE, BY COUNTRY, 2018–2021 (USD MILLION)
TABLE 229 MIDDLE EAST & AFRICA: POLYUREA COATINGS MARKET SIZE, BY COUNTRY, 2022–2027 (USD MILLION)
TABLE 230 MIDDLE EAST & AFRICA: POLYUREA COATINGS MARKET SIZE, BY COUNTRY, 2028–2030 (USD MILLION)
10.5.1 SAUDI ARABIA
10.5.1.1 Positive performance of construction industry to impact market
10.5.2 UAE
10.5.2.1 Ongoing infrastructure projects contribute to demand
10.5.3 SOUTH AFRICA
10.5.3.1 Rising construction of stadiums and roads adds to market growth
10.5.4 REST OF MIDDLE EAST & AFRICA
10.6 SOUTH AMERICA
FIGURE 50 SOUTH AMERICA: POLYUREA COATINGS MARKET SNAPSHOT
TABLE 231 SOUTH AMERICA: POLYUREA COATINGS MARKET SIZE, BY RAW MATERIAL, 2018–2021 (THOUSAND LITERS)
TABLE 232 SOUTH AMERICA: POLYUREA COATINGS MARKET SIZE, BY RAW MATERIAL, 2022–2027 (THOUSAND LITERS)
TABLE 233 SOUTH AMERICA: POLYUREA COATINGS MARKET SIZE, BY RAW MATERIAL, 2028–2030 (THOUSAND LITERS)
TABLE 234 SOUTH AMERICA: POLYUREA COATINGS MARKET SIZE, BY RAW MATERIAL, 2018–2021 (USD MILLION)
TABLE 235 SOUTH AMERICA: POLYUREA COATINGS MARKET SIZE, BY RAW MATERIAL, 2022–2027 (USD MILLION)
TABLE 236 SOUTH AMERICA: POLYUREA COATINGS MARKET SIZE, BY RAW MATERIAL, 2028–2030 (USD MILLION)
TABLE 237 SOUTH AMERICA: POLYUREA COATINGS MARKET SIZE, BY POLYUREA TYPE, 2018–2021 (THOUSAND LITERS)
TABLE 238 SOUTH AMERICA: POLYUREA COATINGS MARKET SIZE, BY POLYUREA TYPE, 2022–2027 (THOUSAND LITERS)
TABLE 239 SOUTH AMERICA: POLYUREA COATINGS MARKET SIZE, BY POLYUREA TYPE, 2028–2030 (THOUSAND LITERS)
TABLE 240 SOUTH AMERICA: POLYUREA COATINGS MARKET SIZE, BY POLYUREA TYPE, 2018–2021 (USD MILLION)
TABLE 241 SOUTH AMERICA: POLYUREA COATINGS MARKET SIZE, BY POLYUREA TYPE, 2022–2027 (USD MILLION)
TABLE 242 SOUTH AMERICA: POLYUREA COATINGS MARKET SIZE, BY POLYUREA TYPE, 2028–2030 (USD MILLION)
TABLE 243 SOUTH AMERICA: POLYUREA COATINGS MARKET SIZE, BY TECHNOLOGY, 2018–2021 (THOUSAND LITERS)
TABLE 244 SOUTH AMERICA: POLYUREA COATINGS MARKET SIZE, BY TECHNOLOGY, 2022–2027 (THOUSAND LITERS)
TABLE 245 SOUTH AMERICA: POLYUREA COATINGS MARKET SIZE, BY TECHNOLOGY, 2028–2030 (THOUSAND LITERS)
TABLE 246 SOUTH AMERICA: POLYUREA COATINGS MARKET SIZE, BY TECHNOLOGY, 2018–2021 (USD MILLION)
TABLE 247 SOUTH AMERICA: POLYUREA COATINGS MARKET SIZE, BY TECHNOLOGY, 2022–2027 (USD MILLION)
TABLE 248 SOUTH AMERICA: POLYUREA COATINGS MARKET SIZE, BY TECHNOLOGY, 2028–2030 (USD MILLION)
TABLE 249 SOUTH AMERICA: POLYUREA COATINGS MARKET SIZE, BY END-USE INDUSTRY, 2018–2021 (THOUSAND LITERS)
TABLE 250 SOUTH AMERICA: POLYUREA COATINGS MARKET SIZE, BY END-USE INDUSTRY, 2022–2027 (THOUSAND LITERS)
TABLE 251 SOUTH AMERICA: POLYUREA COATINGS MARKET SIZE, BY END-USE INDUSTRY, 2028–2030 (THOUSAND LITERS)
TABLE 252 SOUTH AMERICA: POLYUREA COATINGS MARKET SIZE, BY END-USE INDUSTRY, 2018–2021 (USD MILLION)
TABLE 253 SOUTH AMERICA: POLYUREA COATINGS MARKET SIZE, BY END-USE INDUSTRY, 2022–2027 (USD MILLION)
TABLE 254 SOUTH AMERICA: POLYUREA COATINGS MARKET SIZE, BY END-USE INDUSTRY, 2028–2030 (USD MILLION)
TABLE 255 SOUTH AMERICA: POLYUREA COATINGS MARKET SIZE, BY COUNTRY, 2018–2021 (THOUSAND LITERS)
TABLE 256 SOUTH AMERICA: POLYUREA COATINGS MARKET SIZE, BY COUNTRY, 2022–2027 (THOUSAND LITERS)
TABLE 257 SOUTH AMERICA: POLYUREA COATINGS MARKET SIZE, BY COUNTRY, 2028–2030 (THOUSAND LITERS)
TABLE 258 SOUTH AMERICA: POLYUREA COATINGS MARKET SIZE, BY COUNTRY, 2018–2021 (USD MILLION)
TABLE 259 SOUTH AMERICA: POLYUREA COATINGS MARKET SIZE, BY COUNTRY, 2022–2027 (USD MILLION)
TABLE 260 SOUTH AMERICA: POLYUREA COATINGS MARKET SIZE, BY COUNTRY, 2028–2030 (USD MILLION)
10.6.1 BRAZIL
10.6.1.1 Growth in energy and oil & gas industries promoting demand for polyurea coatings
10.6.2 ARGENTINA
10.6.2.1 High demand for polyurea coatings in construction and automotive industries
10.6.3 COLOMBIA
10.6.3.1 Increasing demand for automobiles positively impacts polyurea coatings market
10.6.4 REST OF SOUTH AMERICA
11 COMPETITIVE LANDSCAPE (Page No. - 203)
11.1 OVERVIEW
TABLE 261 STRATEGIES ADOPTED BY KEY MANUFACTURERS OF POLYUREA COATINGS
11.2 MARKET SHARE ANALYSIS
FIGURE 51 MARKET SHARE ANALYSIS OF KEY PLAYERS, 2021
11.2.1 POLYUREA COATINGS MARKET: DEGREE OF COMPETITION
11.2.2 MARKET RANKING ANALYSIS
FIGURE 52 RANKING OF KEY PLAYERS
11.3 KEY PLAYER STRATEGIES/RIGHT TO WIN
TABLE 262 STRATEGIC POSITIONING OF KEY PLAYERS
11.4 COMPANY REVENUE ANALYSIS
FIGURE 53 REVENUE ANALYSIS OF KEY COMPANIES FOR PAST FIVE YEARS
11.5 COMPETITIVE LEADERSHIP MAPPING, 2021
11.5.1 STARS
11.5.2 EMERGING LEADERS
11.5.3 PERVASIVE PLAYERS
11.5.4 PARTICIPANTS
FIGURE 54 POLYUREA COATINGS MARKET: COMPETITIVE LEADERSHIP MAPPING, 2021
11.6 SME MATRIX, 2021
11.6.1 PROGRESSIVE COMPANIES
11.6.2 DYNAMIC COMPANIES
11.6.3 STARTING BLOCKS
11.6.4 RESPONSIVE COMPANIES
FIGURE 55 POLYUREA COATINGS MARKET: COMPETITIVE LEADERSHIP MAPPING OF EMERGING COMPANIES, 2021
11.7 STRENGTH OF PRODUCT PORTFOLIO
FIGURE 56 PRODUCT PORTFOLIO ANALYSIS OF TOP PLAYERS IN POLYUREA COATINGS MARKET
11.8 BUSINESS STRATEGY EXCELLENCE
FIGURE 57 BUSINESS STRATEGY EXCELLENCE OF TOP PLAYERS IN POLYUREA COATINGS MARKET
11.9 COMPETITIVE BENCHMARKING
TABLE 263 POLYUREA COATINGS MARKET: DETAILED LIST OF KEY PLAYERS
11.10 COMPETITIVE SCENARIO
11.10.1 MARKET EVALUATION FRAMEWORK
TABLE 264 STRATEGIC DEVELOPMENTS, BY COMPANY
TABLE 265 HIGHEST ADOPTED STRATEGIES
TABLE 266 NUMBER OF GROWTH STRATEGIES ADOPTED BY KEY COMPANIES
11.10.2 MARKET EVALUATION MATRIX
TABLE 267 COMPANY INDUSTRY FOOTPRINT
TABLE 268 COMPANY REGION FOOTPRINT
TABLE 269 COMPANY FOOTPRINT
11.11 STRATEGIC DEVELOPMENTS
11.11.1 DEALS
TABLE 270 DEALS, 2018-2022
12 COMPANY PROFILES (Page No. - 218)
(Business Overview, Products Offered, Recent Developments, and MnM View (Key strengths/Right to Win, Strategic Choices Made, and Weaknesses and Competitive Threats))*
12.1 PPG INDUSTRIES INC.
TABLE 271 PPG INDUSTRIES INC.: COMPANY OVERVIEW
FIGURE 58 PPG INDUSTRIES INC.: COMPANY SNAPSHOT
TABLE 272 PPG INDUSTRIES INC.: DEALS
12.2 SHERWIN-WILLIAMS COMPANY
TABLE 273 SHERWIN-WILLIAMS COMPANY: COMPANY OVERVIEW
FIGURE 59 SHERWIN-WILLIAMS COMPANY: COMPANY SNAPSHOT
TABLE 274 SHERWIN-WILLIAMS COMPANY: DEALS
12.3 NUKOTE COATING SYSTEMS
TABLE 275 NUKOTE COATING SYSTEMS: COMPANY OVERVIEW
12.4 ARMORTHANE INC.
TABLE 276 ARMORTHANE INC.: COMPANY OVERVIEW
12.5 WASSER CORPORATION
TABLE 277 WASSER CORPORATION: COMPANY OVERVIEW
12.6 RHINO LININGS CORPORATION
TABLE 278 RHINO LININGS CORPORATION: COMPANY OVERVIEW
12.7 KUKDO CHEMICAL CO., LTD.
TABLE 279 KUKDO CHEMICAL CO., LTD.: COMPANY OVERVIEW
12.8 VOELKEL INDUSTRIAL PRODUCTS GMBH (VIP)
TABLE 280 VOELKEL INDUSTRIAL PRODUCTS GMBH (VIP): COMPANY OVERVIEW
12.9 TEKNOS
TABLE 281 TEKNOS: COMPANY OVERVIEW
FIGURE 60 TEKNOS: COMPANY SNAPSHOT
12.1 OTHER COMPANIES
12.10.1 POLYCOAT PRODUCTS LLC
TABLE 282 POLYCOAT PRODUCTS LLC: COMPANY OVERVIEW
12.10.2 TECHNOPOL
TABLE 283 TECHNOPOL: COMPANY OVERVIEW
12.10.3 SATYEN POLYMERS PVT. LTD
TABLE 284 SATYEN POLYMERS PVT. LTD.: COMPANY OVERVIEW
12.10.4 PROKOL PROTECTIVE COATINGS
TABLE 285 PROKOL PROTECTIVE COATINGS: COMPANY OVERVIEW
12.10.5 CIPY POLYURETHANES PVT. LTD.
TABLE 286 CIPY POLYURETHANES PVT. LTD: COMPANY OVERVIEW
12.10.6 ULTIMATE LININGS
TABLE 287 ULTIMATE LININGS: COMPANY OVERVIEW
12.10.7 ZHUHAI FEIYANG NOVEL MATERIALS CO. LTD.
TABLE 288 ZHUHAI FEIYANG NOVEL MATERIALS CO. LTD: COMPANY OVERVIEW
12.10.8 CHEMLINE INC.
TABLE 289 CHEMLINE INC.: COMPANY OVERVIEW
12.10.9 DURAAMEN ENGINEERED PRODUCTS INC.
TABLE 290 DURAAMEN ENGINEERED PRODUCTS INC.: COMPANY OVERVIEW
12.10.10 KRYPTON CHEMICAL
TABLE 291 KRYPTON CHEMICAL: COMPANY OVERVIEW
12.10.11 ELASTOTHANE LTD
TABLE 292 ELASTOTHANE LTD: COMPANY OVERVIEW
12.10.12 ISOMAT S.A.
TABLE 293 ISOMAT S.A.: COMPANY OVERVIEW
*Details on Business Overview, Products Offered, Recent Developments, and MnM View (Key strengths/Right to Win, Strategic Choices Made, and Weaknesses and Competitive Threats) might not be captured in case of unlisted companies.
13 ADJACENT/RELATED MARKETS (Page No. - 247)
13.1 INTRODUCTION
13.2 LIMITATIONS
13.3 PAINTS & COATINGS ECOSYSTEM AND INTERCONNECTED MARKETS
FIGURE 61 PAINTS & COATINGS: ECOSYSTEM
13.4 COATING RESINS
13.4.1 MARKET DEFINITION
13.4.2 MARKET OVERVIEW
13.4.3 COATING RESINS MARKET, BY RESIN TYPE
TABLE 294 COATING RESINS MARKET SIZE, BY RESIN TYPE, 2017–2020 (USD MILLION)
TABLE 295 COATING RESINS MARKET SIZE, BY RESIN TYPE, 2021–2026 (USD MILLION)
TABLE 296 COATING RESINS MARKET SIZE, BY RESIN TYPE, 2017–2020 (KILOTONS)
TABLE 297 COATING RESINS MARKET SIZE, BY RESIN TYPE, 2021–2026 (KILOTONS)
13.5 ACRYLIC
13.5.1 LARGEST CATEGORY OF BINDER RESINS USED FOR COATING APPLICATIONS
13.6 ALKYD
13.6.1 HIGHER RESISTANCE PROPERTY OF ALKYD RESINS TO DRIVE GROWTH
13.7 VINYL
13.7.1 DEVELOPMENT OF DISPERSION TYPE OF VINYL RESINS TO BOOST THIS SEGMENT
13.8 POLYURETHANE
13.8.1 HIGH-PERFORMANCE CHARACTERISTICS OF POLYURETHANE TO BOOST MARKET GROWTH
13.9 EPOXY
13.9.1 USE OF EPOXY RESINS IN DIVERSE APPLICATIONS TO DRIVE GROWTH
13.10 POLYESTER
13.10.1 UNSATURATED POLYESTER
13.10.1.1 Ease of manufacturing and its cost-effectiveness to propel demand for unsaturated polyesters
13.10.2 SATURATED POLYESTER
13.10.2.1 Increasing use of saturated polyester resins to drive market
13.11 AMINO
13.11.1 EXCELLENT TENSILE STRENGTH, HARDNESS, AND IMPACT RESISTANCE TO BOOST DEMAND FOR AMINO RESINS
13.12 OTHERS
13.12.1 COATING RESINS MARKET, BY TECHNOLOGY
TABLE 298 COATING RESINS MARKET SIZE, BY TECHNOLOGY, 2017–2020 (USD MILLION)
TABLE 299 COATING RESINS MARKET SIZE, BY TECHNOLOGY, 2021–2026 (USD MILLION)
TABLE 300 COATING RESINS MARKET SIZE, BY TECHNOLOGY, 2017–2020 (KILOTONS)
TABLE 301 COATING RESINS MARKET SIZE, BY TECHNOLOGY, 2021–2026 (KILOTONS)
13.12.1.1 Waterborne coatings
FIGURE 62 TYPES OF WATERBORNE COATINGS
13.12.1.2 Solvent-borne coatings
TABLE 302 TRADITIONAL FORMULATION SOLVENT USED FOR EACH RESIN TYPE
13.12.1.3 Powder coatings
FIGURE 63 TYPES OF POWDER COATINGS
13.12.1.4 Others
13.12.1.4.1 High solids coatings
FIGURE 64 TYPES OF HIGH SOLIDS COATINGS
13.12.1.4.2 Radiation curable coatings
FIGURE 65 TYPES OF RADIATION CURABLE COATINGS
13.12.2 COATING RESINS MARKET, BY APPLICATION
TABLE 303 COATING RESINS MARKET SIZE, BY APPLICATION, 2017–2020 (USD MILLION)
TABLE 304 COATING RESINS MARKET SIZE, BY APPLICATION, 2021–2026 (USD MILLION)
TABLE 305 COATING RESINS MARKET SIZE, BY APPLICATION, 2017–2020 (KILOTONS)
TABLE 306 COATING RESINS MARKET SIZE, BY APPLICATION, 2021–2026 (KILOTONS)
TABLE 307 ARCHITECTURAL COATING RESINS MARKET SIZE, BY SUB-APPLICATION, 2017–2020 (USD MILLION)
TABLE 308 ARCHITECTURAL COATING RESINS MARKET SIZE, BY SUB-APPLICATION, 2021–2026 (USD MILLION)
TABLE 309 ARCHITECTURAL COATING RESINS MARKET SIZE, BY SUB-APPLICATION, 2017–2020 (KILOTONS)
TABLE 310 ARCHITECTURAL COATING RESINS MARKET SIZE, BY SUB-APPLICATION, 2021–2026 (KILOTONS)
TABLE 311 INDUSTRIAL COATING RESINS MARKET SIZE, BY SUB-APPLICATION, 2017–2020 (USD MILLION)
TABLE 312 INDUSTRIAL COATING RESINS MARKET SIZE, BY SUB-APPLICATION, 2021–2026 (USD MILLION)
TABLE 313 INDUSTRIAL COATING RESINS MARKET SIZE, BY SUB-APPLICATION, 2017–2020 (KILOTONS)
TABLE 314 INDUSTRIAL COATING RESINS MARKET SIZE, BY SUB-APPLICATION, 2021–2026 (KILOTONS)
13.12.2.1 Architectural coatings
13.12.2.2 Marine & protective coatings
13.12.2.3 General industrial coatings
13.12.2.4 Automotive coatings
13.12.2.5 Wood coatings
13.12.2.6 Packaging coatings
13.12.2.7 Others
13.12.2.7.1 Coil
13.12.2.7.2 Aerospace
13.12.2.7.3 Graphic arts
13.12.3 COATING RESINS MARKET, BY REGION
TABLE 315 COATING RESINS MARKET SIZE, BY REGION, 2017–2020 (USD MILLION)
TABLE 316 COATING RESINS MARKET SIZE, BY REGION, 2021–2026 (USD MILLION)
TABLE 317 COATING RESINS MARKET SIZE, BY REGION, 2017–2020 (KILOTONS)
TABLE 318 COATING RESINS MARKET SIZE, BY REGION, 2021–2026 (KILOTONS)
13.12.3.1 Asia Pacific
13.12.3.2 Europe
13.12.3.3 North America
13.12.3.4 Middle East & Africa
13.12.3.5 South America
14 APPENDIX (Page No. - 268)
14.1 DISCUSSION GUIDE
14.2 KNOWLEDGE STORE: MARKETSANDMARKETS’ SUBSCRIPTION PORTAL
14.3 AVAILABLE CUSTOMIZATION
14.4 RELATED REPORTS
14.5 AUTHOR DETAILS
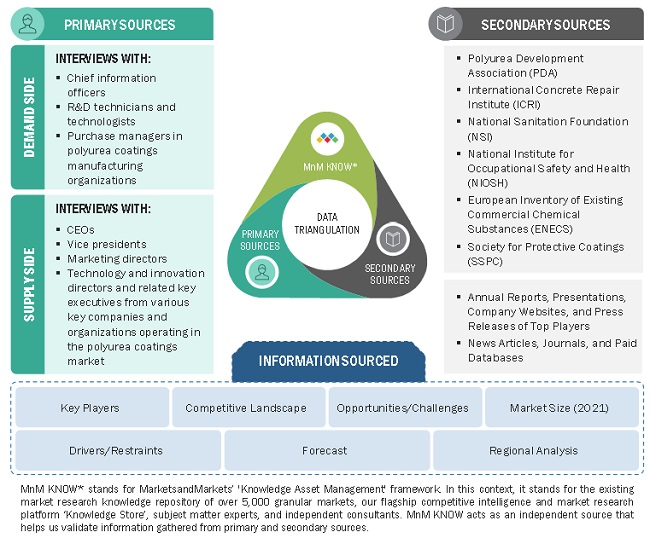
The study involved four major activities in estimating the current market size of polyurea coatings. Exhaustive secondary research was done to collect information on the market, the peer market, and the parent market. The next step was to validate these findings, assumptions, and sizing with industry experts across the value chain through primary research. Both top-down and bottom-up approaches were employed to estimate the complete market size. After that, the market breakdown and data triangulation methods were used to estimate the size of the segments and subsegments of the overall market.
Secondary Research
Secondary sources include annual reports of companies, press releases, investor presentations, white papers, articles by recognized authors, and databases, such as D&B, Bloomberg, Chemical Weekly, and Factiva; and publications and databases from associations, including the National Institute for Occupational Safety and Health (NIOSH), Polyurea Development Association (PDA), United States Environmental Protection Agency (USEPA), Society for Protective Coatings (SSPC), and European Inventory of Existing Commercial Chemical Substances (EINECS).
Primary Research
In the primary research process, experts from the supply and demand sides have been interviewed to obtain qualitative and quantitative information and validate the data for this report. Primary sources from the supply side include industry experts, such as chief executive officers (CEOs), vice presidents (VPs), marketing directors, technology and innovation directors, and related key executives from various key companies and organizations operating in the polyurea coatings market. Extensive primary research has been conducted to gather information and validate the market numbers arrived at. Primary research has also been conducted to identify market segmentation and industry trends.
Following is the breakdown of primary respondents:
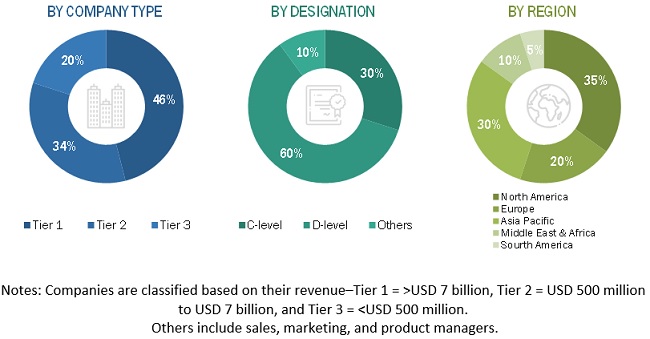
To know about the assumptions considered for the study, download the pdf brochure
Top-Down Approach
The top-down approach used to estimate the market size included the following steps:
- The market size was assessed from the supply side. First, from the secondary sources, the overall high-performance anti-corrosion coatings market size was noted, and then, consumption across various end-use industries was ascertained. This helped quantify the overall polyurea coatings market in the global high-performance anti-corrosion coatings market. The penetration of the market in different regions was determined through secondary research and interactions with industry experts.
- Ascertaining the share of various polyurea coating technologies in the overall polyurea coatings market led to quantifying the market size in terms of volume.
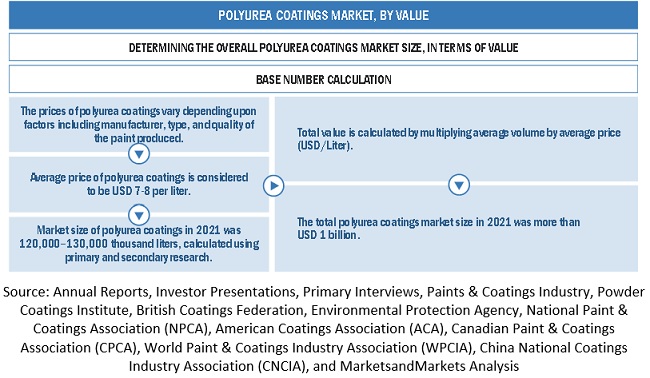
- The contribution/share of different polyurea coating technologies, such as water-based, solvent-based, and powder-based, in the global market was assessed. Thus, the share of the polyurea coatings market in the high-performance anti-corrosion coatings market was ascertained based on insights provided by industry experts and data obtained from secondary research. The overall market size of polyurea coatings was then estimated from the overall high-performance anti-corrosion coatings market, in terms of volume. Then, by multiplying the market size (by volume) with the average price of polyurea coatings, the market was estimated in terms of value.
Market Size Estimation: Top-Down Approach
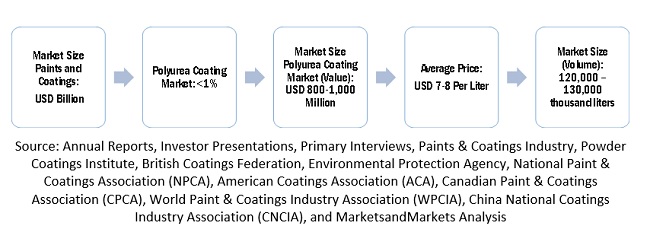
To know about the assumptions considered for the study, Request for Free Sample Report
Market Size Estimation: Polyurea Coatings Market
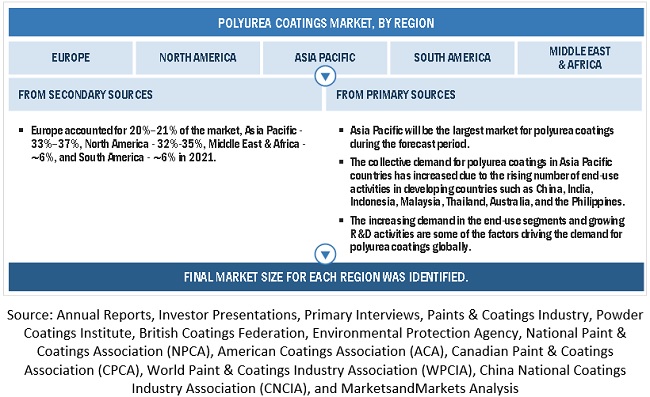
Polyurea Coatings Market By Region
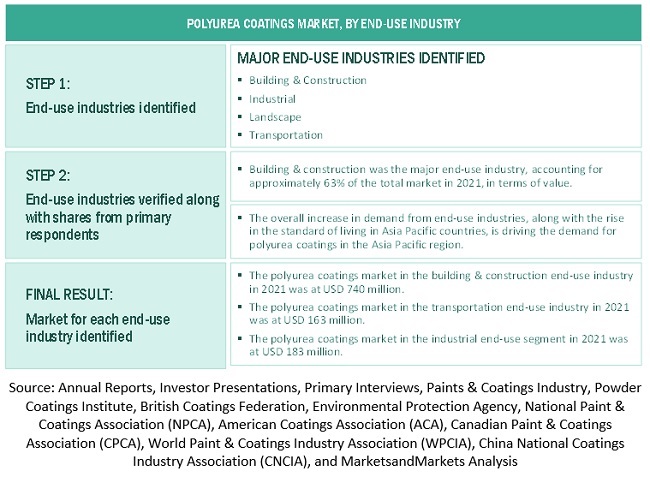
Polyurea Coatings Market By End – Use Industry
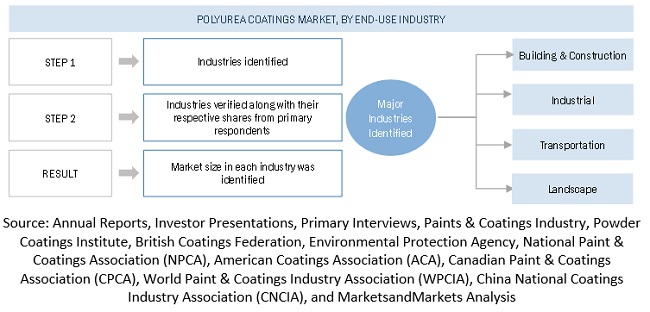
Bottom-Up Approach
The bottom-up approach has been used to arrive at the overall size of the polyurea coatings market from the revenues of the key market players in 2021. With the data triangulation procedure and validation of data through primary interviews, the exact values of the overall parent market size and individual market sizes have been determined and confirmed in this study. The bottom-up approach has been implemented to validate the sizes of the market segments in terms of value.
Market size estimation: bottom-up approach by end – use industry
Market Forecast Approach
Demand-side forecast projection
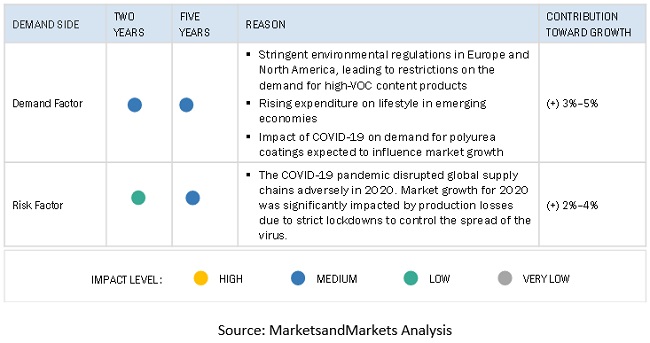
Factor Analysis
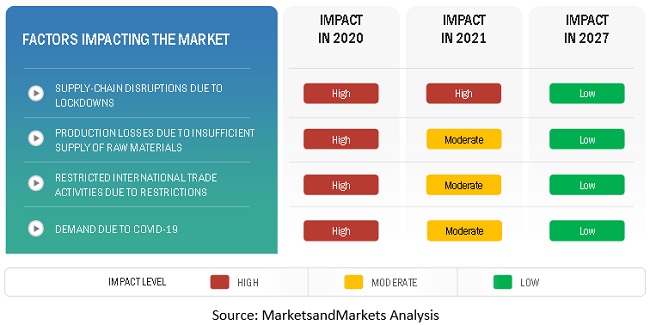
Data Triangulation
After arriving at the overall market size, the market has been split into several segments. To complete the overall market engineering process and arrive at the exact statistics for all segments, the data triangulation and market breakdown procedures have been employed, wherever applicable. The data has been triangulated by studying various factors and trends from the demand and supply sides. In addition, the market has been validated using both the top-down and bottom-up approaches.
Polyurea Coatings Market: Data Triangulation
Report Objectives
-
To define, describe, and forecast the global polyurea coatings market in terms of value
and volume - To provide detailed information about the key factors (drivers, restraints, opportunities, and challenges) influencing the market growth
- To analyze and forecast the market by raw material, technology, polyurea type, and end-use industry
- To forecast the market size with respect to five main regions: Asia Pacific (APAC), the Middle East & Africa, Europe, North America, and South America
- To strategically analyze the micromarkets1 with respect to individual growth trends, prospects, and their contribution to the overall market
- To analyze the opportunities in the market for stakeholders and provide a competitive landscape for market leaders
- To analyze competitive developments in the market, such as investments & expansions, and mergers & acquisitions
- To strategically profile the key players and comprehensively analyze their market shares and core competencies
Available Customizations
MarketsandMarkets offers customizations according to the specific needs of the companies with the given market data.
The following customization options are available for the report:
Product Analysis
- Product matrix, which gives a detailed comparison of the product portfolio of each company
Regional Analysis
- A further breakdown of the waterborne coatings market, by country
Company Information
- Detailed analysis and profiling of additional market players (up to five)


 Generating Response ...


Growth opportunities and latent adjacency in Polyurea Coatings Market
The client is promoting his product
Technical information on Polyurea Coating for anti-corrosion purpose
Polyurea Type, Technology, Application (Building & Construction, Transportation, Industrial, & Landscape)
Incomplete