Pre-engineered Buildings Market by Structure (Single-story, Multi-story), Application (Warehouses & industrial, Infrastructure, Commercial), & Region (North America, Asia Pacific, Europe, South America, Middle East & Africa) - Global Forecast to 2035


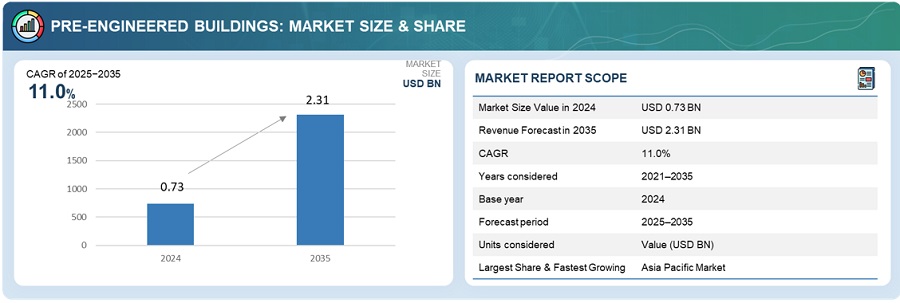
The global pre-engineered buildings market was valued at USD 0.73 billion in 2024 and is estimated to reach USD 2.31 billion by 2035, at a CAGR of 11.0% between 2025 and 2035.
The pre-engineered buildings (PEB) market is growing due to the increasing demand for construction solutions that are cost-effective, sustainable, and quickly delivered in the industrial, commercial, and infrastructure sectors. Contributing factors include increased urbanization, an increase in logistics and warehousing, and a rise in manufacturing facilities. The transition to greener building methods and smart buildings is progressing the adoption of PEBs rapidly. Current trends in the PEB industry include enhancements in modular designs and lightweight materials, along with new digital construction solutions that incorporate Building Information Modeling (BIM) and 3D modeling. The Asia-Pacific (APAC) region, and specifically the countries of India and China, are experiencing rapid growth as a result of supportive government policies, industrial corridor development, and infrastructure investments. The growing use of steel structures in airports, metro stations, and data centers further supports market expansion.
Pre-engineered buildings (PEBs) are structures designed and fabricated in factories using standardized components and then assembled on-site. PEBs consist of primary framing members, secondary structural members, and cladding systems that have been pre-engineered for a specific load factor. PEBs are based on modular construction techniques using a steel frame system, roof and wall panels, and connectors. Primary frames consist of built-up steel sections that bear the main loads of the building, and secondary members include structural support members like purlins and girts. Roof and wall panels are typically composed of galvanized steel or aluminum sheets to ensure durability and weather-tight performance. This system allows for rapid installation of the building structure, waste reduction, and increased design flexibility compared to conventional construction.
Market by Structure
Single-Story
The single-story segment provides the highest share of the pre-engineered buildings market owing to their widespread use in industrial, commercial, infrastructural, and non-commercial settings. Single-story pre-engineered buildings are widely used within factories, logistics centers, warehouses, distribution centers, cold storage, workshops, garages, and heavy and light industrial buildings across oil & gas, power, textiles, FMCG, automotive, mining, and cement sectors. These spaces also include commercial use such as offices, car showrooms, retail shops, shopping centers, hypermarkets, and supermarkets, in addition to infrastructural buildings such as airplane hangars, airport terminal buildings, highways, and footbridges. Non-commercial single-story pre-engineered buildings are also used for schools, hospitals, churches, and exhibition halls, and are an increasingly popular option for agricultural structures, poultry farms, sports fields, parks, blast-resistant military buildings, civic centers, and labor accommodations. This segment is dominating the market in terms of lower costs compared to multi-story buildings, construction speed, and single-story build penetration in developed regions as industrialization, infrastructure, and e-commerce have expanded.
Market by Application
Warehouse & Industrial
In the pre-engineered building market, the warehouse and industrial segment is the largest segment, including buildings such as factories, manufacturing buildings, shops, logistics facilities, warehouses, R&D facilities, cold storage buildings (pharmaceutical and FMCG), mills, assembly plants, distribution centers, garages with light and heavy industrial buildings in sectors such as oil and gas, power and telecommunications, textiles, FMCG, automotive, mining, cement plants and storage buildings. Single-storey pre-engineered buildings are mainly used for warehouse building and industrial applications, as they are often cheaper than other options due to reduced cladding and accessories. The expansion of pre-engineered buildings in warehouse and industrial applications is driven by the growth of manufacturing industries and industrial growth, in both developed and developing countries, and the growth of the retail and e-commerce industry which has helped to create a demand for warehouses, distribution centers and storage buildings to help grow the pre-engineered building market.
Market by Geography:
The pre-engineered building market is being widely adopted geographically in North America, Europe, Asia-Pacific, and the Middle East and Africa regions. Asia-Pacific holds the largest share in the global pre-engineered building market. the Asia-Pacific market growth is driven and propelled by rapid infrastructure development, urbanization, industrial expansion (especially of manufacturing facilities, warehouses and logistics centers), and heavy construction activity in China, India, and southeast Asian nations. The Middle East and Africa region is the next largest contributing region to the market, fueled by many infrastructure projects, industrial diversification initiatives, and mega construction developments growing in countries like UAE, Saudi Arabia, and Qatar. North America accounts for a considerable share in the pre-engineered building market due to advancements in construction applications and increasing demand for economical building solutions and applications in US and Canada. Europe also comprises a considerable share in the pre-engineered market, with the historically strong industrial and commercial sectors in Germany, France, and UK. Europe also has growing pre-engineered building applications that use sustainable and energy-efficient construction methods. South America is the smallest region by demand, but amongst developing countries, there is a growing demand for pre-engineered building driven by industrial development, infrastructure projects, and an increasing demand for benefits of pre-engineered building.
Market Dynamics
Driver: Rapid industrialization and rising infrastructure investments
The PEB market continues to grow due to rapid industrialization and growing investment in the building & construction sector. As nations prioritize economic development, there is a growing need for efficient, scalable, and cost-effective construction solutions. Pre-engineered buildings offer several advantages over conventional construction, including reduced project timelines, lower material waste, and improved structural performance. Governments around the world are embarking on significant urbanization, smart cities, infrastructure and economic corridor building, all which are large developments that will require reliable and flexible building processes, especially PEBs. For example, in India, the Union Budget 2025-26 has raised the capital outlay for infrastructure to USD 128.6 billion, nearly 3.1% of GDP. The National Infrastructure Pipeline (NIP) has also been committed to support the implementation of thousands of infrastructure projects (greenfield and brownfield), each project with capital outlays in the hundreds of crores, a big opportunity for modular building systems / solutions. The government has also committed to a further approx. USD 439 billion outlay in FY24-30 for 'green' infrastructure projects including transportation and sustainable development, which should spur demand for fast-built, modular and resource-efficient building systems like PEBs. With the combined influence of economic growth, technological advancements, policy support, and large government investment, the pre-engineered buildings market is expected to continue its upward trajectory in the forecast period.
Restraint: Vulnerabilities of pre-engineered buildings (PEBs) to corrosion, lower thermal conductivity, and limited fire resistance
Pre-engineered buildings (PEBs), despite their advantages, still encounter some hurdles that keep the market from growing. Corrosion, especially in humid or coastal areas, is one of the major issues and can result in rising maintenance costs and the shortening of the buildings' lives. Even though maintenance of protective coatings helps, continuous care is still required. To make it worse, PEBs are still seen less positively in terms of having higher energy requirements for heating and cooling because they are considered less thermally conductive than traditional buildings. This situation makes them less attractive in areas where energy efficiency is a top concern. Another drawback that can be another factor for limiting the market of PEBs is fire resistance. Insulation and some PEB materials can have lower fire ratings than concrete or steel structures and thus have a limited application in areas requiring strict fire safety measures like hospitals or schools. Corrosion, energy inefficiency, and fire safety issues are the three main factors that together form the drawback for PEBs to be widely adopted, especially in the areas where safety and durability are the top concerns.
Opportunity: Increase in population and rapid urbanization, translating into a large number of new construction projects
The gradual rise of the global population, especially in the poorer nations, coupled with the swift urbanization process, has nearly doubled the demand for the development of different types of the built environment such as residential, commercial, industrial, and infrastructural development among others. The migration of people to the cities, for better economic opportunities, has put the governments and the private developers under pressure to provide the necessary housing, offices, factories, warehouses, and public amenities at a faster rate than expected. One of the results of this trend is the emergence of several new construction projects in urban and peri-urban areas. Pre-engineered buildings (PEBs) are considered to be a timely and efficient solution to this huge demand since they are characterized by faster completion times, lower costs, and the ability to be modified according to one's needs. Their modular construction makes them very convenient for the quick establishment of urban infrastructure without any quality or design compromise. Also, the trend towards smart cities and sustainable urban development is positively affecting the use of PEBs, which are considered to be more eco-friendly than traditional construction when taking into account the materials used and the impact on the site. Thus, the urbanization trend is creating a great opportunity for PEBs to take a key role in the transformation of modern urban infrastructure, especially in countries like India, China, Brazil, and some parts of Africa where the population is increasing rapidly. The construction industry will be the main beneficiary of government-supported housing initiatives, industrial development, logistics areas, and commercial expansion, all of which will increasingly favor fast, flexible, and standard construction systems.
Challenge: Lack of skilled manpower and awareness
The absence of skilled workers and knowledge about the benefits and functionalities of pre-engineered buildings (PEB) are among the major factors degrading the usage of such buildings and hence the market growth. The construction of pre-engineered structures necessitates a combination of knowledge in designing, fabricating, and assembling modular structures. Still, a lot of places, especially developing countries, have no trained professionals who can handle PEB technologies. This discrepancy in skills results in project delays, quality compromise in construction and a high foreign professional dependency which ultimately increases cost. Furthermore, the awareness of the long-term benefits of PEBs like, among others, cost savings, faster construction and environmental sustainability, is very low among the construction professionals and end-users and this creates an indirect barrier to their introduction. The sector participants like contractors, architects and even potential clients are still more inclined towards traditional building methods which they see as more reliable, despite the PEBs having many advantages in terms of time and cost. The lack of comprehension also leads to the resistance against the new technology and hence, the containment of PEBs in some areas as a non-existing market. If there is no collaborative effort of improving the training programs, making the public aware, and encouraging an acceptance of PEBs, then the market will not be able to reach its full potential, especially in those emerging markets where urbanization and infrastructural development are taking place rapidly.
Future Outlook
The pre-engineered buildings market is expected to witness robust growth from 2025 to 2035, fueled by increasing demand in industrial, commercial, and residential sectors. Rapid urbanization, infrastructure development, and rising industrialization in emerging economies, especially in Asia-Pacific regions such as China and India, will be primary growth drivers. Technological advancements in steel fabrication, modular construction techniques, and sustainable building materials are enhancing the efficiency and appeal of PEBs. Governments’ focus on affordable housing, smart city projects, and green building initiatives further support market expansion. North America and Europe are projected to maintain steady growth due to ongoing modernization and renovation activities. However, challenges including lack of skilled labor, regulatory compliances, and concerns over fire resistance and corrosion may slow adoption rates. Despite these obstacles, the market’s prospects remain strong, driven by the need for faster, cost-effective, and environmentally friendly construction solutions worldwide.
Key Market Players
Key Force Sensor companies BlueScope (Australia), Zamil Steel Holding Company Limited (Saudi Arabia), Kirby Building Systems (Kuwait), Nucor Corporation (US) Lindab Group (Sweden), among others.
Key Questions addressed in this report:
- What are the global trends in demand for the market?
- What are the upcoming technologies/product areas that will have a significant impact on the market in the future?
- What will be the revenue pockets for the market players in the next 10 years?
- What are the prime strategies followed by key players in the market?
To speak to our analyst for a discussion on the above findings, click Speak to Analyst
 Exclusive indicates content/data unique to MarketsandMarkets and not available with any competitors.
Table of Contents
1 Introduction (Page No. - 15)
1.1 Objectives of the Study
1.2 Market Definition
1.3 Market Scope
1.3.1 Periodization Considered
1.4 Currency Considered
1.5 Unit Considered
1.6 Stakeholders
2 Research Methodology (Page No. - 19)
2.1 Research Data
2.1.1 Secondary Data
2.1.1.1 Key Data From Secondary Sources
2.1.2 Primary Data
2.1.2.1 Key Data From Primary Sources
2.1.2.2 Breakdown of Primaries
2.2 Market Size Estimation
2.3 Data Triangulation
2.4 Research Assumptions & Limitations
2.4.1 Assumptions
2.4.2 Limitations
3 Executive Summary (Page No. - 26)
4 Premium Insights (Page No. - 29)
4.1 Developing Economies to Register High Growth in the Pre-Engineered Buildings Market
4.2 Pre-Engineered Buildings Market, By Structure
4.3 Pre-Engineered Buildings Market, By Application
4.4 Pre-Engineered Buildings Market, By Region and Structure
4.5 Pre-Engineered Buildings Market, By Country
5 Market Overview (Page No. - 32)
5.1 Introduction
5.2 Market Dynamics
5.2.1 Drivers
5.2.1.1 Rapid Industrialization and Growth in Infrastructural Investment
5.2.1.2 Increasing Demand for Green Buildings
5.2.1.3 Increase in the Use of Steel in Building and Construction Projects
5.2.1.4 Need for Reduced Construction Time and Cost and for Lightweight Building Structure
5.2.2 Restraints
5.2.2.1 Vulnerability to Corrosion, Lower thermal Conductivity, and Limited Fire Resistance of Pre-Engineered Buildings
5.2.3 Opportunities
5.2.3.1 Increase in Population and Rapid Urbanization Translating Into A Large Number of New Construction Projects
5.2.4 Challenges
5.2.4.1 Fluctuation in Raw Material Prices
5.2.4.2 Lack of Skilled Manpower and Awareness
6 Pre-Engineered Buildings Market, By Structure (Page No. - 38)
6.1 Introduction
6.2 Single-Story
6.2.1 Single-Story Segment to Be the Largest Segment of the Pre-Engineered Buildings Market
6.3 Multi-Story
6.3.1 Multi-Story Pre-Engineered Buildings Have Higher Penetration in the Developed Countries
7 Pre-Engineered Buildings Market, By Application (Page No. - 42)
7.1 Introduction
7.2 Warehouses & Industrial
7.2.1 Warehouses & Industrial Application to Be the Leading Application in the Pre-Engineered Buildings Market
7.3 Infrastructure
7.3.1 The Increase in Public and Private Investments in the Infrastructural Sector is Fueling the Demand for Pre-Engineered Buildings in Infrastructural Application
7.4 Commercial
7.4.1 The Commercial Segment is Projected to Record the Second-Highest Growth Rate During the Forecast Period
7.5 Others
7.5.1 The Others Segment is Projected to Record the Lowest Growth Rate During the Forecast Period
8 Pre-Engineered Buildings Market, By Region (Page No. - 46)
8.1 Introduction
8.2 Asia Pacific
8.2.1 China
8.2.1.1 China is the Second-Largest Country-Level Market for Pre-Engineered Buildings, Globally
8.2.2 India
8.2.2.1 India to Be the Fastest-Growing Market for Pre-Engineered Buildings in Asia Pacific
8.2.3 Australia
8.2.3.1 The Growth of the Non-Residential Construction Industry is Driving the Pre-Engineered Buildings Market in Australia
8.2.4 Japan
8.2.4.1 Demand for Shorter Construction Time, Reduced Construction Cost, and Increasing Demand for Sustainable Buildings are Driving the Japanese PEB Market
8.2.5 Rest of Asia Pacific
8.2.5.1 Rise in Income Levels, Rapid Urbanization, and Trade Liberalization Drive the Pre-Engineered Buildings Market in Rest of Asia Pacific
8.3 North America
8.3.1 US
8.3.1.1 US to Be the Largest Country-Level Market for Pre-Engineered Buildings, Globally
8.3.2 Canada
8.3.2.1 The Canadian Pre-Engineered Buildings Market is Characterized By Increase in the Use of Steel in Construction
8.3.3 Mexico
8.3.3.1 Favorable Government Policies Support the Construction Industry, Which Is, in Turn, Driving the Mexican Pre-Engineered Buildings Market Growth
8.4 Europe
8.4.1 Germany
8.4.1.1 Germany is Projected to Be the Largest Market for Pre-Engineered Buildings in Europe Through 2035
8.4.2 UK
8.4.2.1 The UK is Projected to Be the Fastest- Growing Market for Pre-Engineered Buildings in Europe During the Forecast Period
8.4.3 France
8.4.3.1 France has Attracted Foreign Investors Due to Its Economic Dynamism, Industrial Hubs, High Labor Productivity, and the Presence of Big International Companies
8.4.4 Italy
8.4.4.1 Cost-Effective and Time-Saving Construction Methods Boost the Adoption and Growth of Pre-Engineered Buildings in Italy
8.4.5 Russia
8.4.5.1 Growth in the Russian Pre-Engineered Buildings Market is Supported By Public and Private Investments in the Construction Industry and Urban Development
8.4.6 Rest of Europe
8.4.6.1 Rest of Europe is Projected to Grow at A Higher Rate During the Forecast Period
8.5 Middle East & Africa
8.5.1 Saudi Arabia
8.5.1.1 Saudi Arabia to Account for the Largest Share in the Middle East & Africa Pre-Engineered Buildings Market Through 2035
8.5.2 UAE
8.5.2.1 The Growth of Pre-Engineered Buildings in the UAE is Driven By their Usage in the Residential, Hospitality, and Retail Sectors
8.5.3 Turkey
8.5.3.1 Growth of the Non-Residential Construction Industry to Boost the Demand for Pre-Engineered Buildings in Turkey
8.5.4 South Africa
8.5.4.1 Favorable Trade Policies and the Demand for Sustainable Buildings Drive the Pre-Engineered Buildings Market in South Africa
8.5.5 Rest of the Middle East & Africa
8.5.5.1 Rest of Middle East & Africa Accounted for the Third-Largest Share in the Middle East & Africa Pre-Engineered Buildings Market in 2024
8.6 South America
8.6.1 Brazil
8.6.1.1 Brazil to Account for the Largest Share in the South American Pre-Engineered Buildings Market
8.6.2 Argentina
8.6.2.1 The Availability of Raw Materials, Low Labor Costs, and Ease of Accessibility Attract Foreign Investors to Set Up their Factories and Warehouses in Argentina
8.6.3 Rest of South America
8.6.3.1 Rest of South America to Show Growth Prospects in the Demand for Pre-Engineered Buildings
9 Competitive Landscape (Page No. - 92)
9.1 Overview
9.2 Market Ranking
9.3 Competitive Scenario
9.3.1 Contracts/Orders/Project Developments
9.3.2 Expansions and Divestiture
9.3.3 Acquisitions
9.3.4 New Product Developments
10 Company Profiles (Page No. - 97)
10.1 Bluescope
10.2 Zamil Steel Holding Company
10.3 Kirby Building Systems
10.4 Nucor Corporation
10.5 NCI Building Systems
10.6 Lindab Group
10.7 Everest Industries
10.8 PEB Steel
10.9 PEBS Pennar
10.10 ATCO
10.11 Other Players
10.11.1 Atad Steel Structure Corporation
10.11.2 Memaar Building Systems
10.11.3 Norsteel Buildings
10.11.4 John Reid & Sons (Strucsteel)
10.11.5 Rigid Global Buildings
10.11.6 Metal Building Manufacturers Inc.
10.11.7 Mabani Steel
10.11.8 Steelway Building Systems
10.11.9 Tiger Steel Engineering India (Tseil)
10.11.10 Emirates Building Systems
10.11.11 Phenix Construction Technologies
10.11.12 Allied Steel Buildings
10.11.13 SML Group
10.11.14 Octamec Group
10.11.15 Jindal Buildsys
11 Appendix (Page No. - 121)
11.1 Discussion Guide
11.2 Knowledge Store: Marketsandmarkets Subscription Portal
11.3 Available Customizations
11.4 Related Reports
11.5 Author Details
List of Tables (86 Tables)
Table 1 USD Conversion Rates, 2024–2035
Table 2 Asia Pacific Urbanization Trend, 2024–2035
Table 3 Pre-Engineered Buildings Market Size, By Structure, 2024–2035 (USD Million)
Table 4 Pre-Engineered Buildings Market Size, By Structure, 2024–2035 (Million Square Feet)
Table 5 Pre-Engineered Buildings Market Size, By Application, 2024–2035 (USD Million)
Table 6 Pre-Engineered Buildings Market Size, By Application, 2024–2035 (Million Square Feet)
Table 7 Pre-Engineered Buildings Market Size, By Region, 2024–2035 (USD Million)
Table 8 Pre-Engineered Buildings Market Size, By Region, 2024–2035 (Million Square Feet)
Table 9 Asia Pacific: Pre-Engineered Buildings Market Size, By Country, 2024–2035 (USD Million)
Table 10 Asia Pacific: Pre-Engineered Buildings Market Size, By Country, 2024–2035 (Million Square Feet)
Table 11 Asia Pacific: Pre-Engineered Buildings Market Size, By Structure, 2024–2035 (USD Million)
Table 12 Asia Pacific: Pre-Engineered Buildings Market Size, By Structure, 2024–2035 (Million Square Feet)
Table 13 Asia Pacific: Pre-Engineered Buildings Market Size, By Application, 2024–2035 (USD Million)
Table 14 Asia Pacific: Pre-Engineered Buildings Market Size, By Application, 2024–2035 (Million Square Feet)
Table 15 China: Pre-Engineered Buildings Market Size, By Application, 2024–2035 (USD Million)
Table 16 China: Pre-Engineered Buildings Market Size, By Application, 2024–2035 (Million Square Feet)
Table 17 India: Pre-Engineered Buildings Market Size, By Application, 2024–2035 (USD Million)
Table 18 India: Pre-Engineered Buildings Market Size, By Application, 2024–2035 (Million Square Feet)
Table 19 Australia: Pre-Engineered Buildings Market Size, By Application, 2024–2035 (USD Million)
Table 20 Australia: Pre-Engineered Buildings Market Size, By Application, 2024–2035 (Million Square Feet)
Table 21 Japan: Pre-Engineered Buildings Market Size, By Application, 2024–2035 (USD Million)
Table 22 Japan: Pre-Engineered Buildings Market Size, By Application, 2024–2035 (Million Square Feet)
Table 23 Rest of Asia Pacific: Pre-Engineered Buildings Market Size, By Application, 2024–2035 (USD Million)
Table 24 Asia Pacific: Pre-Engineered Buildings Market Size, By Application, 2024–2035 (Million Square Feet)
Table 25 North America: Pre-Engineered Buildings Market Size, By Country, 2024–2035 (USD Million)
Table 26 North America: Pre-Engineered Buildings Market Size, By Country, 2024–2035 (Million Square Feet)
Table 27 North America: Pre-Engineered Buildings Market Size, By Structure, 2024–2035 (USD Million)
Table 28 North America: Pre-Engineered Buildings Market Size, By Structure, 2024–2035 (Million Square Feet)
Table 29 North America: Pre-Engineered Buildings Market Size, By Application, 2024–2035 (USD Million)
Table 30 North America: Pre-Engineered Buildings Market Size, By Application, 2024–2035 (Million Square Feet)
Table 31 US: Pre-Engineered Buildings Market Size, By Application, 2024–2035 (USD Million)
Table 32 US: Pre-Engineered Buildings Market Size, By Application, 2024–2035 (Million Square Feet)
Table 33 Canada: Pre-Engineered Buildings Market Size, By Application, 2024–2035 (USD Million)
Table 34 Canada: Pre-Engineered Buildings Market Size, By Application, 2024–2035 (Million Square Feet)
Table 35 Mexico: Pre-Engineered Buildings Market Size, By Application, 2024–2035 (USD Million)
Table 36 Mexico: Pre-Engineered Buildings Market Size, By Application, 2024–2035 (Million Square Feet)
Table 37 Europe: Pre-Engineered Buildings Market Size, By Country, 2024–2035 (USD Million)
Table 38 Europe: Pre-Engineered Buildings Market Size, By Country, 2024–2035 (Million Square Feet)
Table 39 Europe: Pre-Engineered Buildings Market Size, By Structure, 2024–2035 (USD Million)
Table 40 Europe: Pre-Engineered Buildings Market Size, By Structure, 2024–2035 (Million Square Feet)
Table 41 Europe: Pre-Engineered Buildings Market Size, By Application, 2024–2035 (USD Million)
Table 42 Europe: Pre-Engineered Buildings Market Size, By Application, 2024–2035 (Million Square Feet)
Table 43 Germany: Pre-Engineered Buildings Market Size, By Application, 2024–2035 (USD Million)
Table 44 Germany: Pre-Engineered Buildings Market Size, By Application, 2024–2035 (Million Square Feet)
Table 45 UK: Pre-Engineered Buildings Market Size, By Application, 2024–2035 (USD Million)
Table 46 UK: Pre-Engineered Buildings Market Size, By Application, 2024–2035 (Million Square Feet)
Table 47 France: Pre-Engineered Buildings Market Size, By Application, 2024–2035 (USD Million)
Table 48 France: Pre-Engineered Buildings Market Size, By Application, 2024–2035 (Million Square Feet)
Table 49 Italy: Pre-Engineered Buildings Market Size, By Application, 2024–2035 (USD Million)
Table 50 Italy: Pre-Engineered Buildings Market Size, By Application, 2024–2035 (Million Square Feet)
Table 51 Russia: Pre-Engineered Buildings Market Size, By Application, 2024–2035 (USD Million)
Table 52 Russia: Pre-Engineered Buildings Market Size, By Application, 2024–2035 (Million Square Feet)
Table 53 Rest of Europe: Pre-Engineered Buildings Market Size, By Application, 2024–2035 (USD Million)
Table 54 Rest of Europe: Pre-Engineered Buildings Market Size, By Application, 2024–2035 (Million Square Feet)
Table 55 Middle East & Africa: Pre-Engineered Buildings Market Size, By Country, 2024–2035 (USD Million)
Table 56 Middle East & Africa: Pre-Engineered Buildings Market Size, By Country, 2024–2035 (Million Square Feet)
Table 57 Middle East & Africa: Pre-Engineered Buildings Market Size, By Structure, 2024–2035 (USD Million)
Table 58 Middle East & Africa: Pre-Engineered Buildings Market Size, By Structure, 2024–2035 (Million Square Feet)
Table 59 Middle East & Africa: Pre-Engineered Buildings Market Size, By Application, 2024–2035 (USD Million)
Table 60 Middle East & Africa: Pre-Engineered Buildings Market Size, By Application, 2024–2035 (Million Square Feet)
Table 61 Saudi Arabia: Pre-Engineered Buildings Market Size, By Application, 2024–2035 (USD Million)
Table 62 Saudi Arabia: Pre-Engineered Buildings Market Size, By Application, 2024–2035 (Million Square Feet)
Table 63 UAE: Pre-Engineered Buildings Market Size, By Application, 2024–2035 (USD Million)
Table 64 UAE: Pre-Engineered Buildings Market Size, By Application, 2024–2035 (Million Square Feet)
Table 65 Turkey: Pre-Engineered Buildings Market Size, By Application, 2024–2035 (USD Million)
Table 66 Turkey: Pre-Engineered Buildings Market Size, By Application, 2024–2035 (Million Square Feet)
Table 67 South Africa: Pre-Engineered Buildings Market Size, By Application, 2024–2035 (USD Million)
Table 68 South Africa: Pre-Engineered Buildings Market Size, By Application, 2024–2035 (Million Square Feet)
Table 69 Rest of the Middle East & Africa: Pre-Engineered Buildings Market Size, By Application, 2024–2035 (USD Million)
Table 70 Rest of the Middle East & Africa: Pre-Engineered Buildings Market Size, By Application, 2024–2035 (Million Square Feet)
Table 71 South America: Pre-Engineered Buildings Market Size, By Country, 2024–2035 (USD Million)
Table 72 South America: Pre-Engineered Buildings Market Size, By Country, 2024–2035 (Million Square Feet)
Table 73 South America: Pre-Engineered Buildings Market Size, By Structure, 2024–2035 (USD Million)
Table 74 South America: Pre-Engineered Buildings Market Size, By Structure, 2024–2035 (Million Square Feet)
Table 75 South America: Pre-Engineered Buildings Market Size, By Application, 2024–2035 (USD Million)
Table 76 South America: Pre-Engineered Buildings Market Size, By Application , 2024–2035 (Million Square Feet)
Table 77 Brazil: Pre-Engineered Buildings Market Size, By Application, 2024–2035 (USD Million)
Table 78 Brazil: Pre-Engineered Buildings Market Size, By Application, 2024–2035 (Million Square Feet)
Table 79 Argentina: Pre-Engineered Buildings Market Size, By Application, 2024–2035 (USD Million)
Table 80 Argentina: Pre-Engineered Buildings Market Size, By Application, 2024–2035 (Million Square Feet)
Table 81 Rest of South America: Pre-Engineered Buildings Market Size, By Application, 2024–2035 (USD Million)
Table 82 Rest of South America: Pre-Engineered Buildings Market Size, By Application, 2024–2035 (Million Square Feet)
Table 83 Contracts/Orders/Project Developments, 2024-2035
Table 84 Expansions and Divestiture, 2024-2035
Table 85 Acquisitions, 2024
Table 86 New Product Developments, 2024
List of Figures (27 Figures)
Figure 1 Pre-Engineered Buildings Market Segmentation
Figure 2 Pre-Engineered Buildings Market: Research Design
Figure 3 Market Size Estimation Methodology: Bottom-Up Approach
Figure 4 Market Size Estimation Methodology: Top-Down Approach
Figure 5 Pre-Engineered Buildings Market: Data Triangulation
Figure 6 Single-Story Segment Accounted for A Larger Market Share
Figure 7 Warehouses & Industrial to Be the Fastest-Growing Application of Pre-Engineered Buildings
Figure 8 Asia Pacific Was the Largest Pre-Engineered Buildings Market in 2024
Figure 9 Rapid Industrialization and Growth in Infrastructure Investment to Drive the Pre-Engineered Buildings Market
Figure 10 Single-Story Segment to Grow at A Higher Rate During the Forecast Period, in Terms of Volume
Figure 11 Warehouses & Industrial Segment to Dominate the Pre-Engineered Buildings Market Through 2035, in Terms of Volume
Figure 12 Asia Pacific and the Single-Story Segment Led the Pre-Engineered Buildings Market in 2024, in Terms of Volume
Figure 13 India to Register the Highest Cagr During the Forecast Period
Figure 14 Pre-Engineered Buildings Market Dynamics
Figure 15 Percentage Share of the Demand for Steel, By Region (2024)
Figure 16 Pre-Engineered Buildings Market Size, By Structure, 2035 vs. 2035 (USD Million)
Figure 17 Pre-Engineered Buildings Market Size, By Application, 2035 vs. 2035 (USD Million)
Figure 18 Geographic Snapshot (2035–2035): India is Projected to Register the Highest Growth Rate
Figure 19 Asia Pacific Pre-Engineered Buildings Market Snapshot
Figure 20 Asia Pacific Pre-Engineered Buildings Market: Key Countries (2024)
Figure 21 Market Ranking of Key Players, 2024
Figure 23 Zamil Steel Holding Company: Company Snapshot
Figure 24 Nucor Corporation: Company Snapshot
Figure 25 NCI Building Systems: Company Snapshot
Figure 26 Lindab Group: Company Snapshot
Figure 27 Everest Industries: Company Snapshot
The study involved four major activities for estimating the current market size for pre-engineered buildings. Exhaustive secondary research was done to collect information on the market, the peer market, and the parent market. The next step was to validate these findings, assumptions, and sizing with industry experts across the value chain through primary research. Both the top-down and bottom-up approaches were employed to estimate the complete market size. Thereafter, market breakdown and data triangulation were used to estimate the market size of segments and subsegments.
Secondary Research
In the secondary research process, various secondary sources such as Hoovers, Bloomberg BusinessWeek, and Dun & Bradstreet were referred to, so as to identify and collect information for this study. These secondary sources included annual reports, press releases & investor presentations of companies, white papers, certified publications, articles by recognized authors, metal building associations, regulatory bodies, trade directories, and databases.
Primary Research
Various primary sources from both the supply and demand sides of the market were interviewed to obtain qualitative and quantitative information. The primary sources from the supply side include industry experts such as CEOs, vice presidents, marketing directors, sales professionals, and related key executives from various key companies and organizations operating in the pre-engineered buildings market. The primary sources from the demand side include key executives from the end-user industries of pre-engineered buildings.
Below is the breakdown of primary respondents:
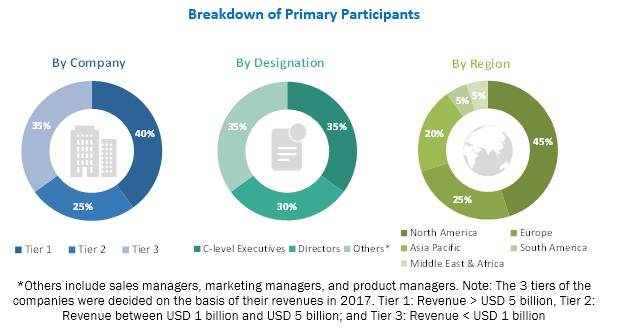
To know about the assumptions considered for the study, download the pdf brochure
Market Size Estimation
Both the top-down and bottom-up approaches were used to estimate and validate the total size of the global pre-engineered buildings market. These approaches were also used extensively to estimate the size of various dependent subsegments in the market. The research methodology used to estimate the market size includes the following details:
- The key players were identified through extensive secondary research.
- The industry’s supply chain and market size, in terms of value, were determined through primary and secondary research processes.
- All percentage shares, splits, and breakdowns were determined using secondary sources and verified through primary sources.
Data Triangulation
After arriving at the overall market size from the estimation process explained above, the total market was split into several segments and subsegments. In order to complete the overall market engineering process and arrive at the exact statistics for all segments and subsegments, the data triangulation and market breakdown procedures were employed, wherever applicable. The data was triangulated by studying various factors and trends from both the demand and supply sides.
Research Objectives
- To define, analyze, and project the size of the global pre-engineered buildings market in terms of structure, application, and region
- To project the size of the market and its subsegments, in terms of value and volume, with respect to the five main regions, namely, North America, Europe, Asia Pacific, the Middle East & Africa, and South America
- To provide detailed information about the key factors such as drivers, restraints, opportunities, and industry-specific challenges influencing the market growth
- To strategically analyze micromarkets with respect to individual growth trends, future prospects, and their contribution to the total market
- To analyze opportunities in the market for stakeholders and provide details of a competitive landscape of the market leaders
- To analyze competitive developments such as contracts/orders, new product developments, new project developments, divestitures, acquisitions, and expansions in the pre-engineered buildings market
- To strategically profile the key players and comprehensively analyze their market share and core competencies
Available Customizations
With the given market data, MarketsandMarkets offers customizations according to client-specific needs.
The following customization options are available for the pre-engineered buildings report:
Product Analysis
- Product Matrix, which offers a detailed comparison of product portfolio of each company
Regional Analysis
- Further analysis of the pre-engineered buildings market for additional countries
Company Information
- Detailed analysis and profiling of additional market players (up to five)


Growth opportunities and latent adjacency in Pre-engineered Buildings Market