Pre-terminated Systems Market by Component (Cables, Patch Panels, Patch Cords, Connectors, and Adapter Panels), Service (Design & Engineering, Installation, and Post-installation), Vertical, and Geography - Global Forecast to 2024


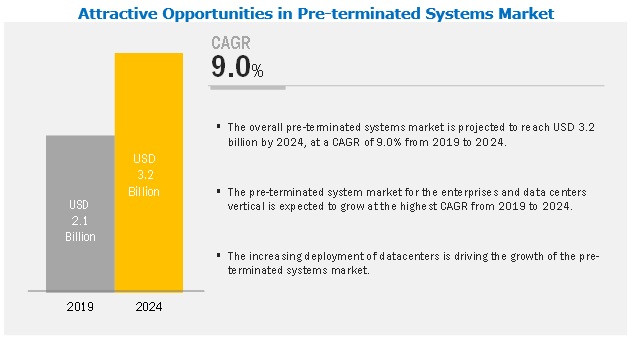
[164 Pages Report] The overall pre-terminated systems market is expected to grow from USD 2.1 billion in 2019 to USD 3.2 billion by 2024, at a CAGR of 9.0%. The growth of this market is mainly driven by the increasing establishment of data centers and the growing demand for transmission bandwidth and network reliability. The growing trend of VoIP, LTE, and 5G networks provides major opportunities for the growth of the pre-terminated systems market.
�Components to hold larger share of pre-terminated systems market during forecast period�
The component segment comprises cables, connectors, brackets & adapters, patch panels, patch cords, cassettes and modules, pigtails, and fiber enclosures. Pre-terminated solutions provide advantages such as a decrease in labor costs and reduction in congestion cable pathways and spaces, on-site installation time, and security-related risks. Various factors contributing to the increasing implementation of pre-terminated systems are the growing adoption of solutions to reduce data center installation costs and improving return on investment (RoI).
�Largest share of enterprises and data centers vertical in pre-terminated systems market is due to growing demand for proper infrastructure�
The enterprises & data centers vertical is the largest adopter of pre-terminated systems. In this vertical, the network of cabling systems plays a vital role in the smooth and faster transmission of voice, data, and video signals from one point to another or from one system to another by connecting two distinct user locations for sharing information. Pre-terminated solutions are used to provide a plug-and-play solution for links between switches, servers, patch panels, and zone distribution areas in data centers and IT and telecom facilities, thereby driving the growth of this market for these verticals.
�Market in APAC expected to grow significantly during forecast period�
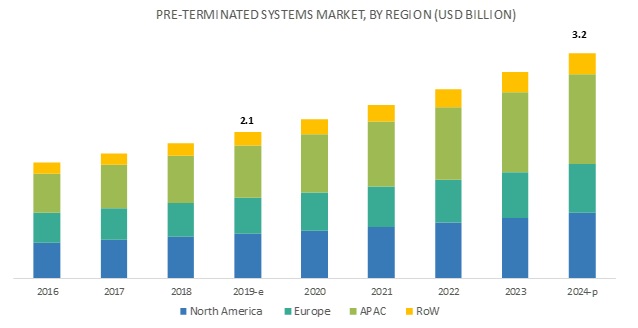
The pre-terminated systems market in APAC is expected to grow at the highest CAGR during the forecast period. Owing to the rapid urbanization and infrastructure activities, the market for pre-terminated systems is expected to grow in APAC. Data centers in this region are undergoing a dramatic change owing to the digital transformation of businesses. An increase in public and private sector investments in infrastructure projects to meet the demand of several industries, such as enterprise, banking, telecom, and government, is expected to drive the growth of the market in APAC.
Key Market Players
The pre-terminated systems market is currently dominated by TE Connectivity Ltd. (Switzerland), Optical Cable Corporation (US), Corning Incorporated (US), CommScope Holding Company, Inc. (US), Amphenol Corporation (US), HellermannTyton PLC (Austria), HUBER+SUHNER AG (Switzerland), Belden Inc. (US), Legrand SA (France), and Nexans SA (France). A few of the major strategies adopted by these players to compete in the market include product launches and developments, partnerships, and mergers and acquisitions.
Other players operating in the pre-terminated systems market are Panduit Corp. (US), The Siemon Company (US), Schneider Electric (France), AFL (US), ComCore Connexions (3C3) (India), Comnen Technology Co., Ltd. (China), Optec Technology Limited (Hong Kong), The Cabling Company (UK), Leviton Network Solutions (US), CABLExpress Corporation (US), Connectix Cabling System (UK), Reichle & De-Massari AG (Switzerland), Molex, LLC (US), Anderson Corporation Pty Ltd. (Australia), and CDI Group Limited (UK). These players have adopted strategies such as product developments and launches, mergers and acquisitions, and partnerships and collaborations to grow in the market.
Scope of the Report:
|
Report Metrics |
Details |
|
Market size available for years |
2016�2024 |
|
Base year |
2018 |
|
Forecast period |
2019�2024 |
|
Units |
Value (USD million/billion), Shipment (thousand/ million) |
|
Segments covered |
offerings, vertical, and region |
|
Geographic regions covered |
North America, APAC, Europe, and RoW |
|
Companies covered |
TE Connectivity Ltd. (Switzerland), Optical Cable Corporation (US), Corning Incorporated (US), CommScope Holding Company, Inc. (US), Amphenol Corporation (US), HellermannTyton PLC (Austria), HUBER+SUHNER AG (Switzerland), Belden Inc.(US), Legrand SA (France), Nexans SA (France), Panduit Corp. (US), The Siemon Company (US), Schneider Electric (France), AFL (US), ComCore Connexions (3C3) (India), Comnen Technology Co., Ltd. (China), Optec Technology Limited (Hong Kong), The Cabling Company (UK), Leviton Network Solutions (US), CABLExpress Corporation (US), Connectix Cabling System (UK), Reichle & De-Massari AG (Switzerland), Molex, LLC (US), Anderson Corporation Pty Ltd. (Australia), and CDI Group Limited (UK) |
This report categorizes the pre-terminated systems market by offering, vertical, and region.
By Component:
- Cables
- Copper
- Fiber
- Connectors
- Adapter Plates
- Patch Panels
- Patch Cords
- Cassette Modules
- Pigtails
- Fiber Enclosures
By Service:
- Design & Engineering
- Installation
- Post Installation
By Vertical:
- Government & Defense
- Enterprises & Data Centers
- IT & Telecom
- Energy & Utilities
- Manufacturing
- Banking, Financial Services, & Insurance
- Retail
- Media & Entertainment
- Others (Healthcare & Residential)
By Geography:
- Americas
- US
- Canada
- Mexico
- South America
- Europe
- UK
- Germany
- France
- Rest of Europe (Greece, Spain, Italy, Russia, Finland, Denmark, and Sweden)
- Asia Pacific (APAC)
- China
- Japan
- India
- South Korea
- Australia & New Zealand
- Rest of APAC (Philippines, Singapore, Hong Kong, Indonesia, and Taiwan)
- Rest of the World (RoW)
- Middle East & Africa
- South America
Major Market Developments
- In May 2019, HUBER+SUHNER AG (Switzerland) launched the compact omnidirectional and directional MIMO outdoor antennas for use in 4G and 5G deployments. The new SENCITY Urban 100 and 200 outdoor MIMO antennas cover both 4G and 5G high-frequency ranges to maximize the performance.
- In March 2019, Nexans SA (France) got a contract from JDR Cable Systems (UK), a cable supplier, to supply pre-terminated and factory-tested turbine cables, as well as the full scope of T-connectors terminating the dynamic inter-array cables for the MHI Vestas V164-8.4 MW turbines to WindFloat Atlantic, 25 megawatts (MW) floating wind farm to be installed off the coast of Portugal.
- In September 2018, TE Connectivity Ltd. (Switzerland) launched its new 124 position sliver internal I/O connectors and cable assemblies, which provide a high-density solution that enables up to x20 signal transmission lanes or 40 differential pairs.
- In August 2017, CommScope Holding Company, Inc. (US) acquired Cable Exchange (US), a manufacturer of a variety of fiber optic and copper cables, trunks, and related products used in high-capacity data centers and other business enterprise applications. This acquisition expands CommScope�s capabilities for supporting the growing market for high-capacity, multi-tenant data centers, and hyper-scale data centers.
Key Questions Addressed by the Report
- Where will all these developments take the industry in the mid-to-long term?
- What are the upcoming trends in the pre-terminated systems market?
- What are the opportunities for existing market players and those who are planning to enter the market?
- How inorganic growth strategies implemented by key players impact the growth of the market, and who would have the undue advantage?
- What are the current investment trends in the market?
Frequently Asked Questions (FAQ):
Why there is increasing need of Pre-terminated sytsems for data center?
There is a high demand for fiber optic modules to connect servers, switches, and storage solutions in the data centers. Pre-terminated cabling solutions are designed for rapid deployment in data center-structured cabling networks. They are ideal for environments where performance, flexibility, and scalability are critical requirements. The increasing need for high bandwidth and energy is accelerating the demand for pre-terminated cabling systems in data centers.
Which are the major companies in the market? What are their major strategies to strengthen their market presence?
TE Connectivity Ltd. , Optical Cable Corporation, CommScope Holding Company, Inc., Amphenol Corporation, HellermannTyton PLC , HUBER+SUHNER AG, and Belden Inc.(US) are some of the major companies providing pre-terminated system. Product launches is one of the key strategies adopted by these players. Apart from launches, these players extend their focus on inorganic stretgies such as acquisitions, contracts, and agreements.
Which region is expected to witness significant demand for pre-terminated sytsems in the coming years?
APAC is the fastest-growing region for data centers in the world currently, which also projects that APAC will become the largest data center market in the world by 2020. Countries such as China, India, Japan, Australia, and New Zealand are witnessing significant demand for cabling systems from enterprise, telecom, and IT sectors, thereby, fueling the market growth in APAC.
Which are the major verticals of this market?
IT & telecom and data center are increasing the demand for pre-terinated systems. In both these verticals, the network of cabling systems plays a vital role in the smooth and faster transmission of voice, data, and video signals from one point to another or from one system to another by connecting two distinct user locations for sharing information. Pre-terminated solutions are used to provide a plug-and-play solution for links between switches, servers, patch panels, and zone distribution areas in data centers and IT and telecom facilities, thereby driving the growth of this market for these verticals.
Which are the major opportunities in the pre-terminated sytsems market?
The extensive deployment of voice over internet protocol (VoIP), long-term evolution (LTE), and 5G networks across the world is expected to provide huge growth opportunities to players in the pre-terminated system market. As 2G and 3G networks are incapable of meeting the requirement of increased carrier capacity, the growing trend of LTE and 5G networks would open up opportunities for fiber optic cables and become a crucial part of data centers in the near future.
To speak to our analyst for a discussion on the above findings, click Speak to Analyst
 Exclusive indicates content/data unique to MarketsandMarkets and not available with any competitors.
Table of Contents
1 Introduction (Page No. - 18)
1.1 Study Objectives
1.2 Definition and Scope
1.2.1 Inclusions and Exclusions
1.3 Study Scope
1.3.1 Geographic Scope
1.3.2 Years Considered
1.4 Currency
1.5 Stakeholders
2 Research Methodology (Page No. - 22)
2.1 Research Data
2.1.1 Secondary Data
2.1.1.1 Major Secondary Sources
2.1.1.2 Secondary Sources
2.1.2 Primary Data
2.1.2.1 Primary Interviews With Experts
2.1.2.2 Key Data From Primary Sources
2.1.2.3 Key Industry Insights
2.1.2.4 Breakdown of Primaries
2.1.3 Secondary and Primary Research
2.2 Market Size Estimation
2.2.1 Bottom-Up Approach
2.2.1.1 Approach for Capturing Market Share By Bottom-Up Analysis (Demand Side)
2.2.2 Top-Down Approach
2.2.2.1 Approach for Capturing Market Share By Top-Down Analysis (Supply Side)
2.3 Market Breakdown and Data Triangulation
2.4 Research Assumptions
3 Executive Summary (Page No. - 31)
4 Premium Insights (Page No. - 35)
4.1 Attractive Opportunities in Pre-Terminated Systems Market
4.2 Market, By Offering
4.3 Market in APAC, By Vertical and Country
4.4 Market, By Country
5 Market Overview (Page No. - 38)
5.1 Introduction
5.2 Market Dynamics
5.2.1 Drivers
5.2.1.1 Increasing Establishment of Data Centers
5.2.1.2 Growing Demand for Transmission Bandwidth and Network Reliability
5.2.2 Restraints
5.2.2.1 High Implementation Cost of Pre-Terminated Systems
5.2.3 Opportunities
5.2.3.1 Growing Trend of VOIP, LTE, and 5G Networks
5.2.4 Challenges
5.2.4.1 Security Issues Related to Optical Networks
5.3 Value Chain Analysis
6 Pre-Terminated Systems Market, By Offering (Page No. - 43)
6.1 Introduction
6.2 Components
6.2.1 Cables
6.2.1.1 Cables Held Largest Size of Market, in Terms of Value, in 2018
6.2.1.1.1 Copper Cables
6.2.1.1.2 Fiber Cables
6.2.2 Connectors
6.2.2.1 Connectors are Used to Protect Cables From Damages
6.2.2.1.1 LC Connectors
6.2.2.1.2 MPO Connectors
6.2.2.1.3 MTP Connectors
6.2.3 Adapter Plates (Brackets)
6.2.3.1 Adapter Plates Work as Supporting Component to Connect Pre-Terminated Solutions
6.2.4 Patch Panels
6.2.4.1 Patch Panels Held A Significant Share of Market for Components, in Terms of Value, in 2018
6.2.5 Patch Cords
6.2.5.1 Market for Patch Cords to Grow at Highest CAGR During Forecast Period
6.2.6 Cassette Modules
6.2.6.1 MTP/MPO Cassettes are Essential for Duplex Cables
6.2.7 Pigtails
6.2.7.1 Pigtails Easily Support Both Ends of Fiber Cables for Extension of Cables
6.2.8 Fiber Enclosures
6.2.8.1 Fiber Enclosures Provide Safe Environment for Pre-Terminated Solutions
6.3 Services
6.3.1 Design and Engineering
6.3.1.1 Design and Engineering Services Play Important Role in Market for Proper Cabling Structure
6.3.2 Installation Services
6.3.2.1 Market for Installation Services to Grow at Highest CAGR During Forecast Period
6.3.3 Post-Installation Services
6.3.3.1 Post-Installation Services to Hold Significant Share of Market By 2024
7 Pre-Terminated Systems Market, By Vertical (Page No. - 58)
7.1 Introduction
7.2 Government & Defense
7.2.1 Increasing Digitization in Government & Defense Vertical is Driving Adoption of Pre-Terminated Systems
7.3 Enterprises & Data Centers
7.3.1 Enterprises & Data Centers Vertical to Witness Highest Growth Rate During Forecast Period
7.4 IT & Telecom
7.4.1 Growing Need for High-Reliability Solutions to Drive Use of Pre-Terminated Cable Systems in IT & Telecom Vertical
7.5 Energy & Utilities
7.5.1 Energy & Utilities Vertical to Witness Steady Growth Rate During Forecast Period
7.6 Manufacturing
7.6.1 Requirement for Efficient and Flexible Solutions to Manage Data Centers Boosts Adoption of Pre-Terminated Systems
7.7 Banking, Financial Services, and Insurance (BFSI)
7.7.1 Need for Reducing Overall Operational Costs for Online Services in Banking Sector Encourages Use of Data Center Solutions
7.8 Retail
7.8.1 Retail Stores are Likely to Employ Data Center Solutions and Services to Enhance Shopping Experience
7.9 Media & Entertainment
7.9.1 Demand for Proper Cabling Structure in Entertainment Industry Drives Demand for Pre-Terminated Solutions
7.10 Others
7.10.1 Need for Advanced Infrastructure in Modern Residential Buildings is Driving Market
8 Geographic Analysis (Page No. - 81)
8.1 Introduction
8.2 North America
8.2.1 US
8.2.1.1 US to Remain Largest Market for Pre-Terminated Systems in North America
8.2.2 Canada
8.2.2.1 High Adoption of Pre-Terminated Solutions in Data Centers Due to Increasing Data Traffic and Cloud-Based Services
8.2.3 Mexico
8.2.3.1 Pre-Terminated Solutions are Gaining Demand in Mexico Due to Increasing Use of Connectivity Services
8.3 Europe
8.3.1 UK
8.3.1.1 Growing Demand for Energy Efficiency and Long-Lasting Solutions in Data Centers to Drive Market in UK
8.3.2 Germany
8.3.2.1 Rising Demand for Well-Connected Data Centers to Drive Market
8.3.3 France
8.3.3.1 Growing Demand for High-Speed Connectivity to Propel Growth of Pre-Terminated Systems
8.3.4 Rest of Europe
8.4 APAC
8.4.1 China
8.4.1.1 Rapid Industrialization Leading to an Increase in Number of Data Center Facilities
8.4.2 Japan
8.4.2.1 Growing Adoption of Cloud Computing Services to Augment Market Growth of Pre-Terminated Systems in Japan
8.4.3 South Korea
8.4.3.1 Developing Energy-Efficient Labels and Standard Programs to Propel Growth of Market
8.4.4 Australia & New Zealand
8.4.4.1 High Per Capita GDP to Boost Growth of Market
8.4.5 India
8.4.5.1 Establishing National Program for Led-Based Home Lighting to Boost Market
8.4.6 Rest of APAC
8.5 RoW
8.5.1 Middle East & Africa
8.5.1.1 Middle East & Africa to Be Fastest-Growing Market in RoW
8.5.2 South America
8.5.2.1 Growing Government Initiatives for Communication Infrastructure to Boost Market
9 Competitive Landscape (Page No. - 108)
9.1 Introduction
9.2 Market Player Ranking Analysis
9.3 Competitive Leadership Mapping
9.3.1 Visionary Leaders
9.3.2 Innovators
9.3.3 Dynamic Differentiators
9.3.4 Emerging Companies
9.4 Competitive Benchmarking
9.4.1 Strength of Product Portfolio (25 Companies)
9.4.2 Business Strategy Excellence (25 Companies)
9.5 Competitive Scenario
9.6 Competitive Situations & Trends
9.6.1 Product Launches
9.6.2 Mergers/Acquisitions
9.6.3 Collaborations/Contracts/Agreements/Partnerships
9.6.4 Expansions
10 Company Profiles (Page No. - 122)
10.1 Introduction
(Business Overview, Products Offered, Recent Developments, SWOT Analysis, and MnM View)*
10.2 Key Players
10.2.1 TE Connectivity Ltd.
10.2.2 Optical Cable Corporation (OCC)
10.2.3 Corning Incorporated
10.2.4 Commscope Holding Company, Inc.
10.2.5 Amphenol Corporation
10.2.6 Hellermanntyton Group PLC (Aptiv PLC)
10.2.7 Huber+Suhner AG
10.2.8 Belden Inc.
10.2.9 Legrand SA
10.2.10 Nexans S.A.
10.3 Other Companies
10.3.1 The Cabling Company
10.3.2 Panduit Corp.
10.3.3 The Siemon Company
10.3.4 Leviton Manufacturing Co., Inc.
10.3.5 Schneider Electric SE
10.3.6 AFL (Fujikura Ltd.(Japan))
10.3.7 CABLExpress Corporation (Cxtec Inc.)
10.3.8 Connectix Ltd.
10.3.9 Reichle & De-Massari AG (R&M)
10.3.10 Comcore Connexions Pvt Ltd. (3c3)
*Details on Business Overview, Products Offered, Recent Developments, SWOT Analysis, and MnM View Might Not Be Captured in Case of Unlisted Companies.
11 Appendix (Page No. - 158)
11.1 Discussion Guide
11.2 Knowledge Store: Marketsandmarkets� Subscription Portal
11.3 Available Customizations
11.4 Related Reports
11.5 Author Details
List of Tables (104 Tables)
Table 1 Pre-Terminated Systems Market, By Offering, 2016�2024 (USD Million)
Table 2 Market, By Component, 2016�2024 (USD Million)
Table 3 Market, By Component, 2016�2024 (Thousand Units)
Table 4 Market for Components, By Region, 2016�2024 (USD Million)
Table 5 Market for Cables, By Type, 2016�2024 (USD Million)
Table 6 Market for Cables, By Region, 2016�2024 (USD Million)
Table 7 Market for Connectors, By Region, 2016�2024 (USD Million)
Table 8 Market for Adapter Plates, By Region, 2016�2024 (USD Million)
Table 9 Market for Patch Panels, By Region, 2016�2024 (USD Million)
Table 10 Market for Patch Cords, By Region, 2016�2024 (USD Million)
Table 11 Market for Cassette Modules, By Region, 2016�2024 (USD Million)
Table 12 Market for Pigtails, By Region, 2016�2024 (USD Million)
Table 13 Market for Fiber Enclosures, By Region, 2016�2024 (USD Million)
Table 14 Market, By Service, 2016�2024 (USD Million)
Table 15 Market for Services, By Region, 2016�2024 (USD Million)
Table 16 Systems Market for Design and Engineering Services, By Region, 2016�2024 (USD Million)
Table 17 Market for Installation Services, By Region, 2016�2024 (USD Million)
Table 18 Market for Post-Installation Services, By Region, 2016�2024 (USD Million)
Table 19 Market, By Vertical, 2016�2024 (USD Million)
Table 20 Market for Government & Defense, By Region, 2016�2024 (USD Million)
Table 21 Market for Government & Defense in North America, By Country, 2016�2024 (USD Million)
Table 22 Market for Government & Defense in Europe, By Country, 2016�2024 (USD Million)
Table 23 Market for Government & Defense in APAC, By Country, 2016�2024 (USD Million)
Table 24 Market for Government & Defense in RoW, By Region, 2016�2024 (USD Million)
Table 25 Market for Enterprises & Data Centers, By Region, 2016�2024 (USD Million)
Table 26 Market for Enterprises & Data Centers in North America, By Country, 2016�2024 (USD Million)
Table 27 Market for Enterprises & Data Centers in Europe, By Country, 2016�2024 (USD Million)
Table 28 Market for Enterprises & Data Centers in APAC, By Country, 2016�2024 (USD Million)
Table 29 Market for Enterprises & Data Centers in RoW, By Region, 2016�2024 (USD Million)
Table 30 Market for IT & Telecom, By Region, 2016�2024 (USD Million)
Table 31 Market for IT & Telecom in North America, By Country, 2016�2024 (USD Million)
Table 32 Market for IT & Telecom in Europe, By Country, 2016�2024 (USD Million)
Table 33 Market for IT & Telecom in APAC, By Country, 2016�2024 (USD Million)
Table 34 Market for IT & Telecom in RoW, By Region, 2016�2024 (USD Million)
Table 35 Market for Energy & Utilities, By Region, 2016�2024 (USD Million)
Table 36 Market for Energy & Utilities in North America, By Country, 2016�2024 (USD Million)
Table 37 Market for Energy & Utilities in Europe, By Country, 2016�2024 (USD Million)
Table 38 Market for Energy & Utilities in APAC, By Country, 2016�2024 (USD Million)
Table 39 Market for Energy & Utilities in RoW, By Region, 2016�2024 (USD Million)
Table 40 Market for Manufacturing, By Region, 2016�2024 (USD Million)
Table 41 Market for Manufacturing in North America, By Country, 2016�2024 (USD Million)
Table 42 Market for Manufacturing in Europe, By Country, 2016�2024 (USD Million)
Table 43 Market for Manufacturing in APAC, By Country, 2016�2024 (USD Million)
Table 44 Market for Manufacturing in RoW, By Region, 2016�2024 (USD Million)
Table 45 Market for BFSI, By Region, 2016�2024 (USD Million)
Table 46 Market for BFSI in North America, By Country, 2016�2024 (USD Million)
Table 47 Market for BFSI in Europe, By Country, 2016�2024 (USD Million)
Table 48 Market for BFSI in APAC, By Country, 2016�2024 (USD Million)
Table 49 Market for BFSI in RoW, By Region, 2016�2024 (USD Million)
Table 50 Market for Retail, By Region, 2016�2024 (USD Million)
Table 51 Market for Retail in North America, By Country, 2016�2024 (USD Million)
Table 52 Market for Retail in Europe, By Country, 2016�2024 (USD Million)
Table 53 Market for Retail in APAC, By Country, 2016�2024 (USD Million)
Table 54 Market for Retail in RoW, By Region, 2016�2024 (USD Million)
Table 55 Market for Media & Entertainment, By Region, 2016�2024 (USD Million)
Table 56 Market for Media & Entertainment in North America, By Country, 2016�2024 (USD Million)
Table 57 Market for Media & Entertainment in Europe, By Country, 2016�2024 (USD Million)
Table 58 Market for Media & Entertainment in APAC, By Country, 2016�2024 (USD Million)
Table 59 Market for Media & Entertainment in RoW, By Region, 2016�2024 (USD Million)
Table 60 Market for Other Verticals, By Region, 2016�2024 (USD Million)
Table 61 Market for Other Verticals in North America, By Country, 2016�2024 (USD Million)
Table 62 Market for Other Verticals in Europe, By Country, 2016�2024 (USD Million)
Table 63 Market for Other Verticals in APAC, By Country, 2016�2024 (USD Million)
Table 64 Market for Other Verticals in RoW, By Region, 2016�2024 (USD Million)
Table 65 Market, By Region, 2016�2024 (USD Million)
Table 66 Market in North America, By Offering, 2016�2024 (USD Million)
Table 67 Market in North America, By Component, 2016�2024 (USD Million)
Table 68 Market in North America for Services, By Type, 2016�2024 (USD Million)
Table 69 Market in North America, By Vertical, 2016�2024 (USD Million)
Table 70 Market in North America, By Country, 2016�2024 (USD Million)
Table 71 Market in US, By Offering, 2016�2024 (USD Million)
Table 72 Market in Canada, By Offering, 2016�2024 (USD Million)
Table 73 Market in Mexico, By Offering, 2016�2024 (USD Million)
Table 74 Market in Europe, By Offering, 2016�2024 (USD Million)
Table 75 Market in Europe, By Component, 2016�2024 (USD Million)
Table 76 Market in Europe for Services, By Type, 2016�2024 (USD Million)
Table 77 Market in Europe, By Vertical, 2016�2024 (USD Million)
Table 78 Market in Europe, By Country, 2016�2024 (USD Million)
Table 79 Market in UK, By Offering, 2016�2024 (USD Million)
Table 80 Market in Germany, By Offering, 2016�2024 (USD Million)
Table 81 Market in France, By Offering, 2016�2024 (USD Million)
Table 82 Market in Rest of Europe, By Offering, 2016�2024 (USD Million)
Table 83 Market in APAC, By Offering, 2016�2024 (USD Million)
Table 84 Market in APAC, By Component, 2016�2024 (USD Million)
Table 85 Pre-Terminated System Market in APAC for Services, By Type, 2016�2024 (USD Million)
Table 86 Market in APAC, By Vertical, 2016�2024 (USD Million)
Table 87 Market in APAC, By Country, 2016�2024 (USD Million)
Table 88 Market in China, By Offering, 2016�2024 (USD Million)
Table 89 Market in Japan, By Offering, 2016�2024 (USD Million)
Table 90 Market in South Korea, By Offering, 2016�2024 (USD Million)
Table 91 Market in Australia & New Zealand, By Offering, 2016�2024 (USD Million)
Table 92 Market in India, By Offering, 2016�2024 (USD Million)
Table 93 Market in Rest of APAC, By Offering, 2016�2024 (USD Million)
Table 94 Market in RoW, By Offering, 2016�2024 (USD Million)
Table 95 Market in RoW, By Component, 2016�2024 (USD Million)
Table 96 Market in RoW for Services, By Type, 2016�2024 (USD Million)
Table 97 Market in RoW, By Vertical, 2016�2024 (USD Million)
Table 98 Market in RoW, By Region, 2016�2024 (USD Million)
Table 99 Market in Middle East & Africa, By Offering, 2016�2024 (USD Million)
Table 100 Market in South America, By Offering, 2016�2024 (USD Million)
Table 101 Product Launches (2016�2019)
Table 102 Mergers/Acquisitions (2016�2019)
Table 103 Collaborations/Contracts/Agreements/Partnerships (2016�2019)
Table 104 Expansions (2017�2019)
List of Figures (43 Figures)
Figure 1 Pre-Terminated Systems Market Segmentation
Figure 2 Market: Research Design
Figure 3 Market Size Estimation Methodology: Bottom-Up Approach
Figure 4 Market Size Estimation Methodology: Top-Down Approach
Figure 5 Data Triangulation
Figure 6 Assumptions for Research Study
Figure 7 Pre-Terminated Systems Market, 2016�2024 (USD Billion)
Figure 8 Market, By Offering (2019 vs 2024)
Figure 9 Cables Held Major Share of Market for Components in 2018
Figure 10 Market for Enetrprises & Data Centers Vertical to Grow at Highest CAGR From 2019 to 2024
Figure 11 APAC to Hold Largest Share of Market in 2019
Figure 12 Increasing Deployment of Data Centers to Boost Growth of Market During Forecast Period
Figure 13 Pre-Terminated Systems Market for Components to Grow at Higher CAGR From 2019 to 2024
Figure 14 Copper Cables to Hold Larger Size of Market for Components By 2024
Figure 15 Enterprises & Data Centers Vertical and China Accounted for Largest Share of Market in APAC in 2018
Figure 16 Market in Australia & New Zealand to Grow at Highest CAGR During Forecast Period
Figure 17 Impact of Drivers and Opportunities on Market
Figure 18 Impact of Challenges and Restraints on Market
Figure 19 Major Value Added By Component Suppliers and Original Equipment Manufacturers
Figure 20 Pre-Terminated Systems Market for Components to Grow at Higher CAGR From 2019 to 2024
Figure 21 Cables to Hold Largest Size of Market for Components By 2024
Figure 22 Market for Installation Services to Grow at Highest CAGR From 2019 to 2024
Figure 23 Market for Enterprises & Data Centers to Grow at Highest CAGR From 2019 to 2024
Figure 24 Market for Energy & Utilities Vertical in APAC to Grow at Highest CAGR From 2019 to 2024
Figure 25 Market for Media & Entertainment Vertical in APAC to Grow at Highest CAGR From 2019 to 2024
Figure 26 Geographic Snapshot: Market in APAC to Witness Highest CAGR From 2019 to 2024
Figure 27 APAC to Command Overall Market During Forecast Period
Figure 28 North America: Market Snapshot
Figure 29 Europe: Market Snapshot
Figure 30 APAC: Market Snapshot
Figure 31 Companies Adopted Product Launches as Key Growth Strategies During 2016�2019
Figure 32 TE Connectivity Ltd. (Switzerland), Lead Market in 2018
Figure 33 Market (Global) Competitive Leadership Mapping, 2018
Figure 34 Evaluation Framework: Pre-Terminated Systems Market
Figure 35 TE Connectivity Ltd.: Company Snapshot
Figure 36 Optical Cable Corporation: Company Snapshot
Figure 37 Corning Incorporated: Company Snapshot
Figure 38 Commscope Holding Company, Inc.: Company Snapshot
Figure 39 Amphenol Corporation: Company Snapshot
Figure 40 Huber+Suhner AG: Company Snapshot
Figure 41 Belden, Inc.: Company Snapshot
Figure 42 Legrand SA: Company Snapshot
Figure 43 Nexans S.A.: Company Snapshot
The study involved 4 major activities in estimating the current size of the pre-terminated systems market. Exhaustive secondary research has been done to collect information on the market, the peer market, and the parent market. The next step has been to validate these findings, assumptions, and sizing with industry experts from across the value chain through primary research. Both top-down and bottom-up approaches have been employed to estimate the complete market size. After that, market breakdown and data triangulation methods have been used to estimate the market sizes of segments and subsegments.
Secondary Research
The research methodology used to estimate and forecast the pre-terminated systems market begins with capturing data on revenues of key vendors in the market through secondary research. This study involves the use of extensive secondary sources, directories, and databases such as Hoovers, Bloomberg Businessweek, Factiva, and OneSource to identify and collect information useful for the technical, market-oriented, and commercial study of the pre-terminated systems market. Vendor offerings have also been taken into consideration to determine the market segmentation. This entire research methodology includes studying annual and financial reports of top players, presentations, press releases, journals, paid databases, trade directories, regulatory bodies, and safety standard organizations.
Primary Research
The pre-terminated systems market�s supply chain comprises several stakeholders, such as suppliers of standard components, original equipment manufacturers (OEMs), component providers, solutions providers, and system integrators. The supply side is characterized by advancements in pre-terminated components and their applications in diverse verticals. Various primary sources from both the supply and demand sides of the market have been interviewed to obtain qualitative and quantitative information. The breakdown of primary respondents is as follows.
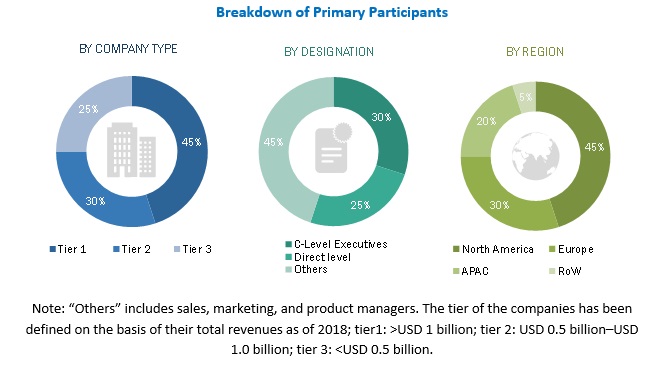
To know about the assumptions considered for the study, download the pdf brochure
Market Size Estimation
Both top-down and bottom-up approaches have been used to estimate and validate the size of the pre-terminated systems market and various market subsegments. The research methodology used to estimate the market sizes includes the following:
- Key players providing pre-terminated solutions to different verticals have been identified through extensive secondary research.
- The industry�s supply chain and market size, in terms of value, have been determined through primary and secondary research processes.
- All percentage shares, splits, and breakdowns have been determined using secondary sources and verified through primary sources.
Data Triangulation
After arriving at the overall market size using the estimation processes as explained above the market has been split into several segments and subsegments. To complete the overall market engineering process and arrive at the exact statistics of each market segment and subsegment, data triangulation and market breakdown procedures have been employed, wherever applicable. The data has been triangulated by studying various factors and trends from both the demand and supply sides of pre-terminated components.
Research Objective
- To define and forecast the overall pre-terminated systems market, by offering, vertical, and geography, in terms of value
- To define and forecast the overall market for components (part of the offering segment) of pre-terminated systems market, in terms of volume
- To forecast the market size for various segments with regard to 4 main regions�North America, Europe, Asia Pacific (APAC), and the Rest of the World (RoW)
- To provide detailed information regarding major factors (drivers, restraints, opportunities, and challenges) influencing the growth of the pre-terminated systems market
- To provide a detailed overview of the pre-terminated system value chain
- To strategically analyze the micromarkets with respect to individual growth trends, prospects, and contribution to the overall pre-terminated systems market
- To analyze opportunities in the overall pre-terminated systems market for stakeholders by identifying high-growth segments
- To strategically profile the key players, comprehensively analyze their market ranking and core competencies, and provide a detailed competitive landscape of the market leaders
- To analyze competitive developments such as contracts, mergers and acquisitions, product launches, and research and development (R&D) activities in the overall pre-terminated systems market
Available Customizations:
Along with the market data, MarketsandMarkets offers customizations according to a company�s specific needs. The following customization options are available for the report:
Company Information
- Detailed analysis and profiling of additional market players (Up to 5)
Critical Questions:
- What will be the new verticals in which pre-terminated cabling solutions be used?
- Who are the key players in the market, and how intense is the competition?


Growth opportunities and latent adjacency in Pre-terminated Systems Market