Pressure Vessels Market by Type (Boilers, Reactors, Separators), Material, Heat Source (Fired Pressure Vessel and Unfired Pressure Vessel), Application (Storage Vessels and Processing Vessels), End-User Industry and Region - Global Forecast to 2028
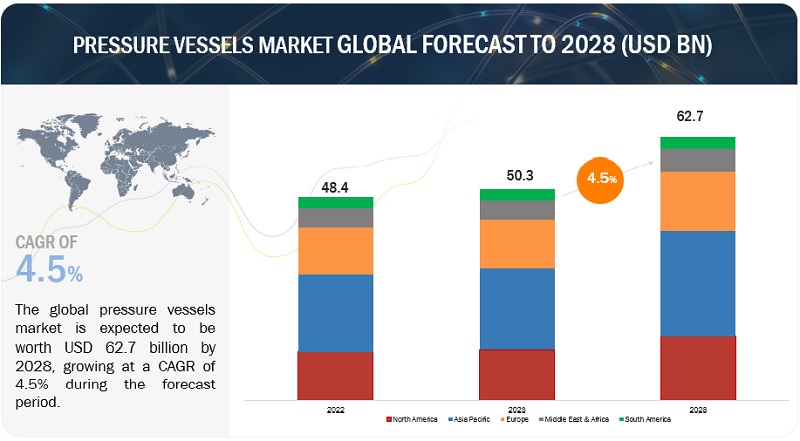
The global pressure vessels market size was estimated at USD 50.3 billion in 2023 and is projected to reach USD 62.7 billion by 2028, growing at a CAGR of 4.5% from 2023 to 2028. The increasing global energy demand, driven by population growth, urbanization, and industrialization, is a significant driver for the pressure vessel market. Pressure vessels are integral components of power generation systems, including fossil fuel power plants, nuclear power plants, and renewable energy installations, such as geothermal power plants.
To know about the assumptions considered for the study, Request for Free Sample Report
To know about the assumptions considered for the study, download the pdf brochure
Pressure Vessels Market Dynamics
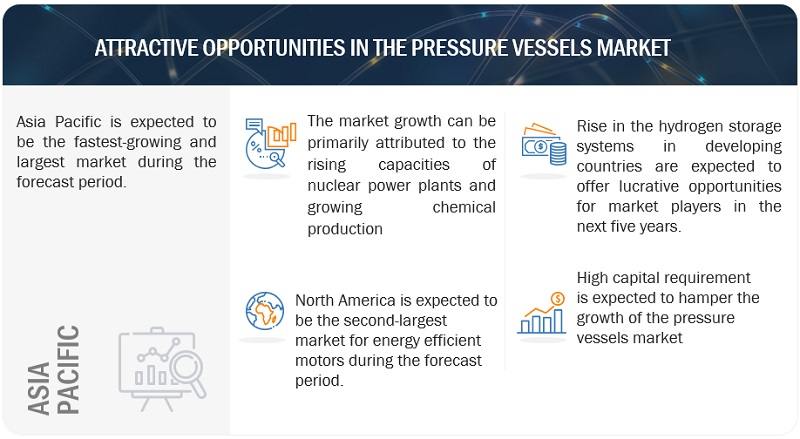
Driver: Growing chemical production world-wide
The chemical and petrochemical industry is a significant consumer of pressure vessels. As this industry continues to grow, driven by factors like increasing demand for chemicals and plastics, pressure vessels are required for various processing operations, including chemical reactions, distillation, mixing, and storage of chemicals. This shift is driven by the need for innovative and customized chemicals that offer enhanced functionalities and meet specific requirements.
Moreover, stricter safety regulations and quality standards imposed by governments and industry bodies further drive the demand for reliable and compliant pressure vessels in the chemical sector. Industries must ensure that pressure vessels meet the necessary standards to ensure the safety of workers, communities, and the environment.
Restraint: High manufacturing and maintenance costs
Pressure vessels require specialized design and engineering to meet stringent safety standards and regulatory requirements. Designing a pressure vessel involves complex calculations, material selection, and ensuring structural integrity. These design complexities can contribute to higher manufacturing costs. These products are constructed using high-strength materials such as stainless steel, carbon steel, or alloy metals. These materials have excellent mechanical properties and can withstand high pressures and temperatures. However, they tend to be more expensive compared to standard structural materials. Once the pressure vessels are manufactured, they need to undergo rigorous inspection and testing procedures to ensure their safety and compliance with regulatory standards. These inspections involve non-destructive testing techniques and may require third-party certification, which adds to the overall manufacturing costs.
Opportunities: Increase in the nuclear power generation worldwide
As existing nuclear power plants age, there is a need for replacement and refurbishment of certain components, including pressure vessels. Over time, pressure vessels may experience wear, corrosion, or fatigue, and their replacement or refurbishment becomes necessary. The increase in nuclear power generation can drive the need for such replacements or refurbishments, creating opportunities for the pressure vessel market.
Challenges: Stringent standards in manufacturing of pressure vessels
Stringent standards play a crucial role in the manufacturing of pressure vessels to ensure their safety, reliability, and compliance with regulatory requirements. Standards majorly concentrate on parameters such as Design Codes and Standards, Material Selection and Specifications, Design and Engineering Calculations, Fabrication and Welding Procedures, Inspection and Testing Requirements, Certification and Compliance, Compliance with Regulatory Authorities.
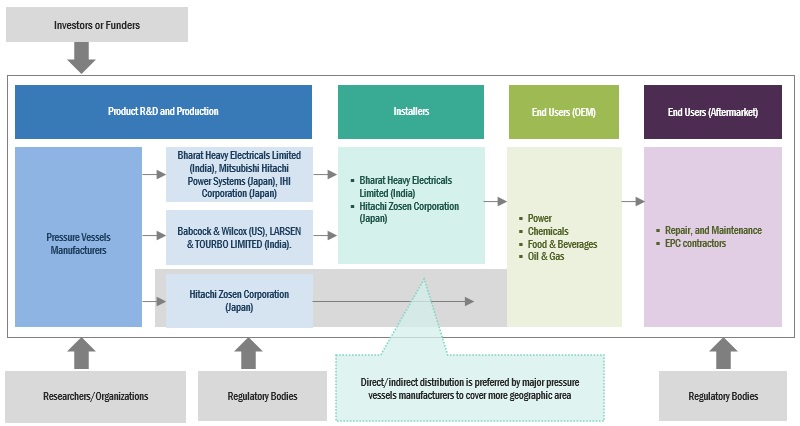
Pressure Vessels Market Ecosystem
Prominent companies in this pressure vessel industry include well-established, financially stable manufacturers of Pressure vessels systems and components. These companies have been operating in the market for several years and possess a diversified product portfolio, state-of-the-art technologies, and strong global sales and marketing networks. Prominent companies in this market include Bharat Heavy Electricals Limited (India), Mitsubishi Hitachi Power Systems (Japan), IHI Coproration (Japan), Babcock & Wilcox (US), LARSEN & TOURBO LIMITED (India).
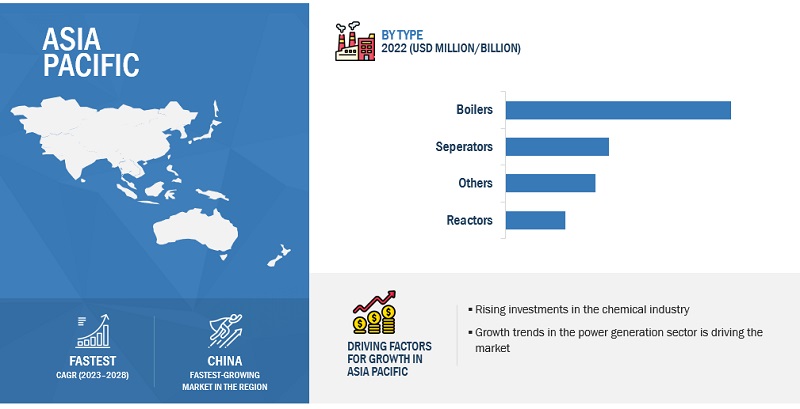
The boilers segment, by type, is expected to be the largest market during the forecast period.
This report segments the pressure vessels market size based on types into five types: boilers, seperators, reactors, and other which include heat exchangers, and flash drums. Pressure vessels are an integral part of boilers used in power plants. They contain water or steam under high pressure, which is heated to generate steam that drives turbines for electricity generation. The trends such as growing chemical production, new technologies such as super critical boilers are pushing the demand for this segment.
By Heat Source, the unfired pressure vessels segment is expected to be the fastest during the forecast period
This report segments the pressure vessels market based on components into heat source segments: fired pressure vessels and unfired pressure vessels. Unfired pressure vessels are utilized in a wide range of industries, including chemical processing, pharmaceuticals, food and beverage, power generation, and many more. They are designed to store or process liquids, gases, or vapors without the need for direct firing or heating elements. These vessels are constructed to withstand high-pressure conditions, ensuring the safety of personnel and equipment
“Asia Pacific”: The largest in the pressure vessels market”
Asia Pacific is expected to largest region in the pressure vessel market size between 2023–2028, followed by the North America, Europe. The Asia Pacific region is witnessing robust industrial growth, including sectors such as oil and gas, chemical and petrochemical, power generation, food and beverage, pharmaceuticals, and more. These industries require pressure vessels for various processing, storage, and transportation applications, thereby driving the demand for pressure vessels in the region.
Key Market Players
The pressure vessels market is dominated by a few major players that have a wide regional presence. The major players in the pressure vessel market are Bharat Heavy Electricals Limited (India), Mitsubishi Hitachi Power Systems (Japan), IHI Coproration (Japan), Babcock & Wilcox (US), LKARSEN & TOURBO LIMITED (India). Between 2018 and 2022, Strategies such as product launches, contracts, agreements, partnerships, collaborations, alliances, acquisitions, and expansions are followed by these companies to capture a larger pressure vessels market share.
Scope of the Report
|
Report Metric |
Details |
|
Market size available for years |
2021–2028 |
|
Base year considered |
2022 |
|
Forecast period |
2023–2028 |
|
Forecast units |
Value (USD Million/Billion) |
|
Segments covered |
Pressure vessels market by type, heat source, application, end-user industry, and region. |
|
Geographies covered |
Asia Pacific, North America, Europe, South America, and Middle East & Africa. |
|
Companies covered |
Babcock & Wilcox Enterprises (US), General Electric (US), LARSEN & TOURBO LIMITED (India), Mitsubishi Hitachi Power Systems (Japan), Hitachi Zosen Corporation (Japan), IHI Corporation (Japan), Bharat Heavy Electricals Limited (India), Buhman Mecatec (Japan), Dongfang Turbine Co., Ltd (China), Samuel, Son & Co. (Canada), Westinghouse Electric Company (US), Halvorsen Company (US), Pressure Vessels (India) (India), Kelvion Holding GmBh (Germany), VI Flow (Sweden), Ergil (US), Gladwin Tank (US), Robinson Pipe & Vessel (US), Halliburton (US), Alfa Laval (Sweden) |
This research report categorizes the pressure vessel market by component, power source, application, and region.
On the basis of by type, the pressure vessels market has been segmented as follows:
- Boilers
- Seperators
- Reactors
- Other types
On the basis of heat source, the pressure vessel market has been segmented as follows:
- Fired Pressure Vessels
- Unfired Pressure Vessels
On the basis of application, the pressure vessel market has been segmented as follows:
- Storage Vessels
- Processing Vessels
On the basis of end-user Industry, the pressure vessel market has been segmented as follows:
- Power
- Oil & Gas
- Food & Beverages
- Pharmaceuticals
- Chemicals
- Others
On the basis of region, the pressure vessel market has been segmented as follows:
- Asia Pacific
- Europe
- North America
- Middle East & Africa
- South America
Recent Developments
- In December 2022, Bharat Heavy Electricals Limited (BHEL) has entered into a long-term Technology License Agreement (TLA) with Sumitomo SHI FW, Finland (SFW) for design, engineering, manufacturing, erection, commissioning and sale of subcritical as well as supercritical Circulating Fluidised Bed Combustion (CFBC) Boilers in India and in overseas territories except select countries.
- In May 2021, IHI Corporation (IHI) has decided to enter the Small Modular Reactor (SMR) market by investing in NuScale Power, LLC (NuScale), a U.S.-based developer of SMR technology, with JGC Holdings Corporation.
- In February 2021, The industry has experienced sweeping changes in the market demand for coal-fired power generation that have led to a sharp contraction in new plant construction. Addressing the market situation, Mitsubishi Power which is a parent company of Mitsubishi Hitachi Power Systems will consolidate the boiler manufacturing function of new construction and after-sales service, as well as the new facility design and the construction function, at the Nagasaki Works. At the Kure Works, management resources will be shifted to the boiler design and engineering services business and Air Quality Control System (AQCS) business, with the objective of strengthening competitiveness in both businesses.
- In January 2023, LARSEN & TOUBRO LIMITED announced the signing of a Memorandum of Understanding (MoU) with the Norway-based H2Carrier (H2C) to co-operate towards developing floating green ammonia projects for industrial-scale applications with an aim to decarbonise the global economy. H2C has proven expertise in developing and integrating Power-to-X (PtX) projects based on affordable, often stranded, non-commercial renewable power. Under the terms of the MoU, L&T will become a partner for EPCIC of the topsides for H2C’s floating process plants.
Frequently Asked Questions (FAQ):
What is the current size of the pressure vessels market?
The current market size of the pressure vessels market is USD 48.4 billion in 2022.
What are the major drivers for the pressure vessels market?
Growing chemical production worldwide, and Increase in the oil & gas activities has been driving the market
Which is the largest region during the forecasted period in the pressure vessels market?
Asia Pacific is expected to largest region in the pressure vessels market size between 2023–2028, followed by the North America, Europe. The Asia Pacific region is witnessing robust industrial growth, including sectors such as oil and gas, chemical and petrochemical, power generation, food and beverage, pharmaceuticals, and more.
Which is the largest segment, by type during the forecasted period in the pressure vessels market?
The boilers segment is expected to be the largest market during the forecast period. Pressure vessels are an integral part of boilers used in power plants. They contain water or steam under high pressure, which is heated to generate steam that drives turbines for electricity generation.
Which is the fastest segment, by the Heat Source, during the forecasted period in the pressure vessels market?
The Unfired pressure vessels are utilized in a wide range of industries, including chemical processing, pharmaceutical, food and beverage, power generation, and many more. They are designed to store or process liquids, gases, or vapors without the need for direct firing or heating elements. These vessels are constructed to withstand high-pressure conditions, ensuring the safety of personnel and equipment
To speak to our analyst for a discussion on the above findings, click Speak to Analyst


- 5.1 INTRODUCTION
-
5.2 MARKET DYNAMICSDRIVERS- Growing chemical production industry- Thriving oil & gas industryRESTRAINTS- High manufacturing and maintenance costsOPPORTUNITIES- Increasing focus on nuclear power generation- Evolving technologies such as hydrogen storage systemsCHALLENGES- Stringent manufacturing standards and quality guidelines to be followed by pressure vessel manufacturers- Volatile prices of raw materials
-
5.3 TRENDS/DISRUPTIONS IMPACTING CUSTOMER BUSINESSREVENUE SHIFTS AND NEW REVENUE POCKETS FOR PRESSURE VESSEL MANUFACTURERS
- 5.4 MARKET MAPPING
-
5.5 VALUE CHAIN ANALYSISRAW MATERIAL PROVIDERS/SUPPLIERSCOMPONENT MANUFACTURERSPRESSURE VESSEL MANUFACTURERS/ASSEMBLERSDISTRIBUTORS/END USERSPOST-SALES SERVICE PROVIDERS
- 5.6 AVERAGE SELLING PRICE (ASP) ANALYSIS
-
5.7 TECHNOLOGY ANALYSISHYDROGEN STORAGE SYSTEMS
-
5.8 TARIFF AND REGULATORY LANDSCAPETARIFF FOR PRESSURE VESSEL COMPONENTS CLASSIFIED UNDER HS CODE 8402TARIFF FOR PRESSURE VESSEL COMPONENTS CLASSIFIED UNDER HS CODE 8401TARIFF FOR PRESSURE VESSEL COMPONENTS CLASSIFIED UNDER HS CODE 8507TARIFF FOR PRESSURE VESSEL COMPONENTS CLASSIFIED UNDER HS CODE 841950REGULATORY BODIES, GOVERNMENT AGENCIES, AND OTHER ORGANIZATIONSCODES AND REGULATIONS RELATED TO PRESSURE VESSELS
-
5.9 PATENT ANALYSIS
-
5.10 TRADE ANALYSISEXPORT SCENARIOIMPORT SCENARIO
-
5.11 CASE STUDY ANALYSISSCIENTISTS FROM IMPERIAL COLLEGE USED NUCLEAR FUEL CLADDING TECHNIQUE TO ENHANCE FUEL EFFICIENCY AND IMPROVE REACTOR SAFETY STANDARDSBABCOCK WANSON DEPLOYED BOILERS AT BEDFORD HOSPITAL FOR PRECISE CONTROL OVER STEAM OUTPUT AND QUALITY
- 5.12 KEY CONFERENCES AND EVENTS, 2023–2024
-
5.13 PORTER’S FIVE FORCES ANALYSISTHREAT OF NEW ENTRANTSBARGAINING POWER OF SUPPLIERSBARGAINING POWER OF BUYERSTHREAT OF SUBSTITUTESINTENSITY OF COMPETITIVE RIVALRY
-
5.14 KEY STAKEHOLDERS AND BUYING CRITERIAKEY STAKEHOLDERS IN BUYING PROCESSMAJOR BUYING CRITERIA
- 6.1 INTRODUCTION
-
6.2 PRESSURE VESSEL MATERIALSTITANIUMNICKEL ALLOYSALUMINUMOTHER PRESSURE VESSEL MATERIALS
-
6.3 CLADDING MATERIALSTITANIUMSTAINLESS STEELTANTALUMNICKEL ALLOYSZIRCONIUM
- 7.1 INTRODUCTION
-
7.2 STORAGE VESSELSHIGH STORAGE CAPACITY AND FLEXIBILITY IN TRANSPORTATION TO STIMULATE DEMAND FOR STORAGE VESSELS
-
7.3 PROCESSING VESSELSADVANCEMENTS IN DESIGNING AND MANUFACTURING PROCESSES TO ACCELERATE DEMAND FOR PROCESS VESSELS
- 8.1 INTRODUCTION
-
8.2 FIRED PRESSURE VESSELSINCREASING REQUIREMENT FOR FIRED PRESSURE VESSELS IN POWER PLANTS TO CONTRIBUTE TO MARKET GROWTH
-
8.3 UNFIRED PRESSURE VESSELSLOWER INITIAL INVESTMENTS AND REDUCED OPERATIONAL EXPENSES TO BOOST SEGMENTAL GROWTH
- 9.1 INTRODUCTION
-
9.2 BOILERSDEPENDENCE OF DEVELOPING COUNTRIES ON THERMAL POWER PLANTS TO PRODUCE ELECTRICITY TO STIMULATE SEGMENTAL GROWTH
-
9.3 REACTORSINVESTMENTS IN NUCLEAR POWER GENERATION TO DRIVE MARKET
-
9.4 SEPARATORSGROWING OIL & GAS OPERATIONS IN MIDDLE EAST AND ASIA PACIFIC TO BOOST SEGMENTAL GROWTH
- 9.5 OTHER TYPES
- 10.1 INTRODUCTION
-
10.2 POWERTECHNOLOGICAL ADVANCEMENTS IN POWER INDUSTRY TO DRIVE MARKET
-
10.3 OIL & GASDEVELOPMENT OF UNCONVENTIONAL RESOURCES TO CREATE OPPORTUNITIES FOR PRESSURE VESSEL PROVIDERS
-
10.4 FOOD & BEVERAGEFOCUS ON DOWNTIME REDUCTION AND PRODUCTION OPTIMIZATION TO INCREASE DEMAND FOR PRESSURE VESSELS
-
10.5 PHARMACEUTICALTHRIVING PHRMA INDUSTRY IN ASIA PACIFIC, LATIN AMERICA, AND AFRICA TO BOOST DEMAND FOR PRESSURE VESSELS
-
10.6 CHEMICALLARGE-SCALE CONSTRUCTION OF CHEMICAL REFINERIES IN ASIA PACIFIC TO PROPEL MARKET
- 10.7 OTHER END-USER INDUSTRIES
- 11.1 INTRODUCTION
-
11.2 ASIA PACIFICRECESSION IMPACT: ASIA PACIFICBY TYPEBY HEAT SOURCEBY END-USER INDUSTRYBY COUNTRY- China- India- Japan- Australia- South Korea- Malaysia- Indonesia- Rest of Asia Pacific
-
11.3 NORTH AMERICARECESSION IMPACT: NORTH AMERICABY TYPEBY APPLICATIONBY HEAT SOURCEBY END-USER INDUSTRYBY COUNTRY- US- Canada- Mexico
-
11.4 EUROPERECESSION IMPACT: EUROPEBY TYPEBY APPLICATIONBY HEAT SOURCEBY END-USER INDUSTRYBY COUNTRY- Germany- UK- France- Russia- Rest of Europe
-
11.5 MIDDLE EAST & AFRICARECESSION IMPACT: MIDDLE EAST & AFRICABY TYPEBY APPLICATIONBY HEAT SOURCEBY END-USER INDUSTRY- Saudi Arabia- UAE- South Africa- Algeria- Nigeria- Rest of Middle East & Africa
-
11.6 SOUTH AMERICARECESSION IMPACT: SOUTH AMERICABY TYPEBY APPLICATIONBY HEAT SOURCEBY END-USER INDUSTRYBY COUNTRY- Brazil- Argentina- Rest of South America

- 12.1 GROWTH STRATEGIES ADOPTED BY KEY PLAYERS
- 12.2 MARKET SHARE ANALYSIS OF TOP 5 PLAYERS, 2021
- 12.3 PRESSURE VESSELS MARKET SHARE ANALYSIS, 2021
- 12.4 REVENUE ANALYSIS OF TOP 5 MARKET PLAYERS
-
12.5 COMPANY EVALUATION QUADRANTSTARSPERVASIVE PLAYERSEMERGING LEADERSPARTICIPANTS
-
12.6 START-UPS/SMES EVALUATION QUADRANTPROGRESSIVE COMPANIESRESPONSIVE COMPANIESDYNAMIC COMPANIESSTARTING BLOCKS
- 12.7 COMPETITIVE BENCHMARKING
- 12.8 MARKET: COMPANY FOOTPRINT
- 12.9 COMPETITIVE SCENARIO
-
13.1 KEY PLAYERSBHARAT HEAVY ELECTRICALS LIMITED- Business overview- Products/Services offered- Recent developments- MnM viewMITSUBISHI HITACHI POWER SYSTEMS- Business overview- Products/Services offered- Recent developments- MnM viewIHI CORPORATION- Business overview- Products/Services offered- Recent developments- MnM viewLARSEN & TOUBRO LIMITED- Business overview- Products/Services offered- Recent developments- MnM viewBUMHAN MECATEC- Business overview- Products/Services offered- Recent developments- MnM viewGENERAL ELECTRIC- Business overview- Products/Services offered- Recent developmentsBABCOCK & WILCOX ENTERPRISES- Business overview- Products/Services offered- Recent developments- MnM viewHITACHI ZOSEN CORPORATION- Business overview- Products/Services offered- Recent developmentsDONGFANG TURBINE CO., LTD.- Business overview- Products/Services offeredSAMUEL, SON & CO.- Business overview- Products/Services offered- Recent developmentsWESTINGHOUSE ELECTRIC COMPANY- Business overview- Products/Services offered- Recent developmentsHALVORSEN COMPANY- Business overview- Products/Services offeredPRESSURE VESSELS (INDIA)- Business overview- Products/Services offeredKELVION HOLDING GMBH- Business overview- Products/Services offered- Recent developmentsVIFLOW- Business overview- Products/Services offered
-
13.2 OTHER PLAYERSERGILGLADWIN TANKROBINSON PIPE & VESSELHALLIBURTONALFA LAVAL
- 14.1 INSIGHTS FROM INDUSTRY EXPERTS
- 14.2 DISCUSSION GUIDE
- 14.3 KNOWLEDGESTORE: MARKETSANDMARKETS’ SUBSCRIPTION PORTAL
- 14.4 CUSTOMIZATION OPTIONS
- 14.5 RELATED REPORTS
- 14.6 AUTHOR DETAILS
- TABLE 1 SNAPSHOT OF PRESSURE VESSELS MARKET, 2023 VS. 2028
- TABLE 2 NEW REACTORS UNDER CONSTRUCTION (AS OF DECEMBER 31, 2021)
- TABLE 3 PRESSURE VESSELS MARKET: ECOSYSTEM ANALYSIS
- TABLE 4 AVERAGE SELLING PRICE OF PRESSURE VESSELS, BY TYPE, 2021 VS. 2028 (USD)
- TABLE 5 AVERAGE SELLING PRICE OF PRESSURE VESSELS, BY REGION, 2021 VS. 2028 (USD)
- TABLE 6 NORTH AMERICA: LIST OF REGULATORY BODIES, GOVERNMENT AGENCIES, AND OTHER ORGANIZATIONS
- TABLE 7 EUROPE: LIST OF REGULATORY BODIES, GOVERNMENT AGENCIES, AND OTHER ORGANIZATIONS
- TABLE 8 ASIA PACIFIC: LIST OF REGULATORY BODIES, GOVERNMENT AGENCIES, AND OTHER ORGANIZATIONS
- TABLE 9 GLOBAL: LIST OF REGULATORY BODIES, GOVERNMENT AGENCIES, AND OTHER ORGANIZATIONS
- TABLE 10 MARKET: CODES AND REGULATIONS
- TABLE 11 MARKET: INNOVATION AND PATENT REGISTRATION
- TABLE 12 EXPORT SCENARIO FOR HS CODE 8401, BY COUNTRY, 2020–2022 (USD THOUSAND)
- TABLE 13 IMPORT SCENARIO FOR HS CODE 8401, BY COUNTRY, 2020–2022 (USD THOUSAND)
- TABLE 14 MARKET: LIST OF CONFERENCES AND EVENTS
- TABLE 15 PRESSURE VESSELS MARKET: PORTER’S FIVE FORCES ANALYSIS
- TABLE 16 INFLUENCE OF STAKEHOLDERS ON BUYING PROCESS, BY END-USER INDUSTRY (%)
- TABLE 17 KEY BUYING CRITERIA, BY END-USER INDUSTRY
- TABLE 18 PRESSURE VESSELS MARKET, BY APPLICATION, 2021–2028 (USD MILLION)
- TABLE 19 STORAGE VESSELS: MARKET, BY REGION, 2021–2028 (USD MILLION)
- TABLE 20 PROCESSING VESSELS: MARKET, BY REGION, 2021–2028 (USD MILLION)
- TABLE 21 PRESSURE VESSELS MARKET, BY HEAT SOURCE, 2021–2028 (USD MILLION)
- TABLE 22 FIRED PRESSURE VESSELS: MARKET, BY REGION, 2021–2028 (USD MILLION)
- TABLE 23 UNFIRED PRESSURE VESSELS: MARKET, BY REGION, 2021–2028 (USD MILLION)
- TABLE 24 PRESSURE VESSELS MARKET, BY TYPE, 2021–2028 (USD MILLION)
- TABLE 25 BOILERS: MARKET, BY REGION, 2021–2028 (USD MILLION)
- TABLE 26 REACTORS: MARKET, BY REGION, 2021–2028 (USD MILLION)
- TABLE 27 SEPARATORS: MARKET, BY REGION, 2021–2028 (USD MILLION)
- TABLE 28 OTHER TYPES: MARKET, BY REGION, 2021–2028 (USD MILLION)
- TABLE 29 PRESSURE VESSELS MARKET, BY END-USER INDUSTRY, 2021–2028 (USD MILLION)
- TABLE 30 POWER: MARKET, BY REGION, 2021–2028 (USD MILLION)
- TABLE 31 OIL & GAS: MARKET, BY REGION, 2021–2028 (USD MILLION)
- TABLE 32 FOOD & BEVERAGE: MARKET, BY REGION, 2021–2028 (USD MILLION)
- TABLE 33 PHARMACEUTICAL: MARKET, BY REGION, 2021–2028 (USD MILLION)
- TABLE 34 CHEMICAL: MARKET, BY REGION, 2021–2028 (USD MILLION)
- TABLE 35 OTHER END-USER INDUSTRIES: MARKET, BY REGION, 2021–2028 (USD MILLION)
- TABLE 36 MARKET, IN TERMS OF VOLUME, 2021–2028 (MILLION UNITS)
- TABLE 37 PRESSURE VESSELS MARKET, IN TERMS OF VALUE, 2021–2028 (USD MILLION)
- TABLE 38 ASIA PACIFIC: PRESSURE VESSELS MARKET, BY TYPE, 2021–2028 (USD MILLION)
- TABLE 39 ASIA PACIFIC: MARKET, BY HEAT SOURCE, 2021–2028 (USD MILLION)
- TABLE 40 ASIA PACIFIC: MARKET, BY END-USER INDUSTRY, 2021–2028 (USD MILLION)
- TABLE 41 ASIA PACIFIC: MARKET, BY COUNTRY, 2021–2028 (USD MILLION)
- TABLE 42 CHINA: MARKET, BY END-USER INDUSTRY, 2021–2028 (USD MILLION)
- TABLE 43 INDIA: MARKET, BY END-USER INDUSTRY, 2021–2028 (USD MILLION)
- TABLE 44 JAPAN: MARKET, BY END-USER INDUSTRY, 2021–2028 (USD MILLION)
- TABLE 45 AUSTRALIA: MARKET, BY END-USER INDUSTRY, 2021–2028 (USD MILLION)
- TABLE 46 SOUTH KOREA: PRESSURE VESSELS MARKET, BY END-USER INDUSTRY, 2021–2028 (USD MILLION)
- TABLE 47 MALAYSIA: MARKET, BY END-USER INDUSTRY, 2021–2028 (USD MILLION)
- TABLE 48 INDONESIA: MARKET, BY END-USER INDUSTRY, 2021–2028 (USD MILLION)
- TABLE 49 REST OF ASIA PACIFIC: MARKET, BY END-USER INDUSTRY, 2021–2028 (USD MILLION)
- TABLE 50 NORTH AMERICA: PRESSURE VESSELS MARKET, BY TYPE, 2021–2028 (USD MILLION)
- TABLE 51 NORTH AMERICA: MARKET, BY APPLICATION, 2021–2028 (USD MILLION)
- TABLE 52 NORTH AMERICA: MARKET, BY HEAT SOURCE, 2021–2028 (USD MILLION)
- TABLE 53 NORTH AMERICA: MARKET, BY END-USER INDUSTRY, 2021–2028 (USD MILLION)
- TABLE 54 NORTH AMERICA: MARKET, BY COUNTRY, 2021–2028 (USD MILLION)
- TABLE 55 US: PRESSURE VESSELS MARKET, BY END-USER INDUSTRY, 2021–2028 (USD MILLION)
- TABLE 56 CANADA: MARKET, BY END-USER INDUSTRY, 2021–2028 (USD MILLION)
- TABLE 57 MEXICO: MARKET, BY END-USER INDUSTRY, 2021–2028 (USD MILLION)
- TABLE 58 EUROPE: MARKET, BY TYPE, 2021–2028 (USD MILLION)
- TABLE 59 EUROPE: PRESSURE VESSELS MARKET, BY APPLICATION, 2021–2028 (USD MILLION)
- TABLE 60 EUROPE: MARKET, BY HEAT SOURCE, 2021–2028 (USD MILLION)
- TABLE 61 EUROPE: MARKET SIZE, BY END-USER INDUSTRY, 2021–2028 (USD MILLION)
- TABLE 62 EUROPE: MARKET, BY COUNTRY, 2021–2028 (USD MILLION)
- TABLE 63 GERMANY: MARKET, BY END-USER INDUSTRY, 2021–2028 (USD MILLION)
- TABLE 64 UK: MARKET, BY END-USER INDUSTRY, 2021–2028 (USD MILLION)
- TABLE 65 FRANCE: MARKET, BY END-USER INDUSTRY, 2021–2028 (USD MILLION)
- TABLE 66 RUSSIA: MARKET, BY END-USER INDUSTRY, 2021–2028 (USD MILLION)
- TABLE 67 REST OF EUROPE: MARKET, BY END-USER INDUSTRY, 2021–2028 (USD MILLION)
- TABLE 68 MIDDLE EAST & AFRICA: PRESSURE VESSELS MARKET, BY TYPE, 2021–2028 (USD MILLION)
- TABLE 69 MIDDLE EAST & AFRICA: MARKET, BY APPLICATION, 2021–2028 (USD MILLION)
- TABLE 70 MIDDLE EAST & AFRICA: MARKET, BY HEAT SOURCE, 2021–2028 (USD MILLION)
- TABLE 71 MIDDLE EAST & AFRICA: MARKET, BY END-USER INDUSTRY, 2021–2028 (USD MILLION)
- TABLE 72 MIDDLE EAST & AFRICA: MARKET, BY COUNTRY, 2021–2028 (USD MILLION)
- TABLE 73 SAUDI ARABIA: MARKET, BY END-USER INDUSTRY, 2021–2028 (USD MILLION)
- TABLE 74 UAE: MARKET, BY END-USER INDUSTRY, 2021–2028 (USD MILLION)
- TABLE 75 SOUTH AFRICA: MARKET, BY END-USER INDUSTRY, 2021–2028 (USD MILLION)
- TABLE 76 ALGERIA: MARKET, BY END-USER INDUSTRY, 2021–2028 (USD MILLION)
- TABLE 77 NIGERIA: MARKET, BY END-USER INDUSTRY, 2021–2028 (USD MILLION)
- TABLE 78 REST OF MIDDLE EAST & AFRICA: MARKET, BY END-USER INDUSTRY, 2021–2028 (USD MILLION)
- TABLE 79 SOUTH AMERICA: PRESSURE VESSELS MARKET, BY TYPE, 2021–2028 (USD MILLION)
- TABLE 80 SOUTH AMERICA: MARKET, BY APPLICATION, 2021–2028 (USD MILLION)
- TABLE 81 SOUTH AMERICA: MARKET, BY HEAT SOURCE, 2021–2028 (USD MILLION)
- TABLE 82 SOUTH AMERICA: MARKET, BY END-USER INDUSTRY, 2021–2028 (USD MILLION)
- TABLE 83 SOUTH AMERICA: MARKET, BY COUNTRY, 2021–2028 (USD MILLION)
- TABLE 84 BRAZIL: MARKET, BY END-USER INDUSTRY, 2021–2028 (USD MILLION)
- TABLE 85 ARGENTINA: MARKET, BY END-USER INDUSTRY, 2021–2028 (USD MILLION)
- TABLE 86 REST OF SOUTH AMERICA: MARKET, BY END-USER INDUSTRY, 2021–2028 (USD MILLION)
- TABLE 87 OVERVIEW OF KEY STRATEGIES ADOPTED BY TOP PLAYERS, 2019–2023
- TABLE 88 PRESSURE VESSELS MARKET: DEGREE OF COMPETITION
- TABLE 89 MARKET: DETAILED LIST OF KEY START-UPS/SMES
- TABLE 90 MARKET, BY TYPE: COMPETITIVE BENCHMARKING OF KEY START-UPS/SMES
- TABLE 91 MARKET, BY APPLICATION: COMPETITIVE BENCHMARKING OF KEY START-UPS/SMES
- TABLE 92 MARKET, BY END-USER INDUSTRY: COMPETITIVE BENCHMARKING OF KEY START-UPS/SMES
- TABLE 93 MARKET, BY REGION: COMPETITIVE BENCHMARKING OF KEY START-UPS/SMES
- TABLE 94 TYPE: COMPANY FOOTPRINT
- TABLE 95 END-USER INDUSTRY: COMPANY FOOTPRINT
- TABLE 96 APPLICATION: COMPANY FOOTPRINT
- TABLE 97 REGION: COMPANY FOOTPRINT
- TABLE 98 COMPANY FOOTPRINT
- TABLE 99 MARKET: DEALS, JANUARY 2019–APRIL 2023
- TABLE 100 MARKET: OTHERS, JANUARY 2019–APRIL 2023
- TABLE 101 BHARAT HEAVY ELECTRICALS LIMITED: BUSINESS OVERVIEW
- TABLE 102 BHARAT HEAVY ELECTRICALS LIMITED: PRODUCTS/SERVICES OFFERED
- TABLE 103 BHARAT HEAVY ELECTRICALS LIMITED: DEALS
- TABLE 104 BHARAT HEAVY ELECTRICALS LIMITED: OTHERS
- TABLE 105 MITSUBISHI HITACHI POWER SYSTEMS: BUSINESS OVERVIEW
- TABLE 106 MITSUBISHI HITACHI POWER SYSTEMS: PRODUCTS/SERVICES OFFERED
- TABLE 107 MITSUBISHI HITACHI POWER SYSTEMS: OTHERS
- TABLE 108 IHI CORPORATION: BUSINESS OVERVIEW
- TABLE 109 IHI CORPORATION: PRODUCTS/SERVICES OFFERED
- TABLE 110 IHI CORPORATION: DEALS
- TABLE 111 LARSEN & TOUBRO LIMITED: BUSINESS OVERVIEW
- TABLE 112 LARSEN & TOUBRO LIMITED: PRODUCTS/SERVICES OFFERED
- TABLE 113 LARSEN & TOUBRO LIMITED: DEALS
- TABLE 114 LARSEN & TOUBRO LIMITED: OTHERS
- TABLE 115 BUMHAN MECATEC: COMPANY OVERVIEW
- TABLE 116 BUMHAN MECATEC: PRODUCTS/SERVICES OFFERED
- TABLE 117 BUMHAN MECATEC: DEALS
- TABLE 118 GENERAL ELECTRIC: COMPANY OVERVIEW
- TABLE 119 GENERAL ELECTRIC: PRODUCTS/SERVICES OFFERED
- TABLE 120 GENERAL ELECTRIC: DEALS
- TABLE 121 GENERAL ELECTRIC: OTHERS
- TABLE 122 BABCOCK & WILCOX ENTERPRISES: BUSINESS OVERVIEW
- TABLE 123 BABCOCK & WILCOX ENTERPRISES: PRODUCTS/SERVICES OFFERED
- TABLE 124 BABCOCK & WILCOX ENTERPRISES: DEALS
- TABLE 125 BABCOCK & WILCOX ENTERPRISES: OTHERS
- TABLE 126 HITACHI ZOSEN CORPORATION: COMPANY OVERVIEW
- TABLE 127 HITACHI ZOSEN CORPORATION: PRODUCTS/SERVICES OFFERED
- TABLE 128 HITACHI ZOSEN CORPORATION: OTHERS
- TABLE 129 DONGFANG TURBINE CO., LTD.: COMPANY OVERVIEW
- TABLE 130 DONGFANG TURBINE CO., LTD.: PRODUCTS/SERVICES OFFERED
- TABLE 131 SAMUEL, SON & CO.: COMPANY OVERVIEW
- TABLE 132 SAMUEL, SON & CO.: PRODUCTS/SERVICES OFFERED
- TABLE 133 SAMUEL, SON & CO.: DEALS
- TABLE 134 WESTINGHOUSE ELECTRIC COMPANY: COMPANY OVERVIEW
- TABLE 135 WESTINGHOUSE ELECTRIC COMPANY: PRODUCTS/SERVICES OFFERED
- TABLE 136 WESTINGHOUSE ELECTRIC COMPANY: DEALS
- TABLE 137 HALVORSEN COMPANY: COMPANY OVERVIEW
- TABLE 138 HALVORSEN COMPANY: PRODUCTS/SERVICES OFFERED
- TABLE 139 PRESSURE VESSELS (INDIA): COMPANY OVERVIEW
- TABLE 140 PRESSURE VESSELS (INDIA): PRODUCTS/SERVICES OFFERED
- TABLE 141 KELVION HOLDING GMBH: COMPANY OVERVIEW
- TABLE 142 KELVION HOLDING GMBH: PRODUCTS/SERVICES OFFERED
- TABLE 143 KELVION HOLDING GMBH: DEALS
- TABLE 144 KELVION HOLDING GMBH: OTHERS
- TABLE 145 VIFLOW: BUSINESS OVERVIEW
- TABLE 146 VIFLOW: PRODUCTS/SERVICES OFFERED
- FIGURE 1 PRESSURE VESSELS MARKET: RESEARCH DESIGN
- FIGURE 2 DATA TRIANGULATION METHODOLOGY
- FIGURE 3 MAIN METRICS CONSIDERED TO ANALYZE AND ASSESS PRESSURE VESSEL DEMAND
- FIGURE 4 MARKET SIZE ESTIMATION METHODOLOGY: BOTTOM-UP APPROACH
- FIGURE 5 MARKET SIZE ESTIMATION METHODOLOGY: TOP-DOWN APPROACH
- FIGURE 6 KEY STEPS CONSIDERED TO ASSESS PRESSURE VESSEL SUPPLY
- FIGURE 7 MARKET: SUPPLY-SIDE ANALYSIS
- FIGURE 8 COMPANY MARKET SHARE ANALYSIS, 2022
- FIGURE 9 ASIA PACIFIC ACCOUNTED FOR LARGEST SHARE OF MARKET IN 2022
- FIGURE 10 BOILERS TO HOLD LARGEST SHARE OF MARKET, BY TYPE, THROUGHOUT FORECAST PERIOD
- FIGURE 11 PROCESSING VESSELS TO LEAD MARKET, BY APPLICATION, DURING FORECAST PERIOD
- FIGURE 12 FIRED PRESSURE VESSELS TO CAPTURE LARGER SHARE OF MARKET, BY HEAT SOURCE, THROUGHOUT FORECAST PERIOD
- FIGURE 13 POWER INDUSTRY TO HOLD LARGEST SHARE OF MARKET DURING FORECAST PERIOD
- FIGURE 14 GROWING CHEMICAL PRODUCTION AND TECHNOLOGICAL ADVANCEMENTS AND MATERIAL INNOVATIONS WORLDWIDE TO ACCELERATE MARKET GROWTH
- FIGURE 15 POWER INDUSTRY AND CHINA HELD LARGEST SHARES OF MARKET IN ASIA PACIFIC IN 2022
- FIGURE 16 BOILERS TO DOMINATE MARKET IN 2028
- FIGURE 17 PROCESSING VESSELS TO LEAD MARKET IN 2028
- FIGURE 18 FIRED PRESSURE VESSELS TO COMMAND MARKET IN 2028
- FIGURE 19 POWER INDUSTRY TO BE LARGEST STAKEHOLDER OF MARKET IN 2028
- FIGURE 20 PRESSURE VESSELS MARKET: DRIVERS, RESTRAINTS, OPPORTUNITIES, AND CHALLENGES
- FIGURE 21 GLOBAL CHEMICAL PRODUCTION SALES, 2015 TO 2021
- FIGURE 22 OIL DEMAND TREND, BY REGION, 2019 TO 2026
- FIGURE 23 GLOBAL NOMINAL PRICES FOR ALUMINUM AND COPPER, 2019–2022 (USD/MT)
- FIGURE 24 REVENUE SHIFTS FOR PRESSURE VESSEL MANUFACTURERS
- FIGURE 25 MARKET MAP/ECOSYSTEM ANALYSIS
- FIGURE 26 PRESSURE VESSELS MARKET: VALUE CHAIN ANALYSIS
- FIGURE 27 AVERAGE SELLING PRICE OF PRESSURE VESSELS, BY TYPE
- FIGURE 28 PRICING ANALYSIS, BY REGION, 2021 VS. 2028 (USD)
- FIGURE 29 PRESSURE VESSELS MARKET: PORTER’S FIVE FORCES ANALYSIS
- FIGURE 30 INFLUENCE OF STAKEHOLDERS ON BUYING PROCESS, BY END-USER INDUSTRY
- FIGURE 31 KEY BUYING CRITERIA FOR END-USER INDUSTRIES
- FIGURE 32 MARKET, BY APPLICATION, 2022
- FIGURE 33 MARKET, BY HEAT SOURCE, 2022
- FIGURE 34 MARKET, BY TYPE, 2022
- FIGURE 35 MARKET, BY END-USER INDUSTRY, 2022
- FIGURE 36 PRESSURE VESSELS MARKET IN ASIA PACIFIC TO GROW AT HIGHEST CAGR DURING FORECAST PERIOD
- FIGURE 37 ASIA PACIFIC: MARKET OVERVIEW
- FIGURE 38 NORTH AMERICA: MARKET SNAPSHOT
- FIGURE 39 MARKET SHARE ANALYSIS OF TOP 5 PLAYERS OFFERING PRESSURE VESSELS
- FIGURE 40 TOP PLAYERS IN MARKET FROM 2018 TO 2022
- FIGURE 41 MARKET (GLOBAL) COMPANY EVALUATION MATRIX, 2022
- FIGURE 42 MARKET: START-UPS/SMES EVALUATION QUADRANT, 2021
- FIGURE 43 BHARAT HEAVY ELECTRICALS LIMITED: COMPANY SNAPSHOT
- FIGURE 44 MITSUBISHI HITACHI POWER SYSTEMS: COMPANY SNAPSHOT
- FIGURE 45 IHI CORPORATION: COMPANY SNAPSHOT
- FIGURE 46 LARSEN & TOUBRO LIMITED: COMPANY SNAPSHOT
- FIGURE 47 GENERAL ELECTRIC: COMPANY SNAPSHOT
- FIGURE 48 BABCOCK & WILCOX ENTERPRISES: COMPANY SNAPSHOT
- FIGURE 49 HITACHI ZOSEN CORPORATION: COMPANY SNAPSHOT
The study involved major activities in estimating the current size of the pressure vessels market. Exhaustive secondary research was done to collect information on the peer and parent markets. The next step was to validate these findings, assumptions, and sizing with industry experts across the value chain through primary research. Both top-down and bottom-up approaches were employed to estimate the complete market size. Thereafter, market breakdown and data triangulation were used to estimate the market size of the segments and subsegments.
Secondary Research
This research study on the pressure vessel market involved the use of extensive secondary sources, directories, and databases, such as Hoovers, Bloomberg, Businessweek, Factiva, International Energy Agency, and BP Statistical Review of World Energy, to identify and collect information useful for a technical, market-oriented, and commercial study of the market. The other secondary sources included annual reports, press releases & investor presentations of companies, white papers, certified publications, articles by recognized authors, manufacturer associations, trade directories, and databases.
Primary Research
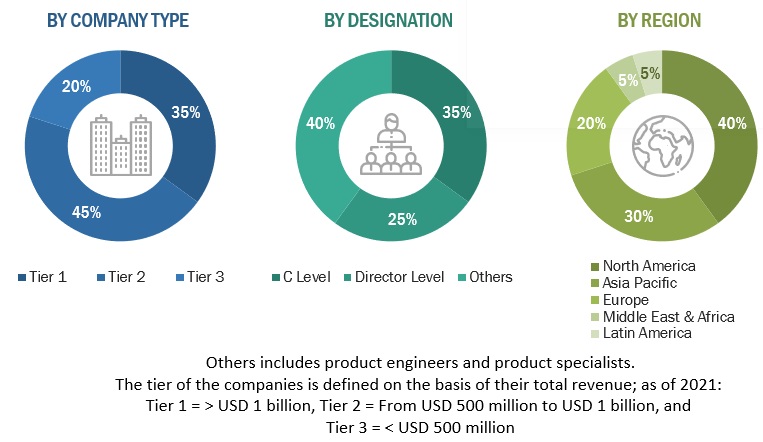
The pressure vessel market comprises several stakeholders such as pressure vessels manufacturers, manufacturing technology providers, and technical support providers in the supply chain. The demand side of this market is characterized by the rising demand for pressure vessels in, power, chemicals, and food & beverages applications. The supply side is characterized by rising demand for contracts from the industrial sector, and mergers & acquisitions among big players. Various primary sources from both the supply and demand sides of the market were interviewed to obtain qualitative and quantitative information. Following is the breakdown of primary respondents:
To know about the assumptions considered for the study, download the pdf brochure
Market Size Estimation
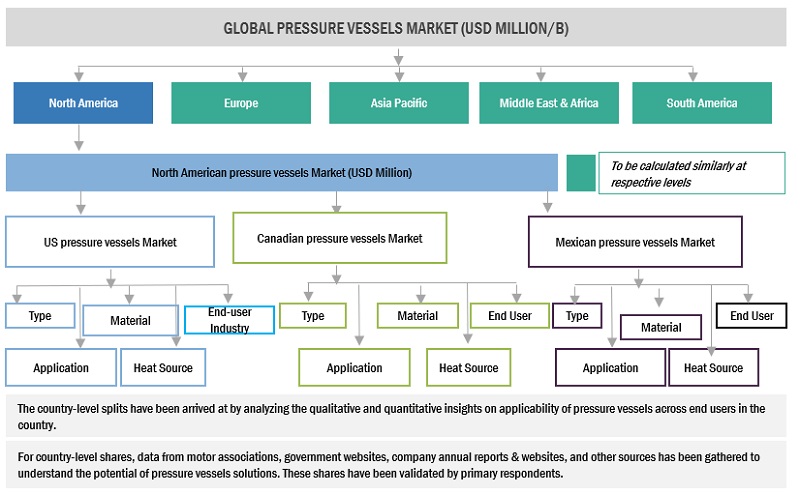
Both top-down and bottom-up approaches were used to estimate and validate the total size of the pressure vessel market. These methods were also used extensively to estimate the size of various subsegments in the market. The research methodology used to estimate the market size includes the following:
- The key players in the industry and market have been identified through extensive secondary research, and their market share in the respective regions have been determined through both primary and secondary research.
- The industry’s value chain and market size, in terms of value, have been determined through primary and secondary research processes.
- All percentage shares, splits, and breakdowns have been determined using secondary sources and verified through primary sources.
Pressure Vessels Market Size: Top-Down Approach
Data Triangulation
After arriving at the overall market size from the estimation process explained above, the total market has been split into several segments and subsegments. To complete the overall market engineering process and arrive at the exact statistics for all the segments and subsegments, the data triangulation and market breakdown processes have been employed, wherever applicable. The data has been triangulated by studying various factors and trends from both the demand- and supply sides. Along with this, the market has been validated using both the top-down and bottom-up approaches.
Market Definition
A pressure vessel is a container designed to hold gases or liquids at a pressure significantly different from the ambient pressure. The pressure within the vessel may be higher or lower than the atmospheric pressure outside the vessel. Pressure vessels are used in a variety of industrial and commercial applications, including chemical processing, oil and gas production, power generation, and manufacturing. They can be made from various materials, including metals, plastics, and composites, and are typically designed to meet specific safety standards and regulations to ensure that they can withstand the pressure and stress they are subjected to during operation.
The growth of the pressure vessel market during the forecast period can be attributed to the planned rollout of energy efficiency programs across major countries in North America, South Americsssa, Europe, Asia Pacific, and the Middle East & Africa.
Key Stakeholders
- Process tank manufacturers
- Pressure vessel manufacturers
- Oil and gas companies
- Manufacturing firms
- Power generation companies
- R&D laboratories
- Power generation companies
- Government and research organizations
- Distributors
- Inspection associations
Objectives of the Study
- To define, describe, and forecast the market, by type, heat source, application, end-user industries, and region, in terms of value
- To describe and forecast the global pressure vessel market for various segments with respect to five main regions: North America, Europe, Asia Pacific, South America, and the Middle East & Africa (MEA), in terms of volume and value
- To provide detailed information regarding the drivers, restraints, opportunities, and challenges influencing market growth
- To provide a detailed overview of the pressure vessels value chain, along with industry trends, use cases, security standards, and Porter’s five forces
- To strategically analyze micromarkets1 with respect to individual growth trends, prospects, and contributions to the total market
- To analyze opportunities in the market for various stakeholders by identifying high-growth segments in the market
- To strategically profile key players and comprehensively analyze their market position in terms of ranking and core competencies2, along with detailing the competitive landscape of the market
- To analyze growth strategies adopted by market players such as collaborations, partnerships, mergers and acquisitions, contracts, and agreements in the market
Available Customizations:
With the given market data, MarketsandMarkets offers customizations according to the specific requirements of companies. The following customization options are available for the report:
Product Analysis
- Product Matrix, which provides a detailed comparison of the product portfolio of each company
Company Information
- Detailed analyses and profiling of additional market players


 Generating Response ...


Growth opportunities and latent adjacency in Pressure Vessels Market