Remote Towers Market by Operation Type (Single, Multiple, Contingency), System Type (Airport Equipment, Remote Tower Modules, Solutions & Software), Application (Communication, Information & Control, Surveillance) and Region - Global Forecast to 2027
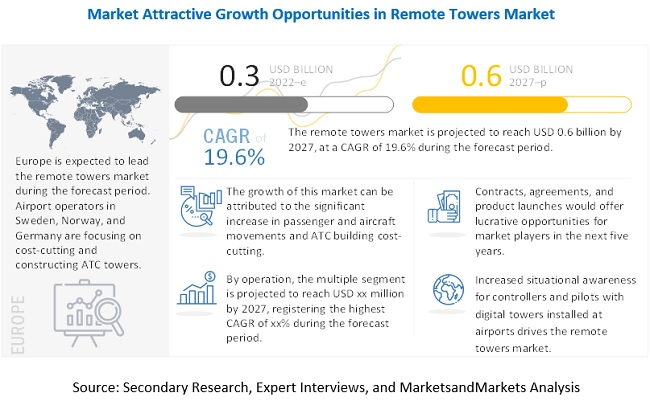
The global Remote Towers Market is projected to grow from USD 0.3 Billion in 2022 to USD 0.6 Billion by 2027, at a CAGR of 19.6% from 2022 to 2027.
Remote tower is a innovative concept where the air traffic service (ATS) at an airport is performed somewhere other than in the local control tower. Although it was originally developed for airports with low traffic levels, in 2021 it was implemented at a major international airports in London, Norway and few other places. Also, this report dicusses the digital tower concept. To capture the increasing demand for integration of a wide range of ATM systems and data in support of advanced air traffic operations, the digital towers concept was launched.
This market report covers various applications and systems related to remote towers that are used in commercial and military airports. Remote towers are evolving rapidly in terms of technology, with the development of new, advanced, and high-speed cameras, remote modules, and communication systems. Increased cost saving, efficiency, and safety fuel the demand for Remote Towers Industry.
Saab (Sweden), Thales Group (France), Frequentis Group (Austria), Indra Sistemas (Spain), and L3Harris Technologies (US) are some of the leading players operating in the remote towers market. A general overview of these companies, an analysis of their financials, products, and services, and the key developments undertaken by them are covered in this report.
To know about the assumptions considered for the study, Request for Free Sample Report
COVID-19 impact on the Remote Towers Market
The COVID pandemic has had and will linger to have for some time a devastating impact on air traffic, which indirectly would hit the remote towers market negatively. Airports of all sizes have been impacted, but smaller and regional airports are predominantly vulnerable. Due to COVID-19 crisis, the research & development (R&D) in numerous remote towers system has been hindered due to the declared lockdowns and government restrictions on public gatherings. Due to COVID-19 crisis worldwide, the major airports have been non-operational, which has deferred ongoing upgradation of airports with multiple remote tower systems. Maintaining production has become a challenge for every category of remote tower manufacturers as businesses and supply chains observed temporary shutdowns or disruption due to the financial losses sustained owing to strict lockdowns, closures of international borders, and a fall in import and export activities. Start-ups faced a financial crunch as these factors discouraged investor funding. The financial impact of COVID-19 on airlines and the aviation supply chain pushed many businesses and organizations to execute cost cutting measures. Most of these measures consist of reduction in staff, whether in the form of staff furlough or early retirements. In addition to this having a negative impact on staff morale, it has changed the working environment for crews, ATCOs, and dispatchers in the aviation sector.
Remote Towers Market Dynamics:
Driver: Increased cost savings
Remote towers can operate both, a single airport as well as multiple airports simultaneously from a remote location. This leads to cost savings in civil infrastructure and ATM systems. Small- and medium-sized airports that have low traffic operate in loss due to heavy ATC tower costs that cannot be balanced out with the volume of air traffic. Multiple such airports can be controlled from one location through remote towers simultaneously as well as sequentially based on a schedule. The cost of having independent towers at such airports is far too high as compared to installing a high-end camera system that relays the video footage to a remote tower for ATC operations. The first tower in Norway to be run through the remote tower technology was rolled out in 2019, while three more towers are being implemented by Avinor AS in partnership with SESAR 2020 programme in 2020. The remote towers technology will be rolled out at a total of 15 airports in Norway by the end of 2022, which will be run from the centre in Bodø. This is expected to be significantly cheaper than installing independent towers at each of these airports. The remote towers will cater to this increasing passenger traffic at a cost that will be significantly less than upgrading and developing traditional air traffic control towers. The need to reduce the ATM costs is expected to spur the demand for remote towers.
Opportunity: Digitalization in air traffic management
The aviation industry is undergoing a digital transformation. Digital MRO, autonomous aircraft and drones, and digital airport technologies, among others, are driving the industry toward digitalization. Remote towers are at the forefront of airport digitalization. They replace human OTW view with digital equipment that functions using highly automated systems. Besides the digital displays, the aeronautical data received by remote towers and the automated algorithms creating terrain mapping as well as anti-collision mapping for the controllers are digital. For instance, ENAIRE (Spain) aims in development of its Digital Control Tower project, Along with Indra Sistemas (Spain)as the technological partner,in a project that goes well beyond the mere remote provision of Tower Control Traffic Services. This advanced solution integrates the current ATS surveillance data, Air Traffic Control and Communications systems with a panoramic visualization system furnished with innovative information and alert functionalities, based on the application of Augmented Reality and Artificial Intelligence. This progress of “remote concept” to a new “digital concept” is based on the objective to expand the human and ATMS system cooperation, moving from the “visual” concept of operations of the exiting Towers to a new concept of operations based on the amalgamation of a new digitalized visual together with ATM system information.
Challenge: Rise in cyber threats to air traffic management
The use of Information and Communications Technology (ICT) in remote towers systems to create a network between the airport and CWPs could expose the ATC operations to cyber hacking. Digitalization of such complex instrumentation has introduced considerable issues related to cybersecurity. Traditional ATC towers work in an isolated environment, which is protected against cyber threats. However, remote towers and their components are connected to the internet or a network, thus making them vulnerable to hacking. Due to this interface and interdependence inherent to ICT, the threat to remote towers has increased.
The most direct threat to ATM systems is posed by non-state actors, including terrorists, hacktivists, and cybercriminals. The major impact of such threats can involve information theft, general disruption in aviation, and potential loss of life. Some of the recent instances of cyberattacks on the ATM system include the December 2014 coordinated attack by Iranian hackers against computer systems of over 16 countries, including attacks on systems of Pakistan, South Korea, Saudi Arabia, and the US. In June 2015, a cyberattack on the network of Polskie Linie Lotnicze (Polish National Airline) grounded ten flights to Poland, Germany, and Denmark, and caused delays for another ten by compromising the system that creates flight plans.
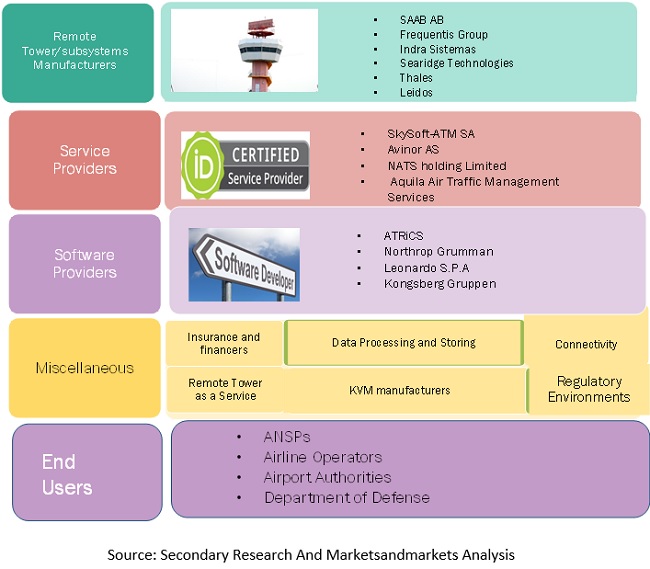
Market Ecosystem Map
The key stakeholders in the Remote Towers Market ecosystem are Airport Developers, Software Developers, Research Bodies, Governmental Bodies, Remote Tower Systems Manufacturers, Government Agencies, Regulators and Investors and Financial Community Professionals
Market ecosystem map: remote towers market
“By operation type, the multiple segment is projected to grow at the highest CAGR during the forecast period”
By operation type, the multiple segment is projected to grow at the highest CAGR during the forecast period. SESAR 2020 and PJ.05, an innovative programme for researching the future of air traffic management in Europe, plans to further develop the Multiple Remote Tower Concept and an efficient Remote Tower Centre.Also, in the simultaneous configuration, the module and CWP enable Air traffic Service (ATS) to operate for two or more airports at the same time. In order to operate airport safely and to save build cost, equipment and manpower, major airport operators and Ain Navigation Service together are working towards connecting various small airport with low traffic and making centralized to manage.
“Based on investment, the expansion & modernization segment is projected to lead the remote towers market during the forecast period”
Based on investment, the expansion & modernization segment is projected to lead the remote towers market during the forecast period. Various European and American airports, including London City Airport (UK), Heathrow Airport (UK), Saarbrücken (Germany), Erfurt (Germany), and Dresden (Germany) are operating through expansion and modernization programs. The key priority of airport operators and air navigation service providers is to centralize 2-3 airports with low and medium air traffic with remote towers infrastructure.
“By application, the communication segment is estimated to lead the market during the forecast period”
Communication segment would lead based on application, because it is a crucial component for air traffic management. Communication between air traffic controllers and aircraft is in the form of voice and text. Remote towers are equipped with specific systems that process and display communication data. These systems collect and relay communications between control working positions (CWPs) and the aircraft.
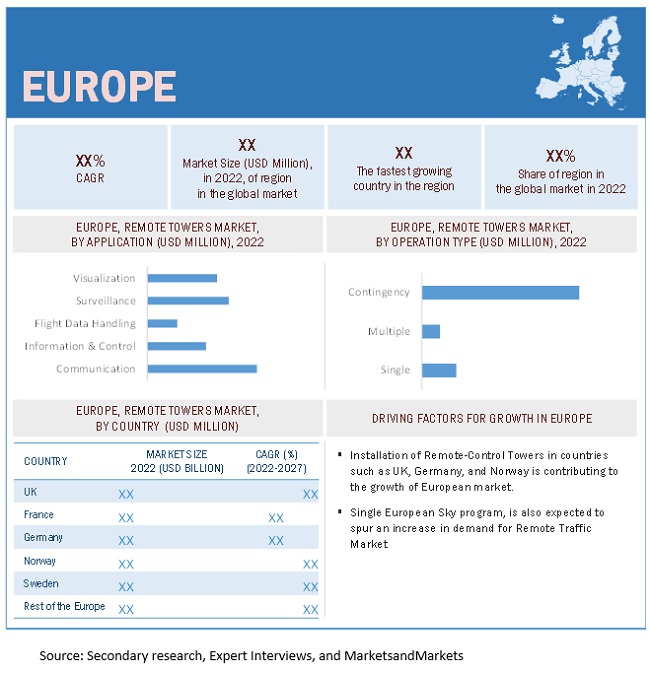
“Europe to lead the remote tower market in 2022”
Europe to lead the remote tower market in 2022, with the UK, and Sweden accounting for the significant share of the regional market. The growing demand for remote towers in the European rgion with yhe development of new and technologically advanced remote towers component such as high resolution cameras, and panaromic display and communication systems are the key factors driving the market in Europe.
Europe is Projected to have the Highest Market Share for Remote Towers Market in 2021
To know about the assumptions considered for the study, download the pdf brochure
Key players operating
The Remote Towers Companies are dominated by a few globally established players such as Saab (Sweden), Thales Group (France), Frequentis Group (Austria), Indra Sistemas (Spain), and L3Harris Technologies (US).
Get online access to the report on the World's First Market Intelligence Cloud
- Easy to Download Historical Data & Forecast Numbers
- Company Analysis Dashboard for high growth potential opportunities
- Research Analyst Access for customization & queries
- Competitor Analysis with Interactive dashboard
- Latest News, Updates & Trend analysis
Request Sample Scope of the Report
Get online access to the report on the World's First Market Intelligence Cloud
- Easy to Download Historical Data & Forecast Numbers
- Company Analysis Dashboard for high growth potential opportunities
- Research Analyst Access for customization & queries
- Competitor Analysis with Interactive dashboard
- Latest News, Updates & Trend analysis
Report Metric |
Details |
Market size available for years |
2017-2027 |
Base year considered |
2021 |
Forecast period |
2022-2027 |
Forecast units |
Value (USD) |
Segments covered |
by end user, operation type, system type, application, investment and regions |
Geographies covered |
North America, Asia Pacific, Europe, RoW (Rest of the World) |
Companies covered |
Saab (Sweden), Thales Group (France), Frequentis Group (Austria), Indra Sistemas (Spain), and L3Harris Technologies (US) are among others. |
This research report categorizes the remote towers market based on end user, operation type, system type, application, investment and regions.
Remote Tower Market , By Operation Type
- Single / Sequential
- Multiple/ Simultaneous
- Contigency
- Supplementary Remote Tower
Remote Tower Market , By System Type
-
Airport Equipment
- Cameras (180/360/Pan).
- Display
- Vhf/Uhf Radios
- Nav Aids
- Met Sensors
-
Remote Tower Module
- Heads-Up Display (Hud)
- Heads-Down-Display (Hdd)
-
Solutions & Software
- Wide Area Network (Wan)
- High Speed Ip Network
Remote Tower Market , By Application
- Communication
- Information & Control
- Flight Data Handling
- Surveillance
- Visualization
Remote Tower Market , By End User
- Military Airport
-
Commercial Airport
- Class A (>20 Million)
- Class B (10-20 Milion)
- Class C (1-10million)
- Class D (<1 Million)
Remote Tower Market , By Investment
- New Construction
- Expansion & Modernization
Remote Tower Market , By Region
- North America
- Europe
- Asia Pacific
- Rest of the World
Recent Developments
- In November 2021, China Southern signed a purchase agreement with Thales Group for their selection of the NXT-800 Automatic Dependent Surveillance – Broadcast (ADS-B) Transponder from ACSS, an L3Harris Technologies and Thales company, during the fourth China International Import Expo (CIIE).
- In October 2021, The Korean Airport Corporation (KAC) has conferred Indra Sistemas (Spain) a contract for the supply and installation of Indra Sistemas’s Normarc Instrument Landing Systems (ILS) and Distance Measuring Equipment (DME) with a total value of roughly USD 7 million.
- In January 2021, Frequentis Group (Austria) acquired parts of the ATM product segment from L3Harris Technologies (US)
Frequently Asked Questions (FAQ):
What is the current size of the remote towers market?
The global remote towers market is projected to grow from USD 259 million in 2022 to USD 644 million by 2027, at a CAGR of 20.0% from 2022 to 2027. Asia Pacific is expected to be the fastest-growing market, anticipated to register a CAGR of 29.30% during the forecast period.
Who are the winners in the remote towers market?
Key players operating in remote towers market are Saab (Sweden), Thales Group (France), Frequentis Group (Austria), Indra Sistemas (Spain), and L3Harris Technologies (US).
What is the COVID-19 impact on remote towers market?
The COVID pandemic has had and will linger to have for some time a devastating impact on air traffic, which indirectly would hit the remote towers market negatively. Airports of all sizes have been impacted, but smaller and regional airports are predominantly vulnerable. Due to COVID-19 crisis, the research & development (R&D) in numerous remote towers system has been hindered due to the declared lockdowns and government restrictions on public gatherings. Due to COVID-19 crisis worldwide, the major airports have been non-operational, which has deferred ongoing upgradation of airports with multiple remote tower systems. Production rate of many remote tower components such as several equipment, remote tower modules or KVM products are down due to COVID-19, which has negatively affected global remote towers market. Business development possibility of multiple remote tower firms has been severely affected due to the overall shortage in demand of remote tower systems due to COVID-19 pandemic.
What are some of the technological advancements in the market?
Due to increased air traffic, airports face various challenges by way of increased ground movements and surface traffic across runways, aprons, and taxiways. As part of Advanced Surface Movement Guidance and Control Systems (A-SMGCS) activities, new generation automation systems have been included in simulations to demonstrate how various tools can operate together to provide integrated airport safety nets. The introduction of electronic flight strips in remote control towers provides a link between instructions given by a controller which are available electronically and can be integrated with other data, such as flight plan, surveillance, routing, and published rules and procedures. The integration of this data enables the system to monitor the information and alert the controller when inconsistencies are detected. Electronic strips can be customized to implement the workflow of any remote tower. It easily integrates with other ATM systems, airport systems, and surveillance systems.
What are the factors driving the growth of the market?
Government initiatives such as NextGen (US), SES Europe (Single European Sky), and OneSKY (Australia), among others, are driving the growth of the ATM industry. These initiatives have laid the foundation for remote towers. Remote towers can contribute to the growth and create opportunities for modernization initiatives as well as the installation of new equipment in upcoming greenfield projects. A significant chunk of ATM growth can be attributed to remote towers that are being proposed in countries such as Norway, Germany, the UK, Sweden, the US, and India, among others. Europe is working on the installation of remote towers. According to International Airport Review, Norway has already started working towards implementing remote towers for 15 airports by end 2022. In 2019 The Royal Norwegian Air Force and Avinor AS started a partnership for testing the Remote Towers solution for military usage in Norway. .
To speak to our analyst for a discussion on the above findings, click Speak to Analyst
TABLE OF CONTENTS
1 INTRODUCTION (Page No. - 29)
1.1 OBJECTIVES OF THE STUDY
1.2 MARKET DEFINITION
1.2.1 INCLUSIONS & EXCLUSIONS
1.3 MARKET SCOPE
1.3.1 REMOTE TOWERS MARKET SEGMENTATION
1.3.2 REGIONAL SCOPE
1.3.3 YEARS CONSIDERED FOR THE STUDY
1.4 CURRENCY & PRICING
1.5 USD EXCHANGE RATES
1.6 LIMITATIONS
1.7 LIMITATIONS
1.8 MARKET STAKEHOLDERS
1.9 SUMMARY OF CHANGES
2 RESEARCH METHODOLOGY (Page No. - 35)
2.1 RESEARCH DATA
FIGURE 1 RESEARCH PROCESS FLOW
FIGURE 2 RESEARCH DESIGN
2.1.1 SECONDARY DATA
2.1.2 PRIMARY DATA
2.1.2.1 Key data from primary sources
2.1.2.2 Key primary sources
2.1.3 PRIMARY DATA
2.1.3.1 Breakdown of primaries
2.1.4 DEMAND-SIDE INDICATORS
2.1.5 SUPPLY-SIDE ANALYSIS
2.2 MARKET SIZE ESTIMATION
2.2.1 MARKET DEFINITION & SCOPE
2.2.2 EXCLUSIONS
2.2.3 SEGMENTS AND SUBSEGMENTS
2.2.4 BOTTOM-UP APPROACH
2.2.4.1 Regional remote towers market
2.2.4.2 Remote towers market, by operation type
2.2.5 TOP-DOWN APPROACH
2.2.5.1 Remote towers market, by application
2.3 MARKET BREAKDOWN AND DATA TRIANGULATION
FIGURE 3 DATA TRIANGULATION METHODOLOGY
2.3.1 TRIANGULATION THROUGH PRIMARY AND SECONDARY RESEARCH
2.4 GROWTH RATE ASSUMPTIONS
2.5 ASSUMPTIONS FOR THE RESEARCH STUDY
2.6 RISKS
3 EXECUTIVE SUMMARY (Page No. - 44)
FIGURE 4 BY OPERATION TYPE, MULTIPLE SEGMENT IN EUROPE PROJECTED TO REGISTER HIGHEST CAGR DURING FORECAST PERIOD
FIGURE 5 BY INVESTMENT, EXPANSION & MODERNIZATION SEGMENT PROJECTED TO LEAD MARKET DURING FORECAST PERIOD
FIGURE 6 BY APPLICATION, COMMUNICATION SEGMENT ESTIMATED TO LEAD MARKET DURING FORECAST PERIOD
FIGURE 7 EUROPE ESTIMATED TO ACCOUNT FOR LARGEST MARKET SHARE IN 2022
4 PREMIUM INSIGHTS (Page No. - 47)
4.1 ATTRACTIVE GROWTH OPPORTUNITIES IN REMOTE TOWERS MARKET
FIGURE 8 INCREASED COST-SAVING AND EFFICIENCY & SAFETY DRIVE MARKET GROWTH
4.2 REMOTE TOWERS MARKET, BY APPLICATION
FIGURE 9 BY APPLICATION, COMMUNICATION SEGMENT PROJECTED TO LEAD MARKET DURING FORECAST PERIOD
4.3 REMOTE TOWERS MARKET, BY SYSTEM TYPE
FIGURE 10 BY SYSTEM TYPE, REMOTE TOWER MODULE SEGMENT PROJECTED TO LEAD MARKET DURING FORECAST PERIOD
4.4 REMOTE TOWERS MARKET, BY OPERATION TYPE
FIGURE 11 BY OPERATION TYPE, CONTINGENCY SEGMENT PROJECTED TO LEAD MARKET DURING FORECAST PERIOD
4.5 REMOTE TOWERS MARKET, BY END USER
FIGURE 12 MILITARY AIRPORT SEGMENT PROJECTED TO WITNESS UPWARD TREND DURING FORECAST PERIOD
4.6 REMOTE TOWERS MARKET, BY COUNTRY
FIGURE 13 CHINA PROJECTED TO BE FASTEST-GROWING MARKET FROM 2022 TO 2027
5 MARKET OVERVIEW (Page No. - 50)
5.1 INTRODUCTION
5.2 MARKET DYNAMICS
FIGURE 14 MARKET DYNAMICS IN REMOTE TOWERS MARKET
5.2.1 DRIVERS
5.2.1.1 Increased cost savings
5.2.1.2 Enhanced efficiency and safety
5.2.1.3 Growth in air passenger traffic fueling demand for new airlines
FIGURE 15 NEW AIRPORT INVESTMENT, BY REGION, AS OF OCTOBER 2021
5.2.1.4 Growing investments across aviation industry
TABLE 1 ANSP INVESTMENTS FOR REMOTE TOWER PROJECTS WORLDWIDE, 2010-2020
5.2.1.5 Improved situational awareness with digital towers for military sector
5.2.2 RESTRAINTS
5.2.2.1 Limited network infrastructure
5.2.2.2 Capacity issues of big airports
5.2.3 OPPORTUNITIES
5.2.3.1 Modernization of current air traffic management infrastructure
5.2.3.2 Growth of overall air traffic management industry
5.2.3.3 Digitalization in air traffic management
5.2.4 CHALLENGES
5.2.4.1 Rise in cyber threats to air traffic management
5.2.4.2 Risks associated with automation and need for extensive training & familiarity with new remote towers
5.3 COVID-19 IMPACT ON REMOTE TOWERS MARKET
FIGURE 16 COVID-19 IMPACT ON REMOTE TOWERS MARKET
FIGURE 17 COVID-19 IMPACT ON SUPPLY AND DEMAND SIDES OF REMOTE TOWERS MARKET
5.3.1 RANGES AND SCENARIOS
FIGURE 18 DEPENDING ON HOW UNCERTAINTIES UNFOLD, SPECTRUM OF SCENARIOS FOR REMOTE TOWERS MARKET
5.4 SUPPLY CHAIN ANALYSIS OF REMOTE TOWERS MARKET
FIGURE 19 SUPPLY CHAIN ANALYSIS
5.5 REMOTE TOWERS MARKET ECOSYSTEM
FIGURE 20 MARKET ECOSYSTEM MAP: REMOTE TOWERS MARKET
5.6 TRENDS/DISRUPTIONS IMPACTING CUSTOMER BUSINESS
5.6.1 REVENUE SHIFT AND NEW REVENUE POCKETS FOR REMOTE TOWERS MARKET PLAYERS
5.7 AVERAGE SELLING PRICES OF REMOTE TOWERS AND RELATED PRODUCTS, 2021-2022
TABLE 2 REMOTE TOWERS MARKET: AVERAGE SELLING PRICES, 2021-2022
5.8 PORTER’S FIVE FORCES ANALYSIS
TABLE 3 REMOTE TOWERS MARKET: PORTER’S FIVE FORCES ANALYSIS
5.8.1 THREAT OF NEW ENTRANTS
5.8.2 THREAT OF SUBSTITUTES
5.8.3 BARGAINING POWER OF SUPPLIERS
5.8.4 BARGAINING POWER OF BUYERS
5.8.5 DEGREE OF COMPETITION
5.9 TARIFF AND REGULATORY LANDSCAPE
5.9.1 AIR TRAFFIC CONTROL (ATC) CHARGES
5.9.1.1 Safety, Efficiency, & Transparency
5.9.1.2 International Campaigns
5.9.1.3 Exception Still Exists:
5.9.2 REGULATORY LANDSCAPE FOR DEPLOYMENT OF REMOTE AND DIGITAL TOWER TECHNOLOGY
FIGURE 21 REGULATORY ENVIRONMENT FOR REMOTE VIRTUAL TOWER
5.10 EVENTS AND CONFERENCES IN 2022-2023
TABLE 4 LIST OF UPCOMING REMOTE TOWER OR AIR TRAFFIC MANAGEMENT EVENTS AND CONFERENCES, 2022-2023
6 INDUSTRY TRENDS (Page No. - 70)
6.1 INTRODUCTION
6.2 TECHNOLOGY TRENDS
6.2.1 5G NETWORK
6.2.2 DIGITALIZATION
6.2.3 ARTIFICIAL INTELLIGENCE, MACHINE LEARNING, AND QUANTUM COMPUTING
6.2.4 STANDARD TERMINAL AUTOMATION REPLACEMENT SYSTEM (STARS)
6.2.5 AIRPORT SAFETY NETS
6.3 TECHNOLOGY ANALYSIS
6.3.1 ADS-B STREAMLINING SURVEILLANCE TECHNOLOGIES
6.3.2 AI INNOVATIONS PROVIDE CUTTING-EDGE SOLUTIONS IN AIR TRAFFIC CONTROL
6.3.3 AUTOMATION IN ATC
6.4 USE CASES
6.4.1 AIR TRAFFIC CONTROL THE NETHERLANDS (LVNL)’S AIR TRAFFIC CONTROL INITIATIVE FOR REGIONAL AIRPORTS
6.4.2 JERSEY AIRPORT’S DIGITAL AIR TRAFFIC CONTROL TOWER
6.4.3 SEARIDGE TECHNOLOGIES’ ENHANCED AIRPORT VISION DISPLAY (EAVD)
6.4.4 ISAVIA AND FREQUENTIS GROUP PARTNERSHIP
6.4.5 CRANFIELD UNIVERSITY AND SAAB PARTNERSHIP
6.5 IMPACT OF MEGATRENDS
6.5.1 INTERNET OF THINGS (IOT)
TABLE 5 IOT INFRASTRUCTURE FOR REMOTE TOWERS & ATM
6.5.2 ENHANCED SITUATIONAL AWARENESS
6.6 INNOVATIONS & PATENT REGISTRATIONS
TABLE 6 INNOVATIONS & PATENT REGISTRATIONS, 2012-2020
7 REMOTE TOWERS MARKET, BY OPERATION TYPE (Page No. - 80)
7.1 INTRODUCTION
FIGURE 22 REMOTE TOWERS MARKET SIZE, BY OPERATION TYPE, 2022–2027 (USD MILLION)
TABLE 7 REMOTE TOWERS MARKET SIZE, BY OPERATION TYPE, 2018–2021 (USD MILLION)
TABLE 8 REMOTE TOWERS MARKET SIZE, BY OPERATION TYPE, 2022–2027 (USD MILLION)
7.2 SINGLE
7.2.1 MEDIUM-SIZE AIRPORTS REQUIRE DEDICATED SINGLE REMOTE TOWERS
7.3 MULTIPLE
7.3.1 LARGE AND MEDIUM-SIZED AIRPORTS REQUIRE SIMULTANEOUSLY OR SEQUENTIALLY CONTROLLING REMOTE TOWERS
7.4 CONTINGENCY
7.4.1 EMERGENCY AND BACKUP REMOTE TOWERS
7.5 SUPPLEMENTARY REMOTE TOWER
7.5.1 PROVIDES EXTRA VIEW FOR NEW RUNWAYS
8 REMOTE TOWERS MARKET, BY SYSTEM TYPE (Page No. - 84)
8.1 INTRODUCTION
FIGURE 23 REMOTE TOWERS MARKET SIZE, BY SYSTEM TYPE, 2022–2027 (USD MILLION)
TABLE 9 REMOTE TOWERS MARKET SIZE, BY SYSTEM TYPE, 2018–2021 (USD MILLION)
TABLE 10 REMOTE TOWERS MARKET SIZE, BY SYSTEM TYPE, 2022–2027 (USD MILLION)
8.2 AIRPORT EQUIPMENT
8.2.1 HELPS GAIN REAL-TIME AIRPORT VIEW AT REMOTE LOCATION
8.2.2 CAMERAS (180/360/PAN)
8.2.3 DISPLAY
8.2.4 VHF/UHF RADIOS
8.2.5 NAVAIDS
8.2.6 MET SENSORS
8.3 REMOTE TOWER MODULE
8.3.1 INCLUDES CONTROL WORKING POSITION AND VISUAL SYSTEMS
8.3.2 HEADS-UP DISPLAY (HUD)
8.3.3 HEADS-DOWN-DISPLAY (HDD)
8.4 SOLUTION & SOFTWARE
8.4.1 WIDE AREA NETWORK TO CONNECT REMOTE TOWER MODULES WITH AIRPORT EQUIPMENT
8.4.2 WIDE AREA NETWORK (WAN)
8.4.2.1 WAN provides a connection between the airport and remote virtual tower to share communication
8.4.3 HIGH-SPEED IP NETWORK
8.4.3.1 High-speed IP network could be utilized in several fruitful live trials, delivering essential voice
8.4.4 DATA GATHERING AND ALERT SYSTEMS
8.4.4.1 Capturing & sensing surroundings, collecting data, and alerting control towers
8.4.5 INTERFACING AND INTEGRATION
8.4.5.1 Integration of individual systems with each other
8.4.6 PLATFORM AND SUITS
8.4.6.1 Present operational overview interactively
9 REMOTE TOWERS MARKET, BY APPLICATION (Page No. - 90)
9.1 INTRODUCTION
FIGURE 24 REMOTE TOWERS MARKET SIZE, BY APPLICATION, 2022-2027 (USD MILLION)
TABLE 11 REMOTE TOWERS MARKET SIZE, BY APPLICATION, 2018–2021 (USD MILLION)
TABLE 12 REMOTE TOWERS MARKET SIZE, BY APPLICATION, 2022–2027 (USD MILLION)
9.2 COMMUNICATION
9.2.1 CONNECTS AIR TRAFFIC AND GROUND-BASED SYSTEMS
9.3 INFORMATION & CONTROL
9.3.1 DATA PROCESSING AND PROVIDING OUTPUT FOR DECISION MAKING
9.4 FLIGHT DATA HANDLING
9.4.1 FLIGHT DATA INPUT TO CONTROLLERS AT CWPA
9.5 SURVEILLANCE
9.5.1 RADARS AND TRANSPONDERS AID WITH DATA FOR SURVEILLANCE
9.6 VISUALIZATION
9.6.1 DISPLAY SYSTEMS ARE INTEGRAL PART OF REMOTE TOWER SETUP
10 REMOTE TOWERS MARKET, BY END USER (Page No. - 94)
10.1 INTRODUCTION
FIGURE 25 REMOTE TOWERS MARKET SIZE, BY END USER, 2022-2027 (USD MILLION)
TABLE 13 REMOTE TOWERS MARKET SIZE, BY END USER, 2018–2021 (USD MILLION)
TABLE 14 REMOTE TOWERS MARKET SIZE, BY END USER, 2022–2027 (USD MILLION)
10.2 MILITARY AIRPORT
10.3 COMMERCIAL AIRPORT
10.3.1 CLASS A (>20 MILLION)
10.3.2 CLASS B (10-20 MILLION)
10.3.3 CLASS C (1-10 MILLION)
10.3.4 CLASS D (<1 MILLION)
11 REMOTE TOWERS MARKET, BY INVESTMENT (Page No. - 98)
11.1 INTRODUCTION
FIGURE 26 REMOTE TOWERS MARKET SIZE, BY INVESTMENT, 2022-2027 (USD MILLION)
TABLE 15 REMOTE TOWERS MARKET SIZE, BY INVESTMENT, 2018–2021 (USD MILLION)
TABLE 16 REMOTE TOWERS MARKET SIZE, BY INVESTMENT, 2022–2027 (USD MILLION)
11.2 NEW INSTALLATION
11.2.1 GROWTH OF PASSENGER AND CARGO TRAFFIC DRIVES NEW INSTALLATION PROJECTS
11.3 EXPANSION & MODERNIZATION
11.3.1 ARRAY OF ECONOMIC, SOCIAL, AND ENVIRONMENTAL PROFITS ASSOCIATED WITH EXPANSION & MODERNIZATION REDEVELOPMENT PROJECTS TO BOOST MARKET
12 REGIONAL ANALYSIS (Page No. - 102)
12.1 INTRODUCTION
FIGURE 27 REMOTE TOWERS MARKET: REGIONAL SNAPSHOT, 2021
TABLE 17 GLOBAL REMOTE TOWERS MARKET, BY REGION, 2018–2021 (USD MILLION)
TABLE 18 GLOBAL REMOTE TOWERS MARKET, BY REGION, 2022–2027 (USD MILLION)
12.2 NORTH AMERICA
FIGURE 28 NORTH AMERICA: REMOTE TOWERS MARKET SNAPSHOT
12.2.1 PESTLE ANALYSIS: NORTH AMERICA
TABLE 19 NORTH AMERICA: REMOTE TOWERS MARKET, BY OPERATION TYPE, 2018–2021 (USD MILLION)
TABLE 20 NORTH AMERICA: REMOTE TOWERS MARKET, BY OPERATION TYPE, 2022–2027 (USD MILLION)
TABLE 21 NORTH AMERICA: REMOTE TOWERS MARKET, BY APPLICATION, 2018–2021 (USD MILLION)
TABLE 22 NORTH AMERICA: REMOTE TOWERS MARKET, BY APPLICATION, 2022–2027 (USD MILLION)
TABLE 23 NORTH AMERICA: REMOTE TOWERS MARKET, BY SYSTEM TYPE, 2018–2021 (USD MILLION)
TABLE 24 NORTH AMERICA: REMOTE TOWERS MARKET, BY SYSTEM TYPE, 2022–2027 (USD MILLION)
TABLE 25 NORTH AMERICA: REMOTE TOWERS MARKET, BY COUNTRY, 2018–2021 (USD MILLION)
TABLE 26 NORTH AMERICA: REMOTE TOWERS MARKET, BY COUNTRY, 2022–2027 (USD MILLION)
12.2.2 US
12.2.2.1 NextGen program for modernization of existing atm systems drives market
TABLE 27 US: REMOTE TOWERS MARKET, BY APPLICATION, 2018–2021 (USD MILLION)
TABLE 28 US: REMOTE TOWERS MARKET, BY APPLICATION, 2022–2027 (USD MILLION)
TABLE 29 US: REMOTE TOWERS MARKET, BY SYSTEM TYPE, 2018–2021 (USD MILLION)
TABLE 30 US: REMOTE TOWERS MARKET, BY SYSTEM TYPE, 2022–2027 (USD MILLION)
12.2.3 CANADA
12.2.3.1 New airport projects drive demand for remote towers
TABLE 31 CANADA: REMOTE TOWERS MARKET, BY APPLICATION, 2018–2021 (USD MILLION)
TABLE 32 CANADA: REMOTE TOWERS MARKET, BY APPLICATION, 2022–2027 (USD MILLION)
TABLE 33 CANADA: REMOTE TOWERS MARKET, BY SYSTEM TYPE, 2018–2021 (USD MILLION)
TABLE 34 CANADA: REMOTE TOWERS MARKET, BY SYSTEM TYPE, 2022–2027 (USD MILLION)
12.3 EUROPE
12.3.1 PESTLE ANALYSIS: EUROPE
FIGURE 29 EUROPE: REMOTE TOWERS MARKET SNAPSHOT, 2022
TABLE 35 EUROPE: REMOTE TOWERS MARKET, BY OPERATION TYPE, 2018–2021 (USD MILLION)
TABLE 36 EUROPE: REMOTE TOWERS MARKET, BY OPERATION TYPE, 2022–2027 (USD MILLION)
TABLE 37 EUROPE: REMOTE TOWERS MARKET, BY APPLICATION, 2018–2021 (USD MILLION)
TABLE 38 EUROPE :REMOTE TOWERS MARKET, BY APPLICATION, 2022–2027 (USD MILLION)
TABLE 39 EUROPE: REMOTE TOWERS MARKET, BY SYSTEM TYPE, 2018–2021 (USD MILLION)
TABLE 40 EUROPE: REMOTE TOWERS MARKET, BY SYSTEM TYPE, 2022–2027 (USD MILLION)
TABLE 41 EUROPE: REMOTE TOWERS MARKET, BY COUNTRY, 2018–2021 (USD MILLION)
TABLE 42 EUROPE: REMOTE TOWERS MARKET, BY COUNTRY, 2022–2027 (USD MILLION)
12.3.2 UK
12.3.2.1 Airport modernization efforts boost market for digital towers
TABLE 43 UK: REMOTE TOWERS MARKET, BY APPLICATION, 2018–2021 (USD MILLION)
TABLE 44 UK: REMOTE TOWERS MARKET, BY APPLICATION, 2022–2027 (USD MILLION)
TABLE 45 UK: REMOTE TOWERS MARKET, BY SYSTEM TYPE, 2018–2021 (USD MILLION)
TABLE 46 UK: REMOTE TOWERS MARKET, BY SYSTEM TYPE, 2022–2027 (USD MILLION)
12.3.3 FRANCE
12.3.3.1 Presence of key remote tower system suppliers boosts market
TABLE 47 FRANCE: REMOTE TOWERS MARKET, BY APPLICATION, 2018–2021 (USD MILLION)
TABLE 48 FRANCE :REMOTE TOWERS MARKET, BY APPLICATION, 2022–2027 (USD MILLION)
TABLE 49 FRANCE: REMOTE TOWERS MARKET, BY SYSTEM TYPE, 2018–2021 (USD MILLION)
TABLE 50 FRANCE: REMOTE TOWERS MARKET, BY SYSTEM TYPE, 2022–2027 (USD MILLION)
12.3.4 NORWAY
12.3.4.1 Demand driven by high demand for regional connectivity
TABLE 51 NORWAY: REMOTE TOWERS MARKET, BY APPLICATION, 2018–2021 (USD MILLION)
TABLE 52 NORWAY :REMOTE TOWERS MARKET, BY APPLICATION, 2022–2027 (USD MILLION)
TABLE 53 NORWAY: REMOTE TOWERS MARKET, BY SYSTEM TYPE, 2018–2021 (USD MILLION)
TABLE 54 NORWAY: REMOTE TOWERS MARKET, BY SYSTEM TYPE, 2022–2027 (USD MILLION)
12.3.5 GERMANY
12.3.5.1 Extensive R&D work under SESAR 2020 project to boost market
TABLE 55 GERMANY: REMOTE TOWERS MARKET, BY APPLICATION, 2018–2021 (USD MILLION)
TABLE 56 GERMANY: REMOTE TOWERS MARKET, BY APPLICATION, 2022–2027 (USD MILLION)
TABLE 57 GERMANY: REMOTE TOWERS MARKET, BY SYSTEM TYPE, 2018–2021 (USD MILLION)
TABLE 58 GERMANY: REMOTE TOWERS MARKET, BY SYSTEM TYPE, 2022–2027 (USD MILLION)
12.3.6 SWEDEN
12.3.6.1 Continuous efforts of LFV to provide sound ATC drives market
TABLE 59 SWEDEN: REMOTE TOWERS MARKET, BY APPLICATION, 2018–2021 (USD MILLION)
TABLE 60 SWEDEN: REMOTE TOWERS MARKET, BY APPLICATION, 2022–2027 (USD MILLION)
TABLE 61 SWEDEN: REMOTE TOWERS MARKET, BY SYSTEM TYPE, 2018–2021 (USD MILLION)
TABLE 62 SWEDEN: REMOTE TOWERS MARKET, BY SYSTEM TYPE, 2022–2027 (USD MILLION)
12.3.7 REST OF EUROPE
12.3.7.1 Market driven by new remote tower projects
TABLE 63 REST OF EUROPE: REMOTE TOWERS MARKET, BY APPLICATION, 2018–2021 (USD MILLION)
TABLE 64 REST OF EUROPE: REMOTE TOWERS MARKET, BY APPLICATION, 2022–2027 (USD MILLION)
TABLE 65 REST OF EUROPE: REMOTE TOWERS MARKET, BY SYSTEM TYPE, 2018–2021 (USD MILLION)
TABLE 66 REST OF EUROPE: REMOTE TOWERS MARKET, BY SYSTEM TYPE, 2022–2027 (USD MILLION)
12.4 ASIA PACIFIC
FIGURE 30 ASIA PACIFIC: REMOTE TOWERS MARKET SNAPSHOT
12.4.1 PESTLE ANALYSIS: ASIA PACIFIC
TABLE 67 ASIA PACIFIC: REMOTE TOWERS MARKET, BY OPERATION TYPE, 2018–2021 (USD MILLION)
TABLE 68 ASIA PACIFIC: REMOTE TOWERS MARKET, BY OPERATION TYPE, 2022–2027 (USD MILLION)
TABLE 69 ASIA PACIFIC: REMOTE TOWERS MARKET, BY APPLICATION, 2018–2021 (USD MILLION)
TABLE 70 ASIA PACIFIC :REMOTE TOWERS MARKET, BY APPLICATION, 2022–2027 (USD MILLION)
TABLE 71 ASIA PACIFIC: REMOTE TOWERS MARKET, BY SYSTEM TYPE, 2018–2021 (USD MILLION)
TABLE 72 ASIA PACIFIC: REMOTE TOWERS MARKET, BY SYSTEM TYPE, 2022–2027 (USD MILLION)
12.4.2 BY COUNTRY
TABLE 73 ASIA PACIFIC: REMOTE TOWERS MARKET, BY COUNTRY, 2018–2021 (USD MILLION)
TABLE 74 ASIA PACIFIC: REMOTE TOWERS MARKET, BY COUNTRY, 2022–2027 (USD MILLION)
12.4.3 CHINA
12.4.3.1 Upcoming greenfield airport projects expected to propel market growth
TABLE 75 CHINA: REMOTE TOWERS MARKET, BY APPLICATION, 2018–2021 (USD MILLION)
TABLE 76 CHINA: REMOTE TOWERS MARKET, BY APPLICATION, 2022–2027 (USD MILLION)
TABLE 77 CHINA: REMOTE TOWERS MARKET, BY SYSTEM TYPE, 2018–2021 (USD MILLION)
TABLE 78 CHINA: REMOTE TOWERS MARKET, BY SYSTEM TYPE, 2022–2027 (USD MILLION)
12.4.4 INDIA
12.4.4.1 Market driver - Government focus on increasing regional connectivity
TABLE 79 INDIA: REMOTE TOWERS MARKET, BY APPLICATION, 2018–2021 (USD MILLION)
TABLE 80 INDIA :REMOTE TOWERS MARKET, BY APPLICATION, 2022–2027 (USD MILLION)
TABLE 81 INDIA: REMOTE TOWERS MARKET, BY SYSTEM TYPE, 2018–2021 (USD MILLION)
TABLE 82 INDIA: REMOTE TOWERS MARKET, BY SYSTEM TYPE, 2022–2027 (USD MILLION)
12.4.5 AUSTRALIA
12.4.5.1 Airport modernization projects drive market
TABLE 83 AUSTRALIA: REMOTE TOWERS MARKET, BY APPLICATION, 2018–2021 (USD MILLION)
TABLE 84 AUSTRALIA: REMOTE TOWERS MARKET, BY APPLICATION, 2022–2027 (USD MILLION)
TABLE 85 AUSTRALIA: REMOTE TOWERS MARKET, BY SYSTEM TYPE, 2018–2021 (USD MILLION)
TABLE 86 AUSTRALIA: REMOTE TOWERS MARKET, BY SYSTEM TYPE, 2022–2027 (USD MILLION)
12.4.6 REST OF ASIA PACIFIC
12.4.6.1 Loss-making regional airports to replace conventional ATC with RT
TABLE 87 REST OF ASIA PACIFIC: REMOTE TOWERS MARKET, BY APPLICATION, 2018–2021 (USD MILLION)
TABLE 88 REST OF ASIA PACIFIC: REMOTE TOWERS MARKET, BY APPLICATION, 2022–2027 (USD MILLION)
TABLE 89 REST OF ASIA PACIFIC: REMOTE TOWERS MARKET, BY SYSTEM TYPE, 2018–2021 (USD MILLION)
TABLE 90 REST OF ASIA PACIFIC: REMOTE TOWERS MARKET, BY SYSTEM TYPE, 2022–2027 (USD MILLION)
12.5 REST OF THE WORLD (ROW)
12.5.1 PESTLE ANALYSIS: REST OF THE WORLD
TABLE 91 REST OF THE WORLD: REMOTE TOWERS MARKET, BY OPERATION TYPE, 2018–2021 (USD MILLION)
TABLE 92 REST OF THE WORLD: REMOTE TOWERS MARKET, BY OPERATION TYPE, 2022–2027 (USD MILLION)
TABLE 93 REST OF THE WORLD: REMOTE TOWERS MARKET, BY APPLICATION, 2018–2021 (USD MILLION)
TABLE 94 REST OF THE WORLD: REMOTE TOWERS MARKET, BY APPLICATION, 2022–2027 (USD MILLION)
TABLE 95 REST OF THE WORLD: REMOTE TOWERS MARKET, BY SYSTEM TYPE, 2018–2021 (USD MILLION)
TABLE 96 REST OF THE WORLD: REMOTE TOWERS MARKET, BY SYSTEM TYPE, 2022–2027 (USD MILLION)
TABLE 97 REST OF THE WORLD: REMOTE TOWERS MARKET, BY REGION, 2018–2021 (USD MILLION)
TABLE 98 REST OF THE WORLD: REMOTE TOWERS MARKET, BY REGION, 2022–2027 (USD MILLION)
12.5.2 MIDDLE EAST
12.5.2.1 Increasing tourism drives demand to manage increased air traffic and airport modernization
TABLE 99 MIDDLE EAST: REMOTE TOWERS MARKET, BY APPLICATION, 2018–2021 (USD MILLION)
TABLE 100 MIDDLE EAST :REMOTE TOWERS MARKET, BY APPLICATION, 2022–2027 (USD MILLION)
TABLE 101 MIDDLE EAST: REMOTE TOWERS MARKET, BY SYSTEM TYPE, 2018–2021 (USD MILLION)
TABLE 102 MIDDLE EAST: REMOTE TOWERS MARKET, BY SYSTEM TYPE, 2022–2027 (USD MILLION)
12.5.3 LATIN AMERICA
12.5.3.1 Modernization of airports and tourism traffic boost market
TABLE 103 LATIN AMERICA: REMOTE TOWERS MARKET, BY APPLICATION, 2018–2021 (USD MILLION)
TABLE 104 LATIN AMERICA: REMOTE TOWERS MARKET, BY APPLICATION, 2022–2027 (USD MILLION)
TABLE 105 LATIN AMERICA: REMOTE TOWERS MARKET, BY SYSTEM TYPE, 2018–2021 (USD MILLION)
TABLE 106 LATIN AMERICA: REMOTE TOWERS MARKET, BY SYSTEM TYPE, 2022–2027 (USD MILLION)
12.5.4 AFRICA
12.5.4.1 Investments in new airport projects drive market
TABLE 107 AFRICA: REMOTE TOWERS MARKET, BY APPLICATION, 2018–2021 (USD MILLION)
TABLE 108 AFRICA: REMOTE TOWERS MARKET, BY APPLICATION, 2022–2027 (USD MILLION)
TABLE 109 AFRICA: REMOTE TOWERS MARKET, BY SYSTEM TYPE, 2018–2021 (USD MILLION)
TABLE 110 AFRICA: REMOTE TOWERS MARKET, BY SYSTEM TYPE, 2022–2027 (USD MILLION)
13 COMPETITIVE LANDSCAPE (Page No. - 145)
13.1 INTRODUCTION
13.2 KEY PLAYERS IN REMOTE TOWERS MARKET
FIGURE 31 RANKING OF KEY PLAYERS IN REMOTE TOWERS MARKET, 2021
13.3 RANKING OF LEADING PLAYERS IN REMOTE TOWERS MARKET, 2021
FIGURE 32 REVENUE ANALYSIS OF KEY COMPANIES REMOTE TOWERS MARKET IN LAST 3 YEARS
13.4 MARKET SHARE ANALYSIS: REMOTE TOWERS MARKET, 2021
TABLE 111 REMOTE TOWERS MARKET: DEGREE OF COMPETITION
13.5 WINNING IMPERATIVES OF KEY PLAYERS IN REMOTE TOWERS MARKET
13.6 COMPETITIVE LEADERSHIP MAPPING
13.6.1 STAR
13.6.2 EMERGING LEADERS
13.6.3 PERVASIVE
13.6.4 PARTICIPANT COMPANIES
FIGURE 33 REMOTE TOWERS MARKET, COMPETITIVE LEADERSHIP MAPPING, 2021
13.7 REMOTE TOWERS MARKET, COMPETITIVE LEADERSHIP MAPPING (STARTUPS)
FIGURE 34 REMOTE TOWERS MARKET (STARTUPS), COMPETITIVE LEADERSHIP MAPPING, 2021
13.8 COMPETITIVE BENCHMARKING
TABLE 112 COMPANY PRODUCT FOOTPRINT
TABLE 113 COMPANY REGIONAL FOOTPRINT
TABLE 114 COMPANY PRODUCTS, SERVICES, CONTRACTS FOOTPRINT
TABLE 115 COMPANY APPLICATION FOOTPRINT
13.9 COMPETITIVE SCENARIO
13.9.1 NEW PRODUCT LAUNCHES/DEVELOPMENTS, 2018-2022
TABLE 116 NEW PRODUCT LAUNCHES/DEVELOPMENTS, 2018–2022
13.9.2 CONTRACTS, PARTNERSHIPS, AND AGREEMENTS, 2018-2022
TABLE 117 CONTRACTS, PARTNERSHIPS, AND AGREEMENTS, 2018–2022
13.9.3 COLLABORATIONS AND EXPANSIONS, 2018-2022
TABLE 118 COLLABORATIONS AND EXPANSIONS, 2018-2022
14 COMPANY PROFILES (Page No. - 168)
(Business Overview, Products Offered, Recent Developments, MnM View Right to win, Strategic choices made, Weaknesses and competitive threats) *
14.1 INTRODUCTION
14.2 KEY PLAYERS
14.2.1 SAAB AB
TABLE 119 SAAB: BUSINESS OVERVIEW
TABLE 120 SAAB: PRODUCT/SOLUTIONS/SERVICES OFFERED
TABLE 121 SAAB: DEALS
14.2.2 FREQUENTIS GROUP
TABLE 122 FREQUENTIS GROUP: BUSINESS OVERVIEW
FIGURE 36 FREQUENTIS GROUP: COMPANY SNAPSHOT
TABLE 123 FREQUENTIS GROUP: PRODUCT/SOLUTIONS/SERVICES OFFERED
TABLE 124 FREQUENTIS GROUP: DEALS
14.2.3 THALES GROUP
TABLE 125 THALES GROUP: BUSINESS OVERVIEW
FIGURE 37 THALES GROUP: COMPANY SNAPSHOT
TABLE 126 THALES GROUP: PRODUCT/SOLUTIONS/SERVICES OFFERED
TABLE 127 THALES GROUP: DEALS
14.2.4 INDRA SISTEMAS
TABLE 128 INDRA SISTEMAS: BUSINESS OVERVIEW
FIGURE 38 INDRA SISTEMAS: COMPANY SNAPSHOT
TABLE 129 INDRA SISTEMAS: PRODUCT/SOLUTIONS/SERVICES OFFERED
TABLE 130 INDRA SISTEMAS: DEALS
14.2.5 RAYTHEON TECHNOLOGIES CORPORATION
TABLE 131 RAYTHEON TECHNOLOGIES CORPORATION: BUSINESS OVERVIEW
FIGURE 39 RAYTHEON TECHNOLOGIES CORPORATION: COMPANY SNAPSHOT
TABLE 132 RAYTHEON TECHNOLOGIES CORPORATION: PRODUCT/SOLUTIONS/SERVICES OFFERED
TABLE 133 RAYTHEON TECHNOLOGIES CORPORATION: DEALS
14.2.6 L3HARRIS TECHNOLOGIES
TABLE 134 L3HARRIS TECHNOLOGIES: BUSINESS OVERVIEW
FIGURE 40 L3HARRIS TECHNOLOGIES: COMPANY SNAPSHOT
TABLE 135 L3HARRIS TECHNOLOGIES: PRODUCT/SOLUTIONS/SERVICES OFFERED
TABLE 136 L3HARRIS TECHNOLOGIES: DEALS
14.2.7 NORTHROP GRUMMAN CORPORATION (PARK AIR SYSTEMS LIMITED)
TABLE 137 NORTHROP GRUMMAN CORPORATION (PARK AIR SYSTEMS LIMITED): BUSINESS OVERVIEW
TABLE 138 NORTHROP GRUMMAN CORPORATION (PARK AIR SYSTEMS LIMITED): PRODUCT/SOLUTIONS/SERVICES OFFERED
TABLE 139 NORTHROP GRUMMAN CORPORATION (PARK AIR SYSTEMS LIMITED): DEALS
14.2.8 SEARIDGE TECHNOLOGIES
TABLE 140 SEARIDGE TECHNOLOGIES: BUSINESS OVERVIEW
TABLE 141 SEARIDGE TECHNOLOGIES: PRODUCT/SOLUTIONS/SERVICES OFFERED
TABLE 142 SEARIDGE TECHNOLOGIES: DEALS
14.2.9 LEONARDO S.P.A
TABLE 143 LEONARDO S.P.A: BUSINESS OVERVIEW
FIGURE 41 LEONARDO S.P.A: COMPANY SNAPSHOT
TABLE 144 LEONARDO S.P.A: PRODUCT/SOLUTIONS/SERVICES OFFERED
TABLE 145 LEONARDO S.P.A: PRODUCT LAUNCH
TABLE 146 LEONARDO S.P.A: DEALS
14.2.10 KONGSBERG GRUPPEN
TABLE 147 KONGSBERG GRUPPEN: BUSINESS OVERVIEW
FIGURE 42 KONGSBERG GRUPPEN: COMPANY SNAPSHOT
TABLE 148 KONGSBERG GRUPPEN: PRODUCT/SOLUTIONS/SERVICES OFFERED
TABLE 149 KONGSBERG GRUPPEN: DEALS
14.2.11 LEIDOS
TABLE 150 LEIDOS: BUSINESS OVERVIEW
FIGURE 43 LEIDOS: COMPANY SNAPSHOT
TABLE 151 LEIDOS: PRODUCT/SOLUTIONS/SERVICES OFFERED
TABLE 152 LEIDOS: PRODUCT LAUNCH
TABLE 153 LEIDOS: DEALS
14.2.12 RETIA A.S
TABLE 154 RETIA A.S: BUSINESS OVERVIEW
TABLE 155 RETIA A.S: PRODUCT/SOLUTIONS/SERVICES OFFERED
TABLE 156 RETIA A.S: DEALS
14.2.13 ROHDE & SCHWARZ GMBH & CO.
TABLE 157 ROHDE & SCHWARZ GMBH & CO.: BUSINESS OVERVIEW
TABLE 158 ROHDE & SCHWARZ GMBH & CO.: PRODUCT/SOLUTIONS/SERVICES OFFERED
TABLE 159 ROHDE & SCHWARZ GMBH & CO.: PRODUCT LAUNCH
TABLE 160 ROHDE & SCHWARZ GMBH & CO.: DEALS
TABLE 161 ROHDE & SCHWARZ GMBH & CO.: OTHERS
14.2.14 DFS DEUTSCHE FLUGSICHERUNG GMBH
TABLE 162 DFS DEUTSCHE FLUGSICHERUNG GMBH: BUSINESS OVERVIEW
TABLE 163 DFS DEUTSCHE FLUGSICHERUNG GMBH: PRODUCT/SOLUTIONS/SERVICES OFFERED
TABLE 164 DFS DEUTSCHE FLUGSICHERUNG GMBH: DEALS
TABLE 165 DFS DEUTSCHE FLUGSICHERUNG GMBH: OTHERS
14.2.15 BLACK BOX
TABLE 166 BLACK BOX: BUSINESS OVERVIEW
TABLE 167 BLACK BOX: PRODUCT/SOLUTIONS/SERVICES OFFERED
14.2.16 BECKER AVIONICS GMBH
TABLE 168 BECKER AVIONICS GMBH: BUSINESS OVERVIEW
TABLE 169 BECKER AVIONICS GMBH: PRODUCT/SOLUTIONS/SERVICES OFFERED
TABLE 170 BECKER AVIONICS GMBH: DEALS
14.2.17 CS GROUP
TABLE 171 CS GROUP: BUSINESS OVERVIEW
TABLE 172 CS GROUP: PRODUCT/SOLUTIONS/SERVICES OFFERED
14.2.18 ADACEL
TABLE 173 ADACEL.: BUSINESS OVERVIEW
FIGURE 44 ADACEL: COMPANY SNAPSHOT
TABLE 174 ADACEL: PRODUCT/SOLUTIONS/SERVICES OFFERED
TABLE 175 ADACEL: DEALS
14.2.19 EIZO CORP.
TABLE 176 EIZO CORP.: BUSINESS OVERVIEW
FIGURE 45 EIZO CORP. COMPANY SNAPSHOT
TABLE 177 EIZO CORP.: PRODUCT/SOLUTIONS/SERVICES OFFERED
TABLE 178 EIZO CORP.: PRODUCT LAUNCH
TABLE 179 EIZO: OTHERS
14.2.20 ERA
TABLE 180 ERA.: BUSINESS OVERVIEW
TABLE 181 ERA: PRODUCT/SOLUTIONS/SERVICES OFFERED
TABLE 182 ERA.: PRODUCT LAUNCH
TABLE 183 ERA: DEALS
14.2.21 INSERO AIR TRAFFIC SOLUTIONS
TABLE 184 INSERO AIR TRAFFIC SOLUTIONS: BUSINESS OVERVIEW
FIGURE 46 INSERO AIR TRAFFIC SOLUTIONS: COMPANY SNAPSHOT
TABLE 185 INSERO AIR TRAFFIC SOLUTIONS: PRODUCT/SOLUTIONS/SERVICES OFFERED
TABLE 186 INSERO AIR TRAFFIC SOLUTIONS: PRODUCT LAUNCH
TABLE 187 INSERO AIR TRAFFIC SOLUTIONS: DEALS
14.2.22 MOBILE ATC SYSTEMS LTD
TABLE 188 MOBILE ATC SYSTEMS LTD: BUSINESS OVERVIEW
TABLE 189 MOBILE ATC SYSTEMS LTD: PRODUCT/SOLUTIONS/SERVICES OFFERED
14.2.23 SKYSOFT-ATM
TABLE 190 SKYSOFT-ATM: BUSINESS OVERVIEW
TABLE 191 SKYSOFT-ATM: PRODUCT/SOLUTIONS/SERVICES OFFERED
TABLE 192 SKYSOFT-ATM: DEALS
14.2.24 IBROSS
TABLE 193 IBROSS: BUSINESS OVERVIEW
TABLE 194 IBROSS: PRODUCT/SOLUTIONS/SERVICES OFFERED
14.2.25 ADB SAFEGATE
TABLE 195 ADB SAFEGATE: BUSINESS OVERVIEW
TABLE 196 ADB SAFEGATE: PRODUCT/SOLUTIONS/SERVICES OFFERED
14.3 OTHER PLAYERS (SERVICES PROVIDERS AND SMES)
14.3.1 AVINOR AS
TABLE 197 AVINOR AS: COMPANY OVERVIEW
14.3.2 NATS HOLDING LIMITED
TABLE 198 NATS HOLDING LIMITED: COMPANY OVERVIEW
14.3.3 NÚCLEO-AMPER GROUP
TABLE 199 NÚCLEO-AMPER GROUP: COMPANY OVERVIEW
14.3.4 SYSTEMS INTERFACE
TABLE 200 SYSTEMS INTERFACE: COMPANY OVERVIEW
14.3.5 ACAMS AIRPORT TOWER SOLUTIONS
TABLE 201 ACAMS AIRPORT TOWER SOLUTIONS: COMPANY OVERVIEW
14.3.6 GUNTERMANN & DRUNCK
TABLE 202 GUNTERMANN & DRUNCK: COMPANY OVERVIEW
14.3.7 ALTYS TECHNOLOGIES
TABLE 203 ALTYS TECHNOLOGIES: COMPANY OVERVIEWS
14.3.8 SAIPHER ATC
TABLE 204 SAIPHER ATC: COMPANY OVERVIEWS
14.3.9 NAV CANADA
TABLE 205 NAV CANADA: COMPANY OVERVIEWS
14.3.10 AQUILA AIR TRAFFIC MANAGEMENT SERVICES
TABLE 206 AQUILA AIR TRAFFIC MANAGEMENT SERVICES: COMPANY OVERVIEWS
*Details on Business Overview, Products Offered, Recent Developments, MnM View, Right to win, Strategic choices made, Weaknesses and competitive threats might not be captured in case of unlisted companies.
15 APPENDIX (Page No. - 247)
15.1 DISCUSSION GUIDE
15.1.1 REMOTE TOWERS MARKET (2022–2027)
15.1.2 MARKET SEGMENTATION
15.2 KNOWLEDGE STORE: MARKETSANDMARKETS’ SUBSCRIPTION PORTAL
15.3 AVAILABLE CUSTOMIZATIONS
15.4 RELATED REPORTS
15.5 AUTHOR DETAILS
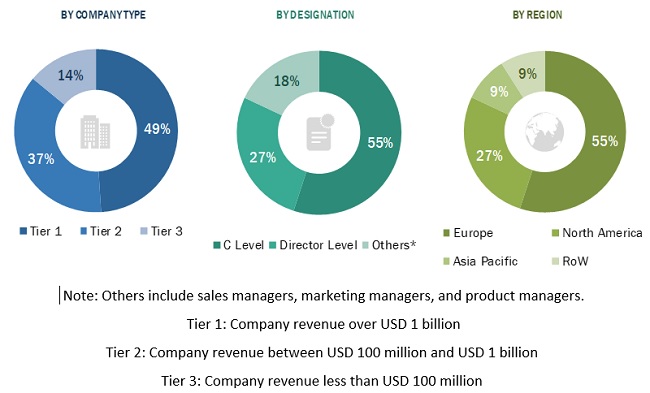
The research study conducted on the remote towers market involved the extensive use of secondary sources, directories, and databases, such as D&B Hoovers, Bloomberg Businessweek, and Factiva, to identify and collect information relevant to the market. Primary sources considered include industry experts from the market as well as suppliers, manufacturers, solution providers, technology developers, and organizations related to all segments of the value chain of the remote towers market. In-depth interviews of various primary respondents, including key industry participants, subject matter experts (SMEs), industry consultants, and C-level executives, were conducted to obtain and verify critical qualitative and quantitative information pertaining to the market as well as to assess the prospects.
Secondary Research
Secondary sources referred for this research study included financial statements of companies offering remote towers technology and information from various trade, business, and professional associations. The secondary data was collected and analyzed to arrive at the overall size of the remote towers market, which was validated by primary respondents.
To know about the assumptions considered for the study, download the pdf brochure
Market Size Estimation
- The top-down and bottom-up approaches were used to estimate and validate the size of the remote towers market. The research methodology used to estimate the market size also included the following details.
- The key players were identified through secondary research, and their market ranking was determined through primary and secondary research. This included a study of the annual and financial reports of the top market players and extensive interviews of leaders, including chief executive officers (CEO), directors, and marketing executives.
- All percentage shares, splits, and breakdowns were determined using secondary sources and verified through primary sources. All possible parameters that affect the markets covered in this research study were accounted for, viewed in extensive detail, verified through primary research, and analyzed to obtain the final quantitative and qualitative data. This data was consolidated, enhanced with detailed inputs, analyzed by representatives in MarketsandMarkets, and presented in this report.
bottom-up approach
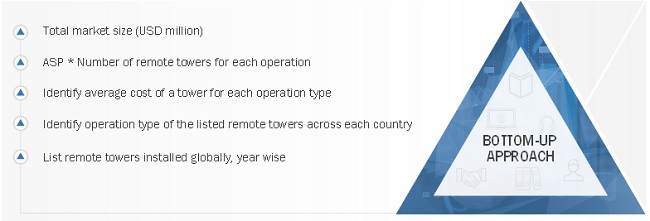
The bottom-up approach was employed to arrive at the overall size of the remote towers market. Airport investments (brownfield and greenfield), list of current airports, and network connectivity were considered to calculate the total number of possible remote towers in each country. For the cost of remote towers in each country, ASP was identified based on % of the average cost of an air traffic control tower for regional and large international airports. This data was segmented based on application and system type.
Regional remote towers market
- The bottom-up approach was used to arrive at the regional value of the remote towers market.
- The global market size was arrived at by totaling the market size of each country considered for the study.
- Factors such as airport investments, number of regional & international airports, and network connectivity of each country were evaluated against the current stage of remote towers technology development to arrive at the estimated number of remote towers in each country.
Remote towers market, by operation type
A country-level analysis was done for each operation type, namely, single, multiple, and contingency. Single and multiple operations of remote towers were considered for small regional airports with passenger footprints less than 1 million/year as of 2018. For contingency operations, large airports with passenger footprints more than 5 million/year as of 2018 were considered. The segmental market value for by operation types was arrived through the bottom-up approach.
To know about the assumptions considered for the study, Request for Free Sample Report
Data triangulation
After arriving at the overall size of the remote towers market from the market size estimation process explained above, the total market was split into several segments and subsegments.
Report Objectives
- To define, describe, segment, and forecast the size of the remote towers market based on operation type, application, end user, system type, investment, and region
- To analyze the degree of competition in the remote towers market by identifying key market players
- To identify and analyze key drivers, restraints, opportunities, and challenges influencing the growth of the remote towers market
- To analyze macro and micro indicators of the market and provide a factor analysis for them
- To forecast the market size of various segments of the remote tower market, with respect to 4 major regions: North America, Europe, Asia Pacific, and the Rest of the World, along with major countries in each region
- To strategically analyze micromarkets1 with respect to individual growth trends, prospects, and contribution to the overall market
- To strategically profile key market players and comprehensively analyze their market rankings and core competencies2
- To track and analyze competitive developments such as joint ventures, mergers & acquisitions, and new product launches & developments of key players in the remote towers market
- To identify detailed financial positions, key products, unique selling points, and key developments of leading companies in the remote towers market
- To identify industry trends, market trends, and technology trends currently prevailing in the remote towers market
1. Micromarkets are defined as the further segments and subsegments of the remote towers market included in the report.
2. Core competencies of companies are captured in terms of their key developments and strategies adopted to sustain their position in the market.
Available customizations
Along with the market data, MarketsandMarkets offers customizations as per the specific needs of companies. The following customization options are available for the report:
Product Analysis
- Product matrix, which gives a detailed comparison of the product portfolio of each company
Regional Analysis
- Further breakdown of the market segments at country-level
Company Information
- Detailed analysis and profiling of additional market players (up to 5)
Growth opportunities and latent adjacency in Remote Towers Market