Safety Switch Market by Product (Contact Switch and Non-Contact Switch), Safety System (ESD, HIPPS, BMS, Fire & Gas Monitoring Systems, and Turbomachinery Control Systems), Vertical (Oil & Gas, Chemical), and Region - Global Forecast to 2023


The Safety switch market is estimated at USD 1.24 Billion in 2018 and is expected to reach USD 1.55 Billion by 2023, at a CAGR of 4.5% during the forecast period. The base year considered for the study is 2017, and the forecast period is between 2018 and 2023. The market is likely to witness high growth in the coming years, driven by the growing adoption of automation in hazardous industrial areas, increasing government intervention for equipment and personnel safety in industries, and rising demand for non-contact door switches to improve the stability of doors and guards. The objective of the report is to provide a detailed analysis of market based on product, safety system, vertical, and region. The report provides detailed information of the major factors influencing the growth of the safety switch market. It also includes a detailed overview of the value chain of the safety switch market.
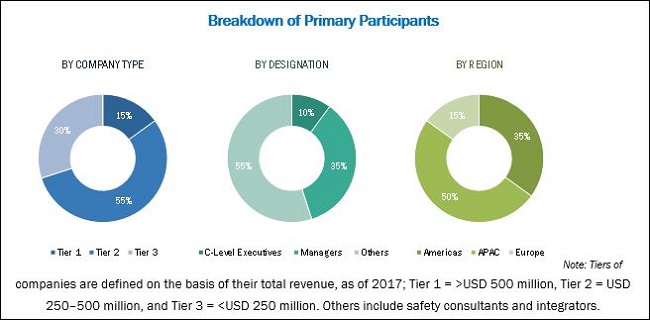
The research methodology used to estimate and forecast the safety switch market begins with obtaining data through secondary research such as Automation World, The International System Safety Society, Occupational Safety and Health Administration (OSHA), and the newsletters and whitepapers of the leading players in this market. The offerings of the safety switch providers have been taken into consideration to determine the market segmentation. The bottom-up procedure has been employed to arrive at the overall size of market from the revenue of key players. After arriving at the overall market size, the total market has been split into several segments and subsegments, which have then been verified through primary research by conducting extensive interviews with officials holding key positions in this market, such as CEOs, VPs, directors, and executives. The market breakdown and data triangulation procedures have been employed to complete the overall market engineering process and arrive at the exact statistics for all the segments and subsegments. The breakdown of the profiles of primaries has been depicted in the following figure:
To know about the assumptions considered for the study, download the pdf brochure
The players offering safety switches market are General Electric (US), Schneider Electric (France), Rockwell (US), Siemens (Germany), and ABB (Switzerland), Eaton (Republic of Ireland), Honeywell (US), Omron (Japan), Pilz (Germany), and SICK (Germany).
Target Audience of the Report:
- Raw Material and Manufacturing Equipment Suppliers
- Electronic Design Automation (EDA) and Design Tool Vendors
- Safety Switch Manufacturers
- Switch Component Manufacturers
- Technology, Service, and Solution Providers
- RFID System Providers for Safety Switches
- Suppliers and Distributors
- System Integrators
- Governments and Other Regulatory Bodies
- Safety Consultants
- Market Research and Consulting Firms
This study answers several questions for the stakeholders, primarily regarding the market segments to focus on in the next two to five years for prioritizing efforts and investments.
Get online access to the report on the World's First Market Intelligence Cloud
Request Sample Scope of the Report
:

This research report categorizes the overall safety switch market, based on product type, safety system, vertical, and region.
Safety Switch Market, By Product Type
- Contact Switch
- Non-contact Switch
Safety Switch Market, By Safety System
- Emergency Shutdown Systems
- High Integrity Pressure Protection Systems
- Burner Management Systems
- Fire & Gas Monitoring Systems
- Turbomachinery Control Systems
Safety Switch Market, By Vertical
- Oil & Gas
- Energy & Power
- Chemical
- Pharmaceutical
- Pulp & Paper
- Metal & Mining
- Water & Wastewater Treatment
- Food & Beverage
- Packaging
- Commercial
- Others
Safety Switch Market, By Region
- Americas
- Europe
- Asia Pacific (APAC)
- Rest of the World (ROW)
Available Customizations:
With the given market data, MarketsandMarkets offers customizations according to the companies� specific needs. The following customization options are available for the report:
Company Information
- Detailed analysis and profiling of additional market players (up to five)
Country Level Analysis
- Further breakdown of the regional segment of market
Vertical Analysis
- Further breakdown of the vertical segment into new industries of market
The safety switch market is expected to grow from USD 1.24 Billion in 2018 to USD 1.55 Billion by 2023, at a CAGR of 4.5% between 2018 and 2023. The growth of this market is fueled by the growing adoption of automation in hazardous industrial areas, increasing government intervention for equipment and personnel safety in industries, and rising demand for non-contact door switches to improve the stability of doors and guards. Developments in market ecosystem through organic and inorganic growth strategies, such as product developments, merger and acquisition, partnerships, collaborations, and agreements further drive the growth of this market.
Among different type of products, the market for non-contact safety switch is expected to grow at a higher CAGR than contact safety switch between 2018 and 2023. Although contact safety switches are predominantly used in every industry, awareness regarding the benefits of non-contact safety switches, such as aligned measurement of guards and multiple door switching error identification, is one of the most significant factors projected to drive the growth of the non-contact safety switch market.
The safety switch market for fire & gas monitoring systems is expected to grow at the highest CAGR between 2018 and 2023. The growth of market for fire & gas monitoring systems can be attributed to the increasing deployment of fire & gas monitoring solution at hazardous locations to avoid fire casualties and prevent gas leakages or explosions. With the expansion of process industries, such as oil & gas, pharmaceutical, chemical, food & beverage, and energy & power, the need for safety and security of equipment and personnel is growing.
Among various industry verticals, oil & gas held the largest share of the overall safety switch market in 2017. Environmental hazards in the oil & gas industry, such as oil spills, natural gas leaks, and discharge of toxic gases have propelled the demand for safety equipment. Thus, various safety systems, such as emergency shutdown systems, fire & gas monitoring systems, high integrity pressure protection systems, and burner management systems are being increasingly deployed in the oil & gas industry, boosting the use of safety solutions, such as safety sensors, safety switches, actuators, safety valves, and safety relays in this industry.
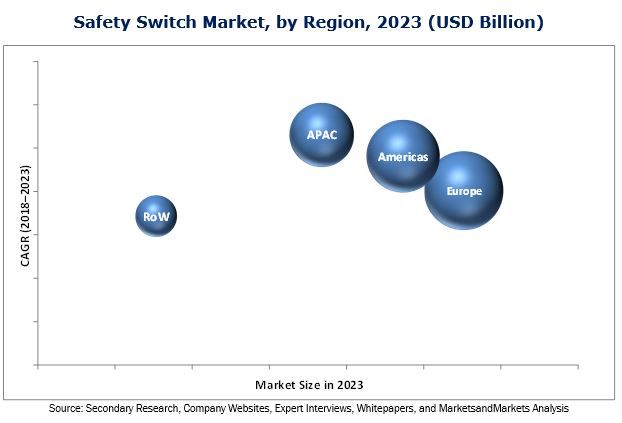
Asia Pacific is expected to hold the largest share of the safety switch market during the forecast period. The demand for safety switches in the region is increasing due to the implementation of safety systems in process industries. Companies operating in this region are focused toward occupational safety and automation. Additionally, the stringent safety regulations in the region have propelled the installation of safety systems in hazardous environments.
The key restraining factor for the growth of the safety switch market is the high investment required for automation implementation and maintenance of equipment in hazardous environments. The consumers of safety switch are the key players in industries such as metal & mining, utility, oil & gas, consumer electronics, medical, food & beverage, chemical, and other discrete industries. The major demand for safety switches is from the oil & gas and food & beverage industries. Oil & gas drilling and servicing activities are undertaken in hazardous environments, which, in turn, mandate the installation of safety systems for such activities. The growing automation in food & beverage industry to satisfy changing demands also contributes to the growth of safety switch market.
Key market players such as General Electric (US), Schneider Electric (France), Rockwell (US), Siemens (Germany), ABB (Switzerland), Eaton (Republic of Ireland), Honeywell (US), Omron (Japan), Pilz (Germany), SICK (Germany), Banner Engineering (US), BERNSTEIN (Germany), Emerson (US), EUCHNER (Germany), Fortress Interlocks (UK), IDEC (Japan), IDEM (UK), Pepperl+Fuchs (Germany), Schmersal (Germany), and Stahl (Germany) focus on strategies such as product launches and developments, agreements, mergers & acquisitions, partnerships, and collaborations to enhance their product offerings and expand their business.
To speak to our analyst for a discussion on the above findings, click Speak to Analyst
Table of Contents
1 Introduction (Page No. - 13)
1.1 Objectives of the Study
1.2 Definition
1.3 Market Segmentation
1.3.1 Markets Covered
1.3.2 Geographic Scope
1.3.3 Years Considered for the Study
1.4 Currency
1.5 Limitations
1.6 Market Stakeholders
2 Research Methodology (Page No. - 16)
2.1 Research Data
2.1.1 Secondary Data
2.1.1.1 Secondary Sources
2.1.2 Primary Data
2.1.2.1 Primary Sources
2.1.2.2 Key Industry Insights
2.1.2.3 Breakdown of Primaries
2.2 Market Size Estimation
2.2.1 Bottom-Up Approach
2.2.2 Top-Down Approach
2.3 Market Breakdown and Data Triangulation
2.4 Research Assumptions
3 Executive Summary (Page No. - 25)
4 Premium Insights (Page No. - 30)
4.1 Attractive Opportunities in the Safety Switch Market
4.2 Market, By Product Type
4.3 Market, By Safety System
4.4 Market, By Vertical
4.5 Market in APAC, By Country and Vertical
4.6 Market, By Region
5 Market Overview (Page No. - 34)
5.1 Introduction
5.2 Market Dynamics
5.2.1 Drivers
5.2.1.1 Growing Adoption of Automation in Hazardous Industrial Areas
5.2.1.2 Increasing Government Intervention for Equipment and Personnel Safety in Industries
5.2.1.3 Increasing Demand for Non-Contact Door Switches to Improve the Stability of Doors Or Guards
5.2.2 Restraints
5.2.2.1 High Investment Required for Automation Implementation and Maintenance of Equipment in Hazardous Environments
5.2.3 Opportunities
5.2.3.1 Rising Acceptance of Workplace Safety Standards in Emerging Economies
5.2.4 Challenges
5.2.4.1 Management of Competitiveness in the Supply Chain
5.3 Value Chain Analysis
6 Safety Switch Market, By Product Type (Page No. - 40)
6.1 Introduction
6.2 Contact Safety Switch
6.2.1 Hinge Switches
6.2.2 Locking Switches
6.2.3 Other Contact Safety Switches
6.3 Non-Contact Safety Switch
6.3.1 Inductive Switches
6.3.2 Magnetic Switches
6.3.3 RFID Transponder Switches
7 Safety Switch Market, By Safety System (Page No. - 48)
7.1 Introduction
7.2 Burner Management Systems (BMS)
7.3 Emergency Shutdown (ESD) Systems
7.4 Fire & Gas Monitoring Systems
7.5 High Integrity Pressure Protection Systems (HIPPS)
7.6 Turbomachinery Control (TMC) Systems
8 Safety Switch Market, By Vertical (Page No. - 55)
8.1 Introduction
8.2 Oil & Gas
8.3 Energy & Power
8.4 Chemical
8.5 Pharmaceutical
8.6 Food & Beverage
8.7 Metal & Mining
8.8 Pulp & Paper
8.9 Water & Wastewater Treatment
8.10 Packaging
8.11 Commercial
8.12 Others
9 Safety Switch Market, By Region (Page No. - 80)
9.1 Introduction
9.2 Americas
9.2.1 US
9.2.2 Canada
9.2.3 Mexico
9.2.4 Rest of Americas
9.3 Europe
9.3.1 Germany
9.3.2 UK
9.3.3 France
9.3.4 Rest of Europe
9.4 APAC
9.4.1 China
9.4.2 Japan
9.4.3 India
9.4.4 Rest of APAC
9.5 RoW
9.5.1 Middle East
9.5.2 Africa
10 Competitive Landscape (Page No. - 95)
10.1 Introduction
10.2 Ranking Analysis of Market Players
10.3 Competitive Scenario
10.3.1 Product Launches and Developments
10.3.2 Agreements, Collaborations, Partnerships, Joint Ventures, Expansions, and Contracts
11 Company Profile (Page No. - 100)
11.1 Introduction
(Business Overview, Products Offered, Recent Developments, SWOT Analysis & MnM View)*
11.2 Key Players
11.2.1 ABB
11.2.2 General Electric
11.2.3 Rockwell
11.2.4 Schneider Electric
11.2.5 Siemens
11.2.6 Eaton
11.2.7 Honeywell
11.2.8 Omron
11.2.9 Pilz
11.2.10 SICK
*Details on Business Overview, Products Offered, Recent Developments, SWOT Analysis & MnM View Might Not Be Captured in Case of Unlisted Companies.
11.3 Other Players
11.3.1 Banner Engineering
11.3.2 BERNSTEIN
11.3.3 Emerson
11.3.4 EUCHNER
11.3.5 Fortress Interlocks (Halma PLC)
11.3.6 IDEC
11.3.7 IDEM
11.3.8 Pepperl+Fuchs
11.3.9 Schmersal
11.3.10 R. Stahl AG
12 Appendix (Page No. - 132)
12.1 Discussion Guide
12.2 Knowledge Store: Marketsandmarkets� Subscription Portal
12.3 Introducing RT: Real-Time Market Intelligence
12.4 Available Customizations
12.5 Related Reports
12.6 Author Details
List of Tables (63 Tables)
Table 1 Market, By Product Type, 2015�2023 (USD Million)
Table 2 Market, By Product Type, 2015�2023 (Thousand Units)
Table 3 Contact Safety Switch Market, By Type, 2015�2023 (USD Million)
Table 4 Contact Market, By Type, 2015�2023 (Thousand Units)
Table 5 Contact Market, By Region, 2015�2023 (USD Million)
Table 6 Non-Contact Safety Switch Market, By Type, 2015�2023 (USD Million)
Table 7 Non-Contact Market, By Type, 2015�2023 (Thousand Units)
Table 8 Non-Contact Market, By Region, 2015�2023 (USD Million)
Table 9 Market, By Area of Installation, 2015�2023 (USD Million)
Table 10 Market for Non-Hazardous Area, By Product Type, 2015�2023 (USD Million)
Table 11 Market for Hazardous Area, By Product Type, 2015�2023 (USD Million)
Table 12 Market, By Safety System, 2015�2023 (USD Million)
Table 13 Market for Burner Management Systems, By Product Type, 2015�2023 (USD Million)
Table 14 Market for Emergency Shutdown Systems, By Product Type, 2015�2023 (USD Million)
Table 15 Market for Fire & Gas Monitoring Systems, By Product Type, 2015�2023 (USD Million)
Table 16 Market for High Integrity Pressure Protection Systems, By Product Type, 2015�2023 (USD Million)
Table 17 Market for Turbomachinery Control Systems, By Product Type, 2015�2023 (USD Million)
Table 18 Market, By Vertical, 2015�2023 (USD Million)
Table 19 Market for Oil & Gas Vertical, By Safety System, 2015�2023 (USD Million)
Table 20 Market for Oil & Gas Vertical, By Product Type, 2015�2023 (USD Million)
Table 21 Market for Oil & Gas Vertical, By Region, 2015�2023 (USD Million)
Table 22 Market for Energy & Power Vertical, By Safety System, 2015�2023 (USD Million)
Table 23 Market for Energy & Power Vertical, By Product Type, 2015�2023 (USD Million)
Table 24 Market for Energy & Power Vertical, By Region, 2015�2023 (USD Million)
Table 25 Market for Chemical Vertical, By Safety System, 2015�2023 (USD Million)
Table 26 Market for Chemical Vertical, By Product Type, 2015�2023 (USD Million)
Table 27 Market for Chemical Vertical, By Region, 2015�2023 (USD Million)
Table 28 Market for Pharmaceutical Vertical, By Safety System, 2015�2023 (USD Million)
Table 29 Market for Pharmaceutical Vertical, By Product Type, 2015�2023 (USD Million)
Table 30 Market for Pharmaceutical Vertical, By Region, 2015�2023 (USD Million)
Table 31 Market for Food & Beverage Vertical, By Safety System, 2015�2023 (USD Million)
Table 32 Market for Food & Beverage Vertical, By Product Type, 2015�2023 (USD Million)
Table 33 Market for Food & Beverage Vertical, By Region, 2015�2023 (USD Million)
Table 34 Market for Metal & Mining Vertical, By Safety System, 2015�2023 (USD Million)
Table 35 Market for Metal & Mining Vertical, By Product Type, 2015�2023 (USD Million)
Table 36 Market for Metal & Mining Vertical, By Region, 2015�2023 (USD Million)
Table 37 Market for Pulp & Paper Vertical, By Safety System, 2015�2023 (USD Million)
Table 38 Market for Pulp & Paper Vertical, By Product Type, 2015�2023 (USD Million)
Table 39 Market for Pulp & Paper Vertical, By Region, 2015�2023 (USD Million)
Table 40 Market for Water & Wastewater Treatment Vertical, By Safety System, 2015�2023 (USD Million)
Table 41 Market for Water & Wastewater Treatment Vertical, By Product Type, 2015�2023 (USD Million)
Table 42 Market for Water & Wastewater Treatment Vertical, By Region, 2015�2023 (USD Million)
Table 43 Market for Packaging Vertical, By Safety System, 2015�2023 (USD Million)
Table 44 Market for Packaging Vertical, By Product Type, 2015�2023 (USD Million)
Table 45 Market for Packaging Vertical, By Region, 2015�2023 (USD Million)
Table 46 Market for Commercial Vertical, By Safety System, 2015�2023 (USD Million)
Table 47 Market for Commercial Vertical, By Product Type, 2015�2023 (USD Million)
Table 48 Market for Commercial Vertical, By Region, 2015�2023 (USD Million)
Table 49 Market for Other Verticals, By Safety System, 2015�2023 (USD Million)
Table 50 Market for Other Verticals, By Product Type, 2015�2023 (USD Million)
Table 51 Market for Other Verticals, By Region, 2015�2023 (USD Million)
Table 52 Market, By Region, 2015�2023 (USD Million)
Table 53 Market in Americas, By Country, 2015�2023 (USD Million)
Table 54 Market in Americas, By Vertical, 2015�2023 (USD Million)
Table 55 Market in Europe, By Country, 2015�2023 (USD Million)
Table 56 Market in Europe, By Vertical, 2015�2023 (USD Million)
Table 57 Market in Asia Pacific, By Country, 2015�2023 (USD Million)
Table 58 Market in Asia Pacific, By Vertical, 2015�2023 (USD Million)
Table 59 Market in Rest of the World, By Country, 2015�2023 (USD Million)
Table 60 Market in Rest of the World, By Vertical, 2015�2023 (USD Million)
Table 61 Ranking of Top 5 Players in the Safety Switch Market, 2017
Table 62 10 Key Product Launches, Product Developments, and Technology Developments
Table 63 Key Agreements, Collaborations, Partnerships, Joint Ventures, Expansions, and Contracts
List of Figures (54 Figures)
Figure 1 Market Segmentation
Figure 2 Market: Research Design
Figure 3 Research Flow of Market Size Estimation
Figure 4 Market Size Estimation Methodology: Bottom-Up Approach
Figure 5 Market Size Estimation Methodology: Top-Down Approach
Figure 6 Data Triangulation
Figure 7 Contact Switch Estimated to Account for Larger Size of Market in 2018
Figure 8 Emergency Shutdown Systems Estimated to Account for the Largest Size of Market in 2018
Figure 9 Market for Food & Beverage Vertical Expected to Grow at the Highest CAGR During the Forecast Period
Figure 10 Europe Accounted for the Largest Share of Market in 2017
Figure 11 Increasing Demand for Occupational Safety Drives the Growth of Market
Figure 12 Contact Switch Expected to Lead the Market During the Forecast Period
Figure 13 Fire & Gas Monitoring Systems Expected to Grow at the Highest CAGR During the Forecast Period
Figure 14 Oil & Gas Vertical Expected to Lead the Market During the Forecast Period
Figure 15 Oil & Gas Vertical to Account for the Largest Share of the Market in APAC By 2023
Figure 16 Market in APAC Expected to Grow at the Highest CAGR From 2018 to 2023
Figure 17 Market Dynamics: Drivers, Restraints, Opportunities, and Challenges
Figure 18 Occupational Safety Performance
Figure 19 Value Chain Analysis of the Safety Switch Market
Figure 20 Safety Switch Market, By Product Type
Figure 21 Market for Non-Contact Safety Switch to Grow at Higher During Forecast Period
Figure 22 Hinge Switches Expected to Lead the Contact Market During the Forecast Period
Figure 23 Magnetic Switches Expected to Lead the Non-Contact Market During the Forecast Period
Figure 24 Safety Switch Market, By Safety System
Figure 25 Market for Fire & Gas Monitoring Systems Expected to Grow at the Highest CAGR During the Forecast Period
Figure 26 Safety Switch Market, By Vertical
Figure 27 Oil & Gas Vertical Expected to Lead the Market During the Forecast Period
Figure 28 Market for Oil & Gas Vertical in Asia Pacific Expected to Grow at the Highest CAGR During the Forecast Period
Figure 29 Market for Energy & Power Vertical in Asia Pacific Expected to Grow at the Highest CAGR During the Forecast Period
Figure 30 Asia Pacific Expected to Lead the Market for Chemical Vertical During the Forecast Period
Figure 31 Market for Pharmaceutical Vertical in Asia Pacific Expected to Grow at the Highest CAGR During the Forecast Period
Figure 32 Market for Food & Beverage Vertical in Asia Pacific Expected to Grow at the Highest CAGR During the Forecast Period
Figure 33 Market for Metal & Mining Vertical in Asia Pacific Expected to Grow at the Highest CAGR During the Forecast Period
Figure 34 Market for Pulp & Paper Vertical in Asia Pacific Expected to Grow at the Highest CAGR During the Forecast Period
Figure 35 Market for Water & Wastewater Treatment Vertical in Asia Pacific Expected to Grow at the Highest CAGR During the Forecast Period
Figure 36 Market for Packaging Vertical in Asia Pacific Expected to Grow at the Highest CAGR During the Forecast Period
Figure 37 Market for Commercial Vertical in Asia Pacific Expected to Grow at the Highest CAGR During the Forecast Period
Figure 38 Market for Other Verticals in Asia Pacific Expected to Grow at the Highest CAGR During the Forecast Period
Figure 39 Europe Projected to Lead the Market During the Forecast Period
Figure 40 Americas Market Snapshot
Figure 41 Europe Market Snapshot
Figure 42 Asia Pacific Market Snapshot
Figure 43 Companies Adopted Agreements, Collaborations, and Product Developments as Key Growth Strategies Between January 2015 and December 2017
Figure 44 Safety Switch Market Evaluation Framework
Figure 45 Battle for the Market Share
Figure 46 ABB: Company Snapshot
Figure 47 General Electric: Company Snapshot
Figure 48 Rockwell: Company Snapshot
Figure 49 Schneider Electric: Company Snapshot
Figure 50 Siemens: Company Snapshot
Figure 51 Eaton: Company Snapshot
Figure 52 Honeywell: Company Snapshot
Figure 53 Omron: Company Snapshot
Figure 54 SICK: Company Snapshot


Growth opportunities and latent adjacency in Safety Switch Market