[247 Pages Report] The global single-use assemblies market is projected to reach USD 6.3 billion by 2026 from USD 2.2 billion in 2021, at a CAGR of 23.3% during the forecast period. The growth of the market can primarily be attributed to the major advantages of single-use technologies as compared to traditional stainless-steel assemblies, such as rapid implementation and the low risk of cross-contamination. The increasing biopharmaceutical R&D expenditure and growing biologics market are also driving the market growth.
To know about the assumptions considered for the study, Request for Free Sample Report
COVID-19 is an infectious disease caused by the most recently discovered novel coronavirus. Largely unknown before the outbreak began in Wuhan (China) in December 2019, COVID-19 has since moved from being a regional crisis to a global pandemic. With the World Health Organization (WHO) officially declared the outbreak of the virus as a pandemic, a mix of established pharmaceutical companies, as well as players in the single-use assemblies market, have stepped forward to develop treatments and vaccines that target the infection caused by the novel coronavirus. A few examples in this regard are mentioned below:
Since most of the leading COVID-19 vaccine programs are using novel approaches, including mRNA, DNA vaccine, and vectors, these platforms are largely built on single-use technology. Most of the pandemic-related new facilities are largely engaging single-use systems (SUS) due to their flexibility combined with high speed and much lower capital investment compared to traditional stainless-steel equipment.
The growing adoption of single-use technology for COVID-19-related research, coupled with the increasing developments by key players to support vaccine development, is expected to favor the growth of the market.
A single-use solution has numerous advantages over traditional bioprocessing technologies, due to which the adoption of single-use assemblies is growing continuously. These include the faster implementation of single-use assembly components in the bioprocess cycle and a lower risk of cross-contamination. Single-use assemblies are ergonomically designed to hold integrated single-use flow paths for faster set-up and reduced space requirements. The product design is aimed to reduce the amount of time and cost related to preparation, set-up, testing, validation, and documentation. In addition, with the elimination of the Clean-In-Place (CIP) and Sterilization-In-Place (SIP) steps, the project lead time for the implementation of single-use production plants is reduced by at least eight months as compared to stainless-steel reactors and reusable assemblies. Owing to such advantages, single-use solutions enable faster batch turnaround and product change-over.
Product cross-contamination is a major concern in the biomanufacturing industry. The potential for cross-contamination occurs when the same process equipment is used repeatedly in the process cycle. Unwanted protein contamination, for example, may reduce production yields by requiring additional purification steps, or in the worst possible case, proteins that co-purify may result in potentially fatal treatments. Since the product flow path is discarded and replaced after each batch, the risk of product cross-contamination between batches is virtually eliminated with the use of single-use assembly components. Single-use component manufacturers also typically make and assemble products in cleanrooms to ensure that their products do not introduce harmful particulates and endotoxins into a bioprocess. Such advantages are driving the adoption of single-use assemblies among end users in the biopharmaceutical & pharmaceutical industries.
Extractables are compounds that can be extracted from source materials using appropriate solvents under vigorous laboratory conditions, while leachables are compounds present in drug products caused by leaching from containers, closures, and processing components. Therefore, leachables can be considered a subset of extractables. Extractables and leachables are commonly associated with polymeric and elastomeric materials due to the use of additives to increase stability and aid in the formation of material components.
According to a survey conducted by BioPlan Associates in 2018, 73.3% of respondents agreed that leachables and extractables are major concerns that might limit the use of bioprocessing in the near future. As single-use assembly products are made of processed plastic materials, they often face the problem of contamination from the container due to leachables. Furthermore, a majority of biopharmaceutical processes frequently require high temperatures during their operation, which results in the generation of unnecessary and unknown chemicals that may contaminate the end product. Thus, concerns regarding extractables and leachables arising from the components of single-use assemblies may hinder their adoption in the coming years. This is expected to restrain the overall market growth.
Emerging economies such as China, India, and Indonesia are expected to offer significant growth opportunities for players operating in the single-use assemblies market. This can be attributed to high growth in their respective pharmaceutical & biopharmaceutical sectors owing to the presence of less-stringent regulatory policies as well as low-cost and skilled labor. In addition, the high and growing incidence of chronic and infectious diseases, rising disposable income levels, improving access to healthcare services, and the implementation of favorable government policies are also attracting companies to these countries.
The growing presence of global as well as local pharmaceutical & biopharmaceutical companies in these countries is a major factor driving the demand for single-use assemblies. India, China, Korea, and Brazil are a hub for bioprocess outsourcing owing to their cost advantages and the talent pool offered by these countries. For instance, India has more than 175 US FDA-approved pharmaceutical manufacturing units that offer ~40% lower operational costs in comparison to its western counterparts. Also, according to the India Brand Equity Foundation, Indian companies received 304 Abbreviated New Drug Application (ANDA) approvals from the US FDA in 2017. Similarly, China is the second-largest pharmaceutical market globally, with total spending of USD 137 billion in 2018.
With the increase in pharmaceutical & biopharmaceutical manufacturing, government authorities in these countries are focusing on good manufacturing practices and validated laboratory procedures. The implementation of regulatory measures to prohibit the import & supply of drugs that are contaminated or impure after bioprocessing is expected to increase the demand for cost-effective single-use assemblies in these countries.
The solid waste generated from single-use assemblies creates several challenges for biomanufacturing companies, such as the disposal of solid waste and an increase in waste management costs. Most single-use assemblies are made of multiple materials or layers, including polyethylene, polypropylene, ethylene vinyl alcohol, or nylon. Such products require extensive efforts to separate components into homogeneous components. As a result, most single-use assemblies and their components are not suited for recycling. This leads to the generation of large volumes of solid waste; its disposal is a challenging prospect for biopharmaceutical companies.
On the basis of product, the market is segmented into bag assemblies, filtration assemblies, bottle assemblies, mixing system assemblies, and other products. The bag assemblies segment accounted for the largest market share in 2020. Single-use bag assemblies have broad applications in bioprocesses, including buffers and media preparation, cell culture, harvest & intermediate collection, sampling, freezing & thawing, and storage & transport. They enable critical liquid handling in biomanufacturing and eliminate the time and cost of additional cleaning-in-place and sterilization-in-place (CIP/SIP) system set-up, maintenance, and validation.
Based on solution, the market is segmented into standard solutions and customized solutions. The standard solutions segment accounted for a larger share of the market in 2020. The adoption of standard solutions is high in the pharmaceutical & biopharmaceutical industries due to the advantages these solutions offer, such as manufacturing process efficiency with reduced capital costs, improved flexibility with the use of pre-qualified components for building assemblies, reduced implementation time, and more flexibility with production planning.
On the basis of end users, the market is segmented into biopharmaceutical & pharmaceutical companies, contract research & manufacturing organizations (CROs & CMOs), and academic & research institutes. In 2020, the biopharmaceutical & pharmaceutical companies segment accounted for the largest share of the market. The demand for biopharmaceuticals among the geriatric population is increasing as the elderly are more prone to diseases/disorders, which are treated using biologics. This has resulted in the increased focus of biopharmaceutical companies on developing affordable biologics at lower costs. As single-use assemblies have wide applications in each stage of the production cycle, their adoption is increasing with the growth in the production of biologics and biosimilars.
On the basis of applications, the market is segmented into filtration, cell culture & mixing, storage, sampling, fill-finish applications, and other applications. In 2020, the filtration segment accounted for the largest share of the market. The adoption of single-use assemblies for filtration is increasing rapidly due to their benefits in this application, such as ease of column cleaning, sterilization, packing, and simplified validation and cleaning, which allows more batches to be run.
In 2020, North America accounted for the largest share of the market. The large share of the North American market can be attributed to its well-established biopharmaceutical industry, wide availability of single-use assemblies offered by market leaders in the region, and increased production of biologics and biosimilars in the region.
Prominent players operating in the single-use assemblies market are Thermo Fisher Scientific, Inc. (US) Sartorius Stedim Biotech (France), Danaher Corporation (US),Merck KGaA (Germany),Avantor, Inc. (US), and Saint-Gobain (France).
Report Metric |
Details |
Market Size Available for Years |
20172026 |
Base Year Considered |
2020 |
Forecast Period |
20212026 |
Forecast Units |
Value (USD Billion) |
Segments Covered |
Product, Solution, Application, End User, and Region |
Geographies Covered |
North America, Europe, APAC, and RoW |
Companies Covered |
The major market players include Thermo Fisher Scientific, Inc. (US), Sartorius Stedim Biotech (France), Danaher Corporation (US), Merck KGaA (Germany), Avantor, Inc. (US), and Saint-Gobain (France).
|
The study categorizes the single-use assemblies market into the following segments and subsegments:
What is the current size of the global single-use assemblies market?
The global single-use assemblies market is projected to reach USD 6.3 billion by 2026 from USD 2.2 billion in 2021, at a CAGR of 23.3% during the forecast period.
Who are the leading players in the single-use assemblies market?
Prominent players operating in the single-use assemblies market are Thermo Fisher Scientific, Inc. (US), Sartorius Stedim Biotech (France), Danaher Corporation (US), Merck KGaA (Germany), Avantor, Inc. (US), and Saint-Gobain (France).
Who are the major end users of the single-use assemblies market?
The end users of the single-use assemblies market are biopharmaceutical & pharmaceutical companies, contract research & manufacturing organizations (CROs & CMOs), and academic & research institutes. In 2020, the biopharmaceutical & pharmaceutical companies segment accounted for the largest share of the single-use assemblies market.
What are the major drivers of the single-use assemblies market?
The growth of the single-use assemblies market can primarily be attributed to the major advantages of single-use technologies as compared to traditional stainless-steel assemblies, such as rapid implementation and the low risk of cross-contamination. The increasing biopharmaceutical R&D expenditure and growing biologics market are also driving the market growth. .
To speak to our analyst for a discussion on the above findings, click Speak to Analyst
TABLE OF CONTENTS
1 INTRODUCTION (Page No. - 36)
1.1 OBJECTIVES OF THE STUDY
1.2 MARKET DEFINITION
1.2.1 INCLUSIONS & EXCLUSIONS OF THE STUDY
1.3 MARKET SCOPE
1.3.1 MARKETS COVERED
1.3.2 YEARS CONSIDERED FOR THE STUDY
1.4 CURRENCY
1.5 LIMITATIONS
1.6 STAKEHOLDERS
1.7 SUMMARY OF CHANGES
2 RESEARCH METHODOLOGY (Page No. - 41)
2.1 RESEARCH DATA
FIGURE 1 RESEARCH DESIGN
2.1.1 SECONDARY DATA
2.1.1.1 Secondary sources: Single-use assemblies market
2.1.2 PRIMARY DATA
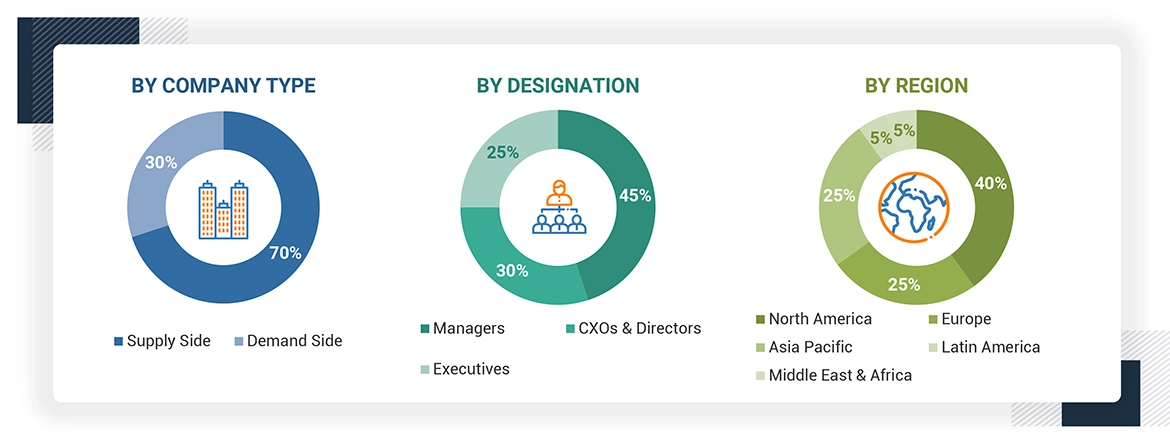
FIGURE 2 BREAKDOWN OF PRIMARIES: SINGLE-USE ASSEMBLIES MARKET
2.1.2.1 Key data from primary sources
2.2 MARKET ESTIMATION METHODOLOGY
FIGURE 3 RESEARCH METHODOLOGY: HYPOTHESIS BUILDING
2.2.1 REVENUE MAPPING-BASED MARKET ESTIMATION
FIGURE 4 MARKET SIZE ESTIMATION: SINGLE-USE ASSEMBLIES MARKET
2.2.2 PRIMARY RESEARCH VALIDATION
2.3 DATA TRIANGULATION
FIGURE 5 DATA TRIANGULATION METHODOLOGY
2.4 RESEARCH ASSUMPTIONS
2.5 RESEARCH LIMITATIONS
3 EXECUTIVE SUMMARY (Page No. - 49)
FIGURE 6 SINGLE-USE ASSEMBLIES MARKET, BY PRODUCT, 2021 VS. 2026 (USD MILLION)
FIGURE 7 SINGLE-USE ASSEMBLIES MARKET SHARE, BY SOLUTION, 2020
FIGURE 8 SINGLE-USE ASSEMBLIES MARKET, BY APPLICATION, 2021 VS. 2026 (USD MILLION)
FIGURE 9 SINGLE-USE ASSEMBLIES MARKET SHARE, BY END USER, 2020
FIGURE 10 GEOGRAPHICAL SNAPSHOT OF THE SINGLE-USE ASSEMBLIES MARKET
4 PREMIUM INSIGHTS (Page No. - 53)
4.1 SINGLE-USE ASSEMBLIES MARKET OVERVIEW
FIGURE 11 THE ADVANTAGES OF SINGLE-USE ASSEMBLIES OVER TRADITIONAL COUNTERPARTS ARE EXPECTED TO DRIVE MARKET GROWTH
4.2 NORTH AMERICA: SINGLE-USE ASSEMBLIES MARKET SHARE, BY PRODUCT & COUNTRY (2021)
FIGURE 12 BAG ASSEMBLIES ACCOUNT FOR THE LARGEST SHARE OF THE NORTH AMERICAN SINGLE-USE ASSEMBLIES MARKET
4.3 SINGLE-USE ASSEMBLIES MARKET, BY APPLICATION, 20212026
FIGURE 13 CELL CULTURE & MIXING TO REGISTER THE HIGHEST GROWTH RATE DURING THE FORECAST PERIOD
5 MARKET OVERVIEW (Page No. - 56)
5.1 INTRODUCTION
5.2 SINGLE-USE ASSEMBLIES MARKET: DRIVERS, RESTRAINTS, OPPORTUNITIES, AND CHALLENGES
5.2.1 DRIVERS
5.2.1.1 Rapid implementation and low risk of cross-contamination
FIGURE 14 ADOPTION OF SINGLE-USE PRODUCTS IN BIOPHARMACEUTICAL MANUFACTURING, 2019
5.2.1.2 Increasing biopharmaceutical R&D
FIGURE 15 R&D INVESTMENTS BY PHARMACEUTICAL & BIOTECHNOLOGY COMPANIES, 2010−2025 (USD BILLION)
5.2.1.3 Growing biologics market
FIGURE 16 GLOBAL BIOLOGICS MARKET, 2014−2023 (USD BILLION)
5.2.2 RESTRAINTS
5.2.2.1 Issues related to extractables & leachables
5.2.3 OPPORTUNITIES
5.2.3.1 Emerging countries
5.2.3.2 Patent expiry
TABLE 1 US: BIOLOGICS GOING OFF-PATENT DURING 20182024
5.2.4 CHALLENGES
5.2.4.1 Waste disposal
TABLE 2 COMPARISON OF DISPOSAL OPTIONS FOR SINGLE-USE ASSEMBLY PRODUCTS
5.3 IMPACT OF COVID-19 ON THE SINGLE-USE ASSEMBLIES MARKET
FIGURE 17 COVID-19 IMPACT ON THE SINGLE-USE ASSEMBLIES MARKET, 2019─2021, (USD MILLION)
6 SINGLE-USE ASSEMBLIES MARKET, BY PRODUCT (Page No. - 64)
6.1 INTRODUCTION
TABLE 3 SINGLE-USE ASSEMBLIES MARKET, BY PRODUCT, 20172020 (USD MILLION)
TABLE 4 SINGLE-USE ASSEMBLIES MARKET, BY PRODUCT, 20212026 (USD MILLION)
6.2 BAG ASSEMBLIES
6.2.1 BAG ASSEMBLIES SEGMENT DOMINATES THE MARKET
TABLE 5 SINGLE-USE BAG ASSEMBLIES MARKET, BY REGION, 20172020 (USD MILLION)
TABLE 6 SINGLE-USE BAG ASSEMBLIES MARKET, BY REGION, 20212026 (USD MILLION)
TABLE 7 NORTH AMERICA: SINGLE-USE BAG ASSEMBLIES MARKET, BY COUNTRY, 20172020 (USD MILLION)
TABLE 8 NORTH AMERICA: SINGLE-USE BAG ASSEMBLIES MARKET, BY COUNTRY, 20212026 (USD MILLION)
TABLE 9 EUROPE: SINGLE-USE BAG ASSEMBLIES MARKET, BY COUNTRY, 20172020 (USD MILLION)
TABLE 10 EUROPE: SINGLE-USE BAG ASSEMBLIES MARKET, BY COUNTRY, 20212026 (USD MILLION)
TABLE 11 ASIA PACIFIC: SINGLE-USE BAG ASSEMBLIES MARKET, BY COUNTRY, 20172020 (USD MILLION)
TABLE 12 ASIA PACIFIC: SINGLE-USE BAG ASSEMBLIES MARKET, BY COUNTRY, 20212026 (USD MILLION)
6.3 FILTRATION ASSEMBLIES
6.3.1 INCREASING FOCUS ON REDUCING CONTAMINATION HAS DRIVEN THE ADOPTION OF FILTER ASSEMBLIES
TABLE 13 SINGLE-USE FILTRATION ASSEMBLIES MARKET, BY REGION, 20172020 (USD MILLION)
TABLE 14 SINGLE-USE FILTRATION ASSEMBLIES MARKET, BY REGION, 20212026 (USD MILLION)
TABLE 15 NORTH AMERICA: SINGLE-USE FILTRATION ASSEMBLIES MARKET, BY COUNTRY, 20172020 (USD MILLION)
TABLE 16 NORTH AMERICA: SINGLE-USE FILTRATION ASSEMBLIES MARKET, BY COUNTRY, 20212026 (USD MILLION)
TABLE 17 EUROPE: SINGLE-USE FILTRATION ASSEMBLIES MARKET, BY COUNTRY, 20172020 (USD MILLION)
TABLE 18 EUROPE: SINGLE-USE FILTRATION ASSEMBLIES MARKET, BY COUNTRY, 20212026 (USD MILLION)
TABLE 19 ASIA PACIFIC: SINGLE-USE FILTRATION ASSEMBLIES MARKET, BY COUNTRY, 20172020 (USD MILLION)
TABLE 20 ASIA PACIFIC: SINGLE-USE FILTRATION ASSEMBLIES MARKET, BY COUNTRY, 20212026 (USD MILLION)
6.4 BOTTLE ASSEMBLIES
6.4.1 USE OF BOTTLE ASSEMBLIES REDUCES DOWNTIME AND TURNAROUND TIMEKEY ADVANTAGES DRIVING MARKET GROWTH
TABLE 21 SINGLE-USE BOTTLE ASSEMBLIES MARKET, BY REGION, 20172020 (USD MILLION)
TABLE 22 SINGLE-USE BOTTLE ASSEMBLIES MARKET, BY REGION, 20212026 (USD MILLION)
TABLE 23 NORTH AMERICA: SINGLE-USE BOTTLE ASSEMBLIES MARKET, BY COUNTRY, 20172020 (USD MILLION)
TABLE 24 NORTH AMERICA: SINGLE-USE BOTTLE ASSEMBLIES MARKET, BY COUNTRY, 20212026 (USD MILLION)
TABLE 25 EUROPE: SINGLE-USE BOTTLE ASSEMBLIES MARKET, BY COUNTRY, 20172020 (USD MILLION)
TABLE 26 EUROPE: SINGLE-USE BOTTLE ASSEMBLIES MARKET, BY COUNTRY, 20212026 (USD MILLION)
TABLE 27 ASIA PACIFIC: SINGLE-USE BOTTLE ASSEMBLIES MARKET, BY COUNTRY, 20172020 (USD MILLION)
TABLE 28 ASIA PACIFIC: SINGLE-USE BOTTLE ASSEMBLIES MARKET, BY COUNTRY, 20212026 (USD MILLION)
6.5 MIXING SYSTEM ASSEMBLIES
6.5.1 FLEXIBILITY IN MULTIPRODUCT MANUFACTURING HAS DRIVEN THE ADOPTION OF MIXING SYSTEM ASSEMBLIES
TABLE 29 SINGLE-USE MIXING SYSTEM ASSEMBLIES MARKET, BY REGION, 20172020 (USD MILLION)
TABLE 30 SINGLE-USE MIXING SYSTEM ASSEMBLIES MARKET, BY REGION, 20212026 (USD MILLION)
TABLE 31 NORTH AMERICA: SINGLE-USE MIXING SYSTEM ASSEMBLIES MARKET, BY COUNTRY, 20172020 (USD MILLION)
TABLE 32 NORTH AMERICA: SINGLE-USE MIXING SYSTEM ASSEMBLIES MARKET, BY COUNTRY, 20212026 (USD MILLION)
TABLE 33 EUROPE: SINGLE-USE MIXING SYSTEM ASSEMBLIES MARKET, BY COUNTRY, 20172020 (USD MILLION)
TABLE 34 EUROPE: SINGLE-USE MIXING SYSTEM ASSEMBLIES MARKET, BY COUNTRY, 20212026 (USD MILLION)
TABLE 35 ASIA PACIFIC: SINGLE-USE MIXING SYSTEM ASSEMBLIES MARKET, BY COUNTRY, 20172020 (USD MILLION)
TABLE 36 ASIA PACIFIC: SINGLE-USE MIXING SYSTEM ASSEMBLIES MARKET, BY COUNTRY, 20212026 (USD MILLION)
6.6 OTHER PRODUCTS
TABLE 37 OTHER SINGLE-USE ASSEMBLY PRODUCTS MARKET, BY REGION, 20172020 (USD MILLION)
TABLE 38 OTHER SINGLE-USE ASSEMBLY PRODUCTS MARKET, BY REGION, 20212026 (USD MILLION)
TABLE 39 NORTH AMERICA: OTHER SINGLE-USE ASSEMBLY PRODUCTS MARKET, BY COUNTRY, 20172020 (USD MILLION)
TABLE 40 NORTH AMERICA: OTHER SINGLE-USE ASSEMBLY PRODUCTS MARKET, BY COUNTRY, 20212026 (USD MILLION)
TABLE 41 EUROPE: OTHER SINGLE-USE ASSEMBLY PRODUCTS MARKET, BY COUNTRY, 20172020 (USD MILLION)
TABLE 42 EUROPE: OTHER SINGLE-USE ASSEMBLY PRODUCTS MARKET, BY COUNTRY, 20212026 (USD MILLION)
TABLE 43 ASIA PACIFIC: OTHER SINGLE-USE ASSEMBLY PRODUCTS MARKET, BY COUNTRY, 20172020 (USD MILLION)
TABLE 44 ASIA PACIFIC: OTHER SINGLE-USE ASSEMBLY PRODUCTS MARKET, BY COUNTRY, 20212026 (USD MILLION)
7 SINGLE-USE ASSEMBLIES MARKET, BY SOLUTION (Page No. - 84)
7.1 INTRODUCTION
TABLE 45 SINGLE-USE ASSEMBLIES MARKET, BY SOLUTION, 20172020 (USD MILLION)
TABLE 46 SINGLE-USE ASSEMBLIES MARKET, BY SOLUTION, 20212026 (USD MILLION)
7.2 STANDARD SOLUTIONS
7.2.1 STANDARD SOLUTIONS ACCOUNT FOR THE LARGER SHARE OF THE SINGLE-USE ASSEMBLIES MARKET
TABLE 47 STANDARD SOLUTIONS MARKET, BY REGION, 20172020 (USD MILLION)
TABLE 48 STANDARD SOLUTIONS MARKET, BY REGION, 20212026 (USD MILLION)
TABLE 49 NORTH AMERICA: STANDARD SOLUTIONS MARKET, BY COUNTRY, 20172020 (USD MILLION)
TABLE 50 NORTH AMERICA: STANDARD SOLUTIONS MARKET, BY COUNTRY, 20212026 (USD MILLION)
TABLE 51 EUROPE: STANDARD SOLUTIONS MARKET, BY COUNTRY, 20172020 (USD MILLION)
TABLE 52 EUROPE: STANDARD SOLUTIONS MARKET, BY COUNTRY, 20212026 (USD MILLION)
TABLE 53 ASIA PACIFIC: STANDARD SOLUTIONS MARKET, BY COUNTRY, 20172020 (USD MILLION)
TABLE 54 ASIA PACIFIC: STANDARD SOLUTIONS MARKET, BY COUNTRY, 20212026 (USD MILLION)
7.3 CUSTOMIZED SOLUTIONS
7.3.1 ADOPTION OF CUSTOMIZED SOLUTIONS IS LIMITED AND ONLY ARISES IN CASE OF MATERIAL COMPATIBILITY ISSUES
TABLE 55 CUSTOMIZED SOLUTIONS MARKET, BY REGION, 20172020 (USD MILLION)
TABLE 56 CUSTOMIZED SOLUTIONS MARKET, BY REGION, 20212026 (USD MILLION)
TABLE 57 NORTH AMERICA: CUSTOMIZED SOLUTIONS MARKET, BY COUNTRY, 20172020 (USD MILLION)
TABLE 58 NORTH AMERICA: CUSTOMIZED SOLUTIONS MARKET, BY COUNTRY, 20212026 (USD MILLION)
TABLE 59 EUROPE: CUSTOMIZED SOLUTIONS MARKET, BY COUNTRY, 20172020 (USD MILLION)
TABLE 60 EUROPE: CUSTOMIZED SOLUTIONS MARKET, BY COUNTRY, 20212026 (USD MILLION)
TABLE 61 ASIA PACIFIC: CUSTOMIZED SOLUTIONS MARKET, BY COUNTRY, 20172020 (USD MILLION)
TABLE 62 ASIA PACIFIC: CUSTOMIZED SOLUTIONS MARKET, BY COUNTRY, 20212026 (USD MILLION)
8 SINGLE-USE ASSEMBLIES MARKET, BY APPLICATION (Page No. - 93)
8.1 INTRODUCTION
TABLE 63 MARKET, BY APPLICATION, 20172020 (USD MILLION)
TABLE 64 MARKET, BY APPLICATION, 20212026 (USD MILLION)
8.2 FILTRATION
8.2.1 FILTRATION DOMINATED THE APPLICATIONS MARKET IN 2020
TABLE 65 SINGLE-USE ASSEMBLIES MARKET FOR FILTRATION APPLICATIONS, BY REGION, 20172020 (USD MILLION)
TABLE 66 MARKET FOR FILTRATION APPLICATIONS, BY REGION, 20212026 (USD MILLION)
TABLE 67 NORTH AMERICA: MARKET FOR FILTRATION APPLICATIONS, BY COUNTRY, 20172020 (USD MILLION)
TABLE 68 NORTH AMERICA: MARKET FOR FILTRATION APPLICATIONS, BY COUNTRY, 20212026 (USD MILLION)
TABLE 69 EUROPE: MARKET FOR FILTRATION APPLICATIONS, BY COUNTRY, 20172020 (USD MILLION)
TABLE 70 EUROPE: MARKET FOR FILTRATION APPLICATIONS, BY COUNTRY, 20212026 (USD MILLION)
TABLE 71 ASIA PACIFIC: MARKET FOR FILTRATION APPLICATIONS, BY COUNTRY, 20172020 (USD MILLION)
TABLE 72 ASIA PACIFIC: MARKET FOR FILTRATION APPLICATIONS, BY COUNTRY, 20212026 (USD MILLION)
8.3 CELL CULTURE & MIXING
8.3.1 NORTH AMERICA IS EXPECTED TO HOLD THE LARGEST SHARE OF THE CELL CULTURE & MIXING APPLICATION SEGMENT
TABLE 73 SINGLE-USE ASSEMBLIES MARKET FOR CELL CULTURE & MIXING APPLICATIONS, BY REGION, 20172020 (USD MILLION)
TABLE 74 MARKET FOR CELL CULTURE & MIXING APPLICATIONS, BY REGION, 20212026 (USD MILLION)
TABLE 75 NORTH AMERICA: MARKET FOR CELL CULTURE & MIXING APPLICATIONS, BY COUNTRY, 20172020 (USD MILLION)
TABLE 76 NORTH AMERICA: MARKET FOR CELL CULTURE & MIXING APPLICATIONS, BY COUNTRY, 20212026 (USD MILLION)
TABLE 77 EUROPE: MARKET FOR CELL CULTURE & MIXING APPLICATIONS, BY COUNTRY, 20172020 (USD MILLION)
TABLE 78 EUROPE: MARKET FOR CELL CULTURE & MIXING APPLICATIONS, BY COUNTRY, 20212026 (USD MILLION)
TABLE 79 ASIA PACIFIC: MARKET FOR CELL CULTURE & MIXING APPLICATIONS, BY COUNTRY, 20172020 (USD MILLION)
TABLE 80 ASIA PACIFIC: MARKET FOR CELL CULTURE & MIXING APPLICATIONS, BY COUNTRY, 20212026 (USD MILLION)
8.4 STORAGE
8.4.1 BAG ASSEMBLIES AND BOTTLE ASSEMBLIES ARE WIDELY USED FOR STORAGE
TABLE 81 SINGLE-USE ASSEMBLIES MARKET FOR STORAGE APPLICATIONS, BY REGION, 20172020 (USD MILLION)
TABLE 82 MARKET FOR STORAGE APPLICATIONS, BY REGION, 20212026 (USD MILLION)
TABLE 83 NORTH AMERICA: MARKET FOR STORAGE APPLICATIONS, BY COUNTRY, 20172020 (USD MILLION)
TABLE 84 NORTH AMERICA: MARKET FOR STORAGE APPLICATIONS, BY COUNTRY, 20212026 (USD MILLION)
TABLE 85 EUROPE: MARKET FOR STORAGE APPLICATIONS, BY COUNTRY, 20172020 (USD MILLION)
TABLE 86 EUROPE: MARKET FOR STORAGE APPLICATIONS, BY COUNTRY, 20212026 (USD MILLION)
TABLE 87 ASIA PACIFIC: MARKET FOR STORAGE APPLICATIONS, BY COUNTRY, 20172020 (USD MILLION)
TABLE 88 ASIA PACIFIC: MARKET FOR STORAGE APPLICATIONS, BY COUNTRY, 20212026 (USD MILLION)
8.5 SAMPLING
8.5.1 STRICT GUIDELINES FOR DRUG SAFETY ARE SUPPORTING THE MARKET GROWTH FOR SAMPLING
TABLE 89 SINGLE-USE ASSEMBLIES MARKET FOR SAMPLING APPLICATIONS, BY REGION, 20172020 (USD MILLION)
TABLE 90 MARKET FOR SAMPLING APPLICATIONS, BY REGION, 20212026 (USD MILLION)
TABLE 91 NORTH AMERICA: MARKET FOR SAMPLING APPLICATIONS, BY COUNTRY, 20172020 (USD MILLION)
TABLE 92 NORTH AMERICA: MARKET FOR SAMPLING APPLICATIONS, BY COUNTRY, 20212026 (USD MILLION)
TABLE 93 EUROPE: MARKET FOR SAMPLING APPLICATIONS, BY COUNTRY, 20172020 (USD MILLION)
TABLE 94 EUROPE: MARKET FOR SAMPLING APPLICATIONS, BY COUNTRY, 20212026 (USD MILLION)
TABLE 95 ASIA PACIFIC: MARKET FOR SAMPLING APPLICATIONS, BY COUNTRY, 20172020 (USD MILLION)
TABLE 96 ASIA PACIFIC: MARKET FOR SAMPLING APPLICATIONS, BY COUNTRY, 20212026 (USD MILLION)
8.6 FILL-FINISH APPLICATIONS
8.6.1 REDUCED RISK OF CONTAMINATION DUE TO NEGLIGIBLE INVOLVEMENT OF OPERATORS HAS PROPELLED THE DEMAND FOR SINGLE-USE ASSEMBLIES IN FILL-FINISH APPLICATIONS
TABLE 97 SINGLE-USE ASSEMBLIES MARKET FOR FILL-FINISH APPLICATIONS, BY REGION, 20172020 (USD MILLION)
TABLE 98 MARKET FOR FILL-FINISH APPLICATIONS, BY REGION, 20212026 (USD MILLION)
TABLE 99 NORTH AMERICA: MARKET FOR FILL-FINISH APPLICATIONS, BY COUNTRY, 20172020 (USD MILLION)
TABLE 100 NORTH AMERICA: MARKET FOR FILL-FINISH APPLICATIONS, BY COUNTRY, 20212026 (USD MILLION)
TABLE 101 EUROPE: MARKET FOR FILL-FINISH APPLICATIONS, BY COUNTRY, 20172020 (USD MILLION)
TABLE 102 EUROPE: MARKET FOR FILL-FINISH APPLICATIONS, BY COUNTRY, 20212026 (USD MILLION)
TABLE 103 ASIA PACIFIC: MARKET FOR FILL-FINISH APPLICATIONS, BY COUNTRY, 20172020 (USD MILLION)
TABLE 104 ASIA PACIFIC: MARKET FOR FILL-FINISH APPLICATIONS, BY COUNTRY, 20212026 (USD MILLION)
8.7 OTHER APPLICATIONS
TABLE 105 SINGLE-USE ASSEMBLIES MARKET FOR OTHER APPLICATIONS, BY REGION, 20172020 (USD MILLION)
TABLE 106 MARKET FOR OTHER APPLICATIONS, BY REGION, 20212026 (USD MILLION)
TABLE 107 NORTH AMERICA: MARKET FOR OTHER APPLICATIONS, BY COUNTRY, 20172020 (USD MILLION)
TABLE 108 NORTH AMERICA: MARKET FOR OTHER APPLICATIONS, BY COUNTRY, 20212026 (USD MILLION)
TABLE 109 EUROPE: MARKET FOR OTHER APPLICATIONS, BY COUNTRY, 20172020 (USD MILLION)
TABLE 110 EUROPE: MARKET FOR OTHER APPLICATIONS, BY COUNTRY, 20212026 (USD MILLION)
TABLE 111 ASIA PACIFIC: MARKET FOR OTHER APPLICATIONS, BY COUNTRY, 20172020 (USD MILLION)
TABLE 112 ASIA PACIFIC: MARKET FOR OTHER APPLICATIONS, BY COUNTRY, 20212026 (USD MILLION)
9 SINGLE-USE ASSEMBLIES MARKET, BY END USER (Page No. - 117)
9.1 INTRODUCTION
TABLE 113 MARKET, BY END USER, 20172020 (USD MILLION)
TABLE 114 MARKET, BY END USER, 20212026 (USD MILLION)
9.2 BIOPHARMACEUTICAL & PHARMACEUTICAL COMPANIES
9.2.1 INCREASE IN BIOLOGICS PRODUCTION IS DRIVING THE DEMAND FOR SINGLE-USE ASSEMBLIES
TABLE 115 FDA-APPROVED DRUGS, 2018
TABLE 116 SINGLE-USE ASSEMBLIES MARKET FOR BIOPHARMACEUTICAL & PHARMACEUTICAL COMPANIES, BY REGION, 20172020 (USD MILLION)
TABLE 117 MARKET FOR BIOPHARMACEUTICAL & PHARMACEUTICAL COMPANIES, BY REGION, 20212026 (USD MILLION)
TABLE 118 NORTH AMERICA: MARKET FOR BIOPHARMACEUTICAL & PHARMACEUTICAL COMPANIES, BY COUNTRY, 20172020 (USD MILLION)
TABLE 119 NORTH AMERICA: MARKET FOR BIOPHARMACEUTICAL & PHARMACEUTICAL COMPANIES, BY COUNTRY, 20212026 (USD MILLION)
TABLE 120 EUROPE: MARKET FOR BIOPHARMACEUTICAL & PHARMACEUTICAL COMPANIES, BY COUNTRY, 20172020 (USD MILLION)
TABLE 121 EUROPE: MARKET FOR BIOPHARMACEUTICAL & PHARMACEUTICAL COMPANIES, BY COUNTRY, 20212026 (USD MILLION)
TABLE 122 ASIA PACIFIC: MARKET FOR BIOPHARMACEUTICAL & PHARMACEUTICAL COMPANIES, BY COUNTRY, 20172020 (USD MILLION)
TABLE 123 ASIA PACIFIC: MARKET FOR BIOPHARMACEUTICAL & PHARMACEUTICAL COMPANIES, BY COUNTRY, 20212026 (USD MILLION)
9.3 CONTRACT RESEARCH ORGANIZATIONS & CONTRACT MANUFACTURING ORGANIZATIONS
9.3.1 INCREASING OUTSOURCING OF R&D SERVICES BY PHARMACEUTICAL & BIOPHARMACEUTICAL COMPANIES TO SUPPORT MARKET GROWTH
TABLE 124 SINGLE-USE ASSEMBLIES MARKET FOR CROS & CMOS, BY REGION, 20172020 (USD MILLION)
TABLE 125 MARKET FOR CROS & CMOS, BY REGION, 20212026 (USD MILLION)
TABLE 126 NORTH AMERICA: MARKET FOR CROS & CMOS, BY COUNTRY, 20172020 (USD MILLION)
TABLE 127 NORTH AMERICA: MARKET FOR CROS & CMOS, BY COUNTRY, 20212026 (USD MILLION)
TABLE 128 EUROPE: MARKET FOR CROS & CMOS, BY COUNTRY, 20172020 (USD MILLION)
TABLE 129 EUROPE: MARKET FOR CROS & CMOS, BY COUNTRY, 20212026 (USD MILLION)
TABLE 130 ASIA PACIFIC: MARKET FOR CROS & CMOS, BY COUNTRY, 20172020 (USD MILLION)
TABLE 131 ASIA PACIFIC: MARKET FOR CROS & CMOS, BY COUNTRY, 20212026 (USD MILLION)
9.4 ACADEMIC & RESEARCH INSTITUTES
9.4.1 GROWING PHARMA-ACADEMIA COLLABORATIONS WILL DRIVE THE UPTAKE OF SINGLE-USE ASSEMBLIES IN ACADEMIC & RESEARCH INSTITUTES
TABLE 132 SINGLE-USE ASSEMBLIES MARKET FOR ACADEMIC & RESEARCH INSTITUTES, BY REGION, 20172020 (USD MILLION)
TABLE 133 MARKET FOR ACADEMIC & RESEARCH INSTITUTES, BY REGION, 20212026 (USD MILLION)
TABLE 134 NORTH AMERICA: MARKET FOR ACADEMIC & RESEARCH INSTITUTES, BY COUNTRY, 20172020 (USD MILLION)
TABLE 135 NORTH AMERICA: MARKET FOR ACADEMIC & RESEARCH INSTITUTES, BY COUNTRY, 20212026 (USD MILLION)
TABLE 136 EUROPE: MARKET FOR ACADEMIC & RESEARCH INSTITUTES, BY COUNTRY, 20172020 (USD MILLION)
TABLE 137 EUROPE: MARKET FOR ACADEMIC & RESEARCH INSTITUTES, BY COUNTRY, 20212026 (USD MILLION)
TABLE 138 ASIA PACIFIC: MARKET FOR ACADEMIC & RESEARCH INSTITUTES, BY COUNTRY, 20172020 (USD MILLION)
TABLE 139 ASIA PACIFIC: MARKET FOR ACADEMIC & RESEARCH INSTITUTES, BY COUNTRY, 20212026 (USD MILLION)
10 SINGLE-USE ASSEMBLIES MARKET, BY REGION (Page No. - 131)
10.1 INTRODUCTION
TABLE 140 MARKET, BY REGION, 20172020 (USD MILLION)
TABLE 141 MARKET, BY REGION, 20212026 (USD MILLION)
10.2 NORTH AMERICA
FIGURE 18 NORTH AMERICA: SINGLE-USE ASSEMBLIES MARKET SNAPSHOT
TABLE 142 NORTH AMERICA: MARKET, BY COUNTRY, 20172020 (USD MILLION)
TABLE 143 NORTH AMERICA: MARKET, BY COUNTRY, 20212026 (USD MILLION)
TABLE 144 NORTH AMERICA: MARKET, BY PRODUCT, 20172020 (USD MILLION)
TABLE 145 NORTH AMERICA: MARKET, BY PRODUCT, 20212026 (USD MILLION)
TABLE 146 NORTH AMERICA: MARKET, BY SOLUTION, 20172020 (USD MILLION)
TABLE 147 NORTH AMERICA: MARKET, BY SOLUTION, 20212026 (USD MILLION)
TABLE 148 NORTH AMERICA: MARKET, BY APPLICATION, 20172020 (USD MILLION)
TABLE 149 NORTH AMERICA: MARKET, BY APPLICATION, 20212026 (USD MILLION)
TABLE 150 NORTH AMERICA: MARKET, BY END USER, 20172020 (USD MILLION)
TABLE 151 NORTH AMERICA: MARKET, BY END USER, 20212026 (USD MILLION)
10.2.1 US
10.2.1.1 The US dominates the North American single-use assemblies market
TABLE 152 US: MARKET, BY PRODUCT, 20172020 (USD MILLION)
TABLE 153 US: MARKET, BY PRODUCT, 20212026 (USD MILLION)
TABLE 154 US: MARKET, BY SOLUTION, 20172020 (USD MILLION)
TABLE 155 US: MARKET, BY SOLUTION, 20212026 (USD MILLION)
TABLE 156 US: MARKET, BY APPLICATION, 20172020 (USD MILLION)
TABLE 157 US: MARKET, BY APPLICATION, 20212026 (USD MILLION)
TABLE 158 US: MARKET, BY END USER, 20172020 (USD MILLION)
TABLE 159 US: MARKET, BY END USER, 20212026 (USD MILLION)
10.2.2 CANADA
10.2.2.1 Increasing demand for biopharmaceuticals is supporting the growth of the single-use assemblies market in Canada
TABLE 160 CANADA: MARKET, BY PRODUCT, 20172020 (USD MILLION)
TABLE 161 CANADA: MARKET, BY PRODUCT, 20212026 (USD MILLION)
TABLE 162 CANADA: MARKET, BY SOLUTION, 20172020 (USD MILLION)
TABLE 163 CANADA: MARKET, BY SOLUTION, 20212026 (USD MILLION)
TABLE 164 CANADA: MARKET, BY APPLICATION, 20172020 (USD MILLION)
TABLE 165 CANADA: MARKET, BY APPLICATION, 20212026 (USD MILLION)
TABLE 166 CANADA: MARKET, BY END USER, 20172020 (USD MILLION)
TABLE 167 CANADA: MARKET, BY END USER, 20212026 (USD MILLION)
10.3 EUROPE
TABLE 168 EUROPE: SINGLE-USE ASSEMBLIES MARKET, BY COUNTRY, 20172020 (USD MILLION)
TABLE 169 EUROPE: MARKET, BY COUNTRY, 20212026 (USD MILLION)
TABLE 170 EUROPE: MARKET, BY PRODUCT, 20172020 (USD MILLION)
TABLE 171 EUROPE: MARKET, BY PRODUCT, 20212026 (USD MILLION)
TABLE 172 EUROPE: MARKET, BY SOLUTION, 20172020 (USD MILLION)
TABLE 173 EUROPE: MARKET, BY SOLUTION, 20212026 (USD MILLION)
TABLE 174 EUROPE: MARKET, BY APPLICATION, 20172020 (USD MILLION)
TABLE 175 EUROPE: MARKET, BY APPLICATION, 20212026 (USD MILLION)
TABLE 176 EUROPE: MARKET, BY END USER, 20172020 (USD MILLION)
TABLE 177 EUROPE: MARKET, BY END USER, 20212026 (USD MILLION)
10.3.1 GERMANY
10.3.1.1 Increase in biopharmaceutical sales is expected to support market growth
TABLE 178 GERMANY: SINGLE-USE ASSEMBLIES MARKET, BY PRODUCT, 20172020 (USD MILLION)
TABLE 179 GERMANY: MARKET, BY PRODUCT, 20212026 (USD MILLION)
TABLE 180 GERMANY: MARKET, BY SOLUTION, 20172020 (USD MILLION)
TABLE 181 GERMANY: MARKET, BY SOLUTION, 20212026 (USD MILLION)
TABLE 182 GERMANY: MARKET, BY APPLICATION, 20172020 (USD MILLION)
TABLE 183 GERMANY: MARKET, BY APPLICATION, 20212026 (USD MILLION)
TABLE 184 GERMANY: MARKET, BY END USER, 20172020 (USD MILLION)
TABLE 185 GERMANY: MARKET, BY END USER, 20212026 (USD MILLION)
10.3.2 UK
10.3.2.1 New drug developments to propel the demand for single-use assemblies in the UK
TABLE 186 UK: SINGLE-USE ASSEMBLIES MARKET, BY PRODUCT, 20172020 (USD MILLION)
TABLE 187 UK: MARKET, BY PRODUCT, 20212026 (USD MILLION)
TABLE 188 UK: MARKET, BY SOLUTION, 20172020 (USD MILLION)
TABLE 189 UK: MARKET, BY SOLUTION, 20212026 (USD MILLION)
TABLE 190 UK: MARKET, BY APPLICATION, 20172020 (USD MILLION)
TABLE 191 UK: MARKET, BY APPLICATION, 20212026 (USD MILLION)
TABLE 192 UK: MARKET, BY END USER, 20172020 (USD MILLION)
TABLE 193 UK: MARKET, BY END USER, 20212026 (USD MILLION)
10.3.3 FRANCE
10.3.3.1 Increase in biopharmaceutical manufacturing to drive the demand for single-use assemblies in France
TABLE 194 FRANCE: SINGLE-USE ASSEMBLIES MARKET, BY PRODUCT, 20172020 (USD MILLION)
TABLE 195 FRANCE: MARKET, BY PRODUCT, 20212026 (USD MILLION)
TABLE 196 FRANCE: MARKET, BY SOLUTION, 20172020 (USD MILLION)
TABLE 197 FRANCE: MARKET, BY SOLUTION, 20212026 (USD MILLION)
TABLE 198 FRANCE: MARKET, BY APPLICATION, 20172020 (USD MILLION)
TABLE 199 FRANCE: MARKET, BY APPLICATION, 20212026 (USD MILLION)
TABLE 200 FRANCE: MARKET, BY END USER, 20172020 (USD MILLION)
TABLE 201 FRANCE: MARKET, BY END USER, 20212026 (USD MILLION)
10.3.4 REST OF EUROPE
TABLE 202 ROE: SINGLE-USE ASSEMBLIES MARKET, BY PRODUCT, 20172020 (USD MILLION)
TABLE 203 ROE: MARKET, BY PRODUCT, 20212026 (USD MILLION)
TABLE 204 ROE: MARKET, BY SOLUTION, 20172020 (USD MILLION)
TABLE 205 ROE: MARKET, BY SOLUTION, 20212026 (USD MILLION)
TABLE 206 ROE: MARKET, BY APPLICATION, 20172020 (USD MILLION)
TABLE 207 ROE: MARKET, BY APPLICATION, 20212026 (USD MILLION)
TABLE 208 ROE: MARKET, BY END USER, 20172020 (USD MILLION)
TABLE 209 ROE: MARKET, BY END USER, 20212026 (USD MILLION)
10.4 ASIA PACIFIC
FIGURE 19 ASIA PACIFIC: SINGLE-USE ASSEMBLIES MARKET SNAPSHOT
TABLE 210 ASIA PACIFIC: MARKET, BY COUNTRY, 20172020 (USD MILLION)
TABLE 211 ASIA PACIFIC: MARKET, BY COUNTRY, 20212026 (USD MILLION)
TABLE 212 ASIA PACIFIC: MARKET, BY PRODUCT, 20172020 (USD MILLION)
TABLE 213 ASIA PACIFIC: MARKET, BY PRODUCT, 20212026 (USD MILLION)
TABLE 214 ASIA PACIFIC: MARKET, BY SOLUTION, 20172020 (USD MILLION)
TABLE 215 ASIA PACIFIC: MARKET, BY SOLUTION, 20212026 (USD MILLION)
TABLE 216 ASIA PACIFIC: MARKET, BY APPLICATION, 20172020 (USD MILLION)
TABLE 217 ASIA PACIFIC: MARKET, BY APPLICATION, 20212026 (USD MILLION)
TABLE 218 ASIA PACIFIC: MARKET, BY END USER, 20172020 (USD MILLION)
TABLE 219 ASIA PACIFIC: MARKET, BY END USER, 20212026 (USD MILLION)
10.4.1 CHINA
10.4.1.1 China will continue to dominate the Asia Pacific single-use assemblies during the forecast period
TABLE 220 CHINA: SINGLE-USE ASSEMBLIES MARKET, BY PRODUCT, 20172020 (USD MILLION)
TABLE 221 CHINA: MARKET, BY PRODUCT, 20212026 (USD MILLION)
TABLE 222 CHINA: MARKET, BY SOLUTION, 20172020 (USD MILLION)
TABLE 223 CHINA: MARKET, BY SOLUTION, 20212026 (USD MILLION)
TABLE 224 CHINA: MARKET, BY APPLICATION, 20172020 (USD MILLION)
TABLE 225 CHINA: MARKET, BY APPLICATION, 20212026 (USD MILLION)
TABLE 226 CHINA: MARKET, BY END USER, 20172020 (USD MILLION)
TABLE 227 CHINA: MARKET, BY END USER, 20212026 (USD MILLION)
10.4.2 SOUTH KOREA
10.4.2.1 Government investments form a key contributor to market growth in South Korea
TABLE 228 KOREAN BIOPHARMACEUTICAL MARKET (USD HUNDRED THOUSAND)
TABLE 229 SOUTH KOREA: SINGLE-USE ASSEMBLIES MARKET, BY PRODUCT, 20172020 (USD MILLION)
TABLE 230 SOUTH KOREA: MARKET, BY PRODUCT, 20212026 (USD MILLION)
TABLE 231 SOUTH KOREA: MARKET, BY SOLUTION, 20172020 (USD MILLION)
TABLE 232 SOUTH KOREA: MARKET, BY SOLUTION, 20212026 (USD MILLION)
TABLE 233 SOUTH KOREA: MARKET, BY APPLICATION, 20172020 (USD MILLION)
TABLE 234 SOUTH KOREA: MARKET, BY APPLICATION, 20212026 (USD MILLION)
TABLE 235 SOUTH KOREA: MARKET, BY END USER, 20172020 (USD MILLION)
TABLE 236 SOUTH KOREA: MARKET, BY END USER, 20212026 (USD MILLION)
10.4.3 JAPAN
10.4.3.1 Expansion of biopharmaceutical manufacturing plants in Japan has created growth opportunities for single-use assembly manufacturers
TABLE 237 JAPAN: SINGLE-USE ASSEMBLIES MARKET, BY PRODUCT, 20172020 (USD MILLION)
TABLE 238 JAPAN: MARKET, BY PRODUCT, 20212026 (USD MILLION)
TABLE 239 JAPAN: MARKET, BY SOLUTION, 20172020 (USD MILLION)
TABLE 240 JAPAN: MARKET, BY SOLUTION, 20212026 (USD MILLION)
TABLE 241 JAPAN: MARKET, BY APPLICATION, 20172020 (USD MILLION)
TABLE 242 JAPAN: MARKET, BY APPLICATION, 20212026 (USD MILLION)
TABLE 243 JAPAN: MARKET, BY END USER, 20172020 (USD MILLION)
TABLE 244 JAPAN: MARKET, BY END USER, 20212026 (USD MILLION)
10.4.4 INDIA
10.4.4.1 COVID-19 vaccines production created significant demand for single-use assemblies
TABLE 245 INDIA: SINGLE-USE ASSEMBLIES MARKET, BY PRODUCT, 20172020 (USD MILLION)
TABLE 246 INDIA: MARKET, BY PRODUCT, 20212026 (USD MILLION)
TABLE 247 INDIA: MARKET, BY SOLUTION, 20172020 (USD MILLION)
TABLE 248 INDIA: MARKET, BY SOLUTION, 20212026 (USD MILLION)
TABLE 249 INDIA: MARKET, BY APPLICATION, 20172020 (USD MILLION)
TABLE 250 INDIA: MARKET, BY APPLICATION, 20212026 (USD MILLION)
TABLE 251 INDIA: MARKET, BY END USER, 20172020 (USD MILLION)
TABLE 252 INDIA: MARKET, BY END USER, 20212026 (USD MILLION)
10.4.5 ROAPAC
TABLE 253 ROAPAC: SINGLE-USE ASSEMBLIES MARKET, BY PRODUCT, 20172020 (USD MILLION)
TABLE 254 ROAPAC: MARKET, BY PRODUCT, 20212026 (USD MILLION)
TABLE 255 ROAPAC: MARKET, BY SOLUTION, 20172020 (USD MILLION)
TABLE 256 ROAPAC: MARKET, BY SOLUTION, 20212026 (USD MILLION)
TABLE 257 ROAPAC: MARKET, BY APPLICATION, 20172020 (USD MILLION)
TABLE 258 ROAPAC: MARKET, BY APPLICATION, 20212026 (USD MILLION)
TABLE 259 ROAPAC: MARKET, BY END USER, 20172020 (USD MILLION)
TABLE 260 ROAPAC: MARKET, BY END USER, 20212026 (USD MILLION)
10.5 REST OF THE WORLD
TABLE 261 ROW: SINGLE-USE ASSEMBLIES MARKET, BY PRODUCT, 20172020 (USD MILLION)
TABLE 262 ROW: MARKET, BY PRODUCT, 20212026 (USD MILLION)
TABLE 263 ROW: MARKET, BY SOLUTION, 20172020 (USD MILLION)
TABLE 264 ROW: MARKET, BY SOLUTION, 20212026 (USD MILLION)
TABLE 265 ROW: MARKET, BY APPLICATION, 20172020 (USD MILLION)
TABLE 266 ROW: MARKET, BY APPLICATION, 20212026 (USD MILLION)
TABLE 267 ROW: MARKET, BY END USER, 20172020 (USD MILLION)
TABLE 268 ROW: MARKET, BY END USER, 20212026 (USD MILLION)
11 COMPETITIVE LANDSCAPE (Page No. - 191)
11.1 INTRODUCTION
11.2 MARKET RANKING ANALYSIS, 2020
FIGURE 20 RANK OF COMPANIES IN THE SINGLE-USE ASSEMBLIES MARKET, 2020
11.3 COMPETITIVE SCENARIO
11.3.1 KEY PRODUCT LAUNCHES
11.3.2 KEY ACQUISITIONS
11.3.3 KEY PARTNERSHIPS, AGREEMENTS, & COLLABORATIONS
11.3.4 KEY EXPANSIONS
11.4 COMPETITIVE LEADERSHIP MAPPING
11.4.1 STARS
11.4.2 EMERGING LEADERS
11.4.3 PERVASIVE PLAYERS
11.4.4 EMERGING COMPANIES
FIGURE 21 COMPETITIVE LEADERSHIP MAPPING, 2020
12 COMPANY PROFILES (Page No. - 196)
12.1 KEY COMPANIES
(Business overview, Products offered, Recent developments, MNM view)*
12.1.1 THERMO FISHER SCIENTIFIC
FIGURE 22 THERMO FISHER SCIENTIFIC: COMPANY SNAPSHOT (2020)
12.1.2 SARTORIUS STEDIM BIOTECH
FIGURE 23 SARTORIUS STEDIM BIOTECH: COMPANY SNAPSHOT (2020)
12.1.3 DANAHER CORPORATION
FIGURE 24 DANAHER CORPORATION: COMPANY SNAPSHOT (2020)
12.1.4 MERCK KGAA
FIGURE 25 MERCK: COMPANY SNAPSHOT (2020)
12.1.5 AVANTOR
FIGURE 26 AVANTOR: COMPANY SNAPSHOT (2020)
12.1.6 PARKER-HANNIFIN CORPORATION
FIGURE 27 PARKER-HANNIFIN CORPORATION: COMPANY SNAPSHOT (2020)
12.1.7 SAINT-GOBAIN
FIGURE 28 SAINT-GOBAIN: COMPANY SNAPSHOT (2020)
12.1.8 REPLIGEN CORPORATION
FIGURE 29 REPLIGEN CORPORATION: COMPANY SNAPSHOT (2020)
12.1.9 CORNING INCORPORATED
FIGURE 30 CORNING INCORPORATED: COMPANY SNAPSHOT (2020)
12.1.10 ENTEGRIS
FIGURE 31 ENTEGRIS: COMPANY SNAPSHOT (2020)
12.1.11 MEISSNER FILTRATION PRODUCTS
12.1.12 NEWAGE INDUSTRIES
12.1.13 ANTYLIA SCIENTIFIC
12.2 OTHER PLAYERS
12.2.1 LONZA
FIGURE 32 LONZA: COMPANY SNAPSHOT (2020)
12.2.2 ROMYNOX
12.2.3 FLEXBIOSYS
12.2.4 KEOFITT A/S
12.2.5 INTELLITECH
12.2.6 DOVER CORPORATION
12.2.7 FOXX LIFE SCIENCES
12.2.8 TSE INDUSTRIES, INC.
12.2.9 FUJIMORI KOGYO CO., LTD.
12.2.10 MICHELIN GROUP
12.2.11 CELLEXUS INTERNATIONAL LTD.
12.2.12 FLUID FLOW PRODUCTS, INC.
*Business overview, Products offered, Recent developments, MNM view might not be captured in case of unlisted companies.
13 ADJACENT/RELATED MARKETS (Page No. - 235)
13.1 INTRODUCTION
13.2 LIMITATIONS
13.3 SINGLE-USE BIOREACTORS MARKET
13.3.1 MARKET DEFINITION
13.3.2 MARKET OVERVIEW
13.3.3 SINGLE-USE BIOREACTORS MARKET, BY REGION
TABLE 269 SINGLE-USE BIOREACTORS MARKET, BY REGION, 20182025 (USD MILLION)
13.3.3.1 North America
TABLE 270 NORTH AMERICA: SINGLE-USE BIOREACTORS MARKET, BY COUNTRY, 20182025 (USD MILLION)
13.3.3.2 Europe
TABLE 271 EUROPE: SINGLE-USE BIOREACTORS MARKET, BY COUNTRY, 20182025 (USD MILLION)
13.3.3.3 Asia Pacific
TABLE 272 ASIA PACIFIC: MEDICAL CERAMICS MARKET, BY COUNTRY, 20182025 (USD MILLION)
13.4 ASEPTIC SAMPLING MARKET
13.4.1 MARKET DEFINITION
13.4.2 MARKET OVERVIEW
13.4.3 ASEPTIC SAMPLING MARKET, BY REGION
TABLE 273 ASEPTIC SAMPLING MARKET, BY REGION, 20182025 (USD MILLION)
13.4.3.1 North America
TABLE 274 NORTH AMERICA: ASEPTIC SAMPLING MARKET, BY COUNTRY, 20182025 (USD MILLION)
13.4.3.2 Europe
TABLE 275 EUROPE: ASEPTIC SAMPLING MARKET, BY COUNTRY, 20182025 (USD MILLION)
13.4.3.3 Asia Pacific
TABLE 276 ASIA PACIFIC: ASEPTIC SAMPLING MARKET, BY COUNTRY, 20182025 (USD MILLION)
14 APPENDIX (Page No. - 241)
14.1 DISCUSSION GUIDE
14.2 KNOWLEDGE STORE: MARKETSANDMARKETS SUBSCRIPTION PORTAL
14.3 AVAILABLE CUSTOMIZATIONS
14.4 RELATED REPORTS
14.5 AUTHOR DETAILS
This market research study involves the extensive use of secondary sources, directories, and databases to identify and collect information useful for this technical, market-oriented, and financial study of the global single-use assemblies market. In-depth interviews were conducted with various primary respondents, including key industry participants, subject-matter experts (SMEs), C-level executives of key market players, and industry consultants, among other experts, to obtain and verify critical qualitative and quantitative information and to assess market prospects.
The secondary sources referred to for this research study included publications from government sources such as World Health Organization (WHO), National Institutes of Health (NIH), National Institute for Bioprocessing Research and Training (NIBRT), Society for Biological Engineering (SBE), Canadian Cancer Statistics (CCS), Germany Trade and Invest (GTAI), Bio-Process Systems Alliance (BPSA), European Patent Office (EPO), Pharmaceuticals Export Promotion Council of India (Pharmexcil), India Brand Equity Foundation (IBEF), Biotechnology Innovation Organization (BIO), National Center for Biotechnology Information (NCBI), World Bank, US Food and Drug Administration (US FDA), US Census Bureau, Eurostat, Statistics Canada and Factiva.
Secondary sources also include corporate and regulatory filings (such as annual reports, SEC filings, investor presentations, and financial statements); business magazines and research journals; press releases; and trade, business, and professional associations, among others. Secondary data was collected and analyzed to arrive at the overall size of the global single-use assemblies market, which was validated through primary research.
Extensive primary research was conducted after acquiring basic knowledge about the global single-use assemblies market scenario through secondary research. Several primary interviews were conducted with market experts from both the demand side (such as research personnel in laboratories, academic & research institutes, purchase managers in biotechnology & pharmaceutical companies, and healthcare organizations) and the supply side (such as product manufacturers, wholesalers, channel partners, and distributors) across four major regions-North America, Europe, Asia Pacific, and the Rest of the World. Approximately 33% and 67% of primary interviews were conducted with the demand- and supply-side participants, respectively. This primary data was collected through questionnaires, e-mails, online surveys, personal interviews, and telephonic interviews.
To know about the assumptions considered for the study, download the pdf brochure
After arriving at the overall size of the global single-use assemblies market through the above-mentioned methodology, this market was split into several segments and subsegments. Data triangulation and market breakdown procedures were employed, wherever applicable, to complete the overall market engineering process and arrive at the exact market value data for the key segments and subsegments. The extrapolated market data was triangulated by studying various macroindicators and regional trends from both the demand- and supply-side participants
With the given market data, MarketsandMarkets offers customizations as per your companys specific needs. The following customization option is available for the report:
Growth opportunities and latent adjacency in Single-use Assemblies Market
What are the key industry insights, current and future perspectives?
What are the growth opportunities and industry-specific challenges in Single-use Assemblies Market?
What are the new growth opportunities in industry segments related to Single-use Assemblies Market?