Small Hydropower Market by Capacity (Up to 1 MW, 1�10 MW), Type (Micro Hydropower, Mini Hydropower), Components (Electromechanical Equipment, Electric infrastructure, Civil Works), and Region - Global Forecast to 2024


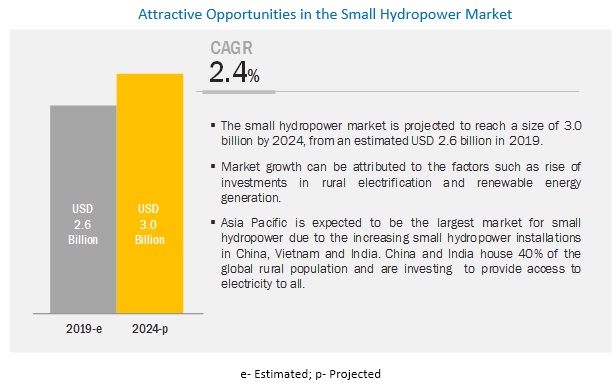
[166 Pages Report] The global small hydropower market is expected to grow from an estimated USD 2.6 billion in 2019 to USD 3.0 billion by 2024, at a CAGR of 2.4% during the forecast period. The factors driving the market include the application of small hydropower projects for rural electrification, financial incentives, and policy initiatives, and investments in hydropower projects in response to climate change.
The 1�10 MW segment is expected to be the largest market during the forecast period
The small hydropower market, by capacity, is segmented into Up to 1 MW and 1�10 MW. The 1�10 MW segment is projected to be the most abundant small hydropower, by capacity, market during the forecast period. This higher share of 1�10 MW plants can be attributed to the small-scale decentralized projects being deployed in developing nations, especially in Asia Pacific, for rural electrification. Asia Pacific dominated the 1�10 MW segment of the small hydropower. China, Vietnam, and India account for the significant share of the small hydropower installations in this region. The demand for small hydropower is driven by increasing investments for rural electrification in these countries.
The Mini Hydropower segment is expected to be the most significant contributor to the Small hydropower market, by type, during the forecast period
The small hydropower, by type, is segmented into Mini Hydropower, and Micro Hydropower segments. The Mini hydropower segment is expected to lead the market during the forecast period. Installations in the mini-hydropower segment are largely driven rural electrification. China led the way in installing small hydropower plants for rural electrification. In developed countries such as the US and Norway, the installations are to increase the renewable energy share in the nation�s energy mix.
The civil works segment is expected to hold the largest share of the small hydropower market during the forecast period
The small hydropower, by component, is segmented into electromechanical equipment, electric infrastructure, civil works, and others, which includes engineering, structural, management, environmental mitigation, and project development. The public works segment is expected to be the largest segment during the forecast period. Civil works account for the significant share of project costs in all small hydropower projects. To properly guide the water on to turbines and to increase the water head, civil structures such as weirs are constructed. These simple public structures are cheaper than those in large hydropower plants, but they constitute a large share of the total project cost in small hydropower plants.
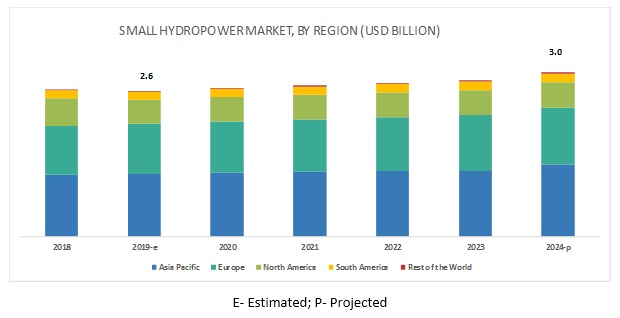
Asia Pacific is expected to be the largest small hydropower market during the forecast period
In this report, the small hydropower market has been analyzed concerning 5 regions, namely, Asia Pacific, North America, Europe, South America, and the Rest of the World. The Asia Pacific is estimated to be the largest market from the global market from 2019 to 2024. China, Vietnam, and India are the world�s fastest-growing economies, contributing mainly to the Asia Pacific market. The Asia Pacific market is expected to grow during the forecast period owing to the investments in rural electrification and off-grid energy generation.
Key Market Players
The major players in the global small hydropower market, such as Voith(Germany), ANDRITZ(Austria), GE Renewable Energy(France), Toshiba(Japan), Siemens(Germany), BHEL(India), Gilbert Gilkes & Gordon(UK), and Flovel(India).
Voith (Germany) is a critical player in this market. The company�s recent Investments & Expansions as part of its organic business strategy is expected to increase its clientele base globally. Voith has recently opened subsidiaries in East Africa and Australia to aid further growth in these regions. In September 2019, the company opened its sales office in Nepal. In June 2019, the company opened a new production facility in Russia to manufacture and supply products for large and small hydropower.
ANDRITZ (Austria) is another major player in the small hydropower. As part of its inorganic growth strategy, the company has acquired HMI Canada, a company with expertise in repair and modernization of hydropower plants. ANDRITZ won contracts and successfully delivered complete water-to-wire package or key components for several small hydropower projects such as Nkula A, Assiut barrage. The company recently won a contract to supply key elements for three small hydropower plants in Nepal.
Scope of the Report
|
Report Metric |
Details |
|
Market size available for years |
2017�2024 |
|
Base year considered |
2018 |
|
Forecast period |
2019�2024 |
|
Forecast units |
Value (USD) |
|
Segments covered |
capacity, type, component, and region |
|
Geographies covered |
Asia Pacific, North America, Europe, South America, and Rest of the World |
|
Companies covered |
Voith (Germany), ANDRITZ (Austria), GE Renewable Energy (France), Siemens (Germany), Toshiba (Japan), BHEL (India), SNC-Lavalin (Canada), HNAC Technology (China), Gilbert Gilkes & Gordon Ltd(UK), Mavel (Czech Republic), HM Hydro (Japan), Ganz EEM (Hungary), Kolektor Turboinstitut (Slovenia), Canyon Hydro (US), CKD Blansko (Czech Republic), Canadian Hydro Components(Canada), ATB Riva Calzoni (Italy), Flovel (India), B Fouress (India), and Global Hydro(Austria). |
This research report categorizes the market by capacity, type, component, and region.
By Capacity:
- Up to 1 MW
- 1�10 MW
By Type:
- Micro Hydropower
- Mini Hydropower
By Component:
- Electromechanical Equipment
- Turbine
- Generator
- Other Equipment (includes inlet valves gates, penstock, governors, and auxiliaries)
- Electric Infrastructure
- Civil Works
- Others ( includes engineering, structural, management, environmental mitigation, and project development)
By region:
- Asia Pacific
- North America
- Europe
- South America
- Rest of the World
Recent Developments
- In September 2019, Voith Hydro opened its branch office in Kathmandu, Nepal. Voith Hydro, which had been supplying hydropower equipment to Nepal since 1968, undertook this expansion to build its customer base and provide quality service.
- In June 2019, Voith�s subsidiary in Russia, VolgaHydro opened a new production plant in Balakovo, Russia. Through this new investment, Voith would carry out activities that include maintenance services and supplying equipment to large and small hydropower plants.
- In July 2019, GE Renewable Energy started offering modular turbines for micro hydro power, following its recent partnership with Energy. The micro hydropower units were made available in 10 kW and 15 kW sizes and could be combined to offer solutions up to 1 MW.
Frequently Asked Questions (FAQ):
Which revolutionary technology trends are expected over the next five years?
Major technological trends that are expected to drive the small hydropower market are decentralized energy generation and development of new low head turbines.
Which elements of the small hydropower market are expected to lead by 2024?
Electromechanical equipment and civil works are two key project components in the small hydropower project development. With the increased small hydropower installations, the market for electromechanical components is expected to rise.
Which type of small hydropower is likely to get the maximum opportunity to grow during the forecast period?
Mini hydropower is expected to lead the small hydropower market. Mini hydropower installations are driven mainly by rural electrification.
Which region is expected to lead with the highest market share by 2024?
Asia Pacific, followed by Europe, is expected to lead the market with the highest shares by 2024.
How are companies implementing organic and inorganic strategies to gain an increase in the market share?
Companies in the small hydropower market are implementing organic growth strategies in the form of contracts & agreements.
To speak to our analyst for a discussion on the above findings, click Speak to Analyst
 Exclusive indicates content/data unique to MarketsandMarkets and not available with any competitors.
Table of Contents
1 Introduction (Page No. - 19)
1.1 Objectives of the Study
1.2 Definition
1.2.1 Small Hydropower Market Definition
1.3 Market Scope
1.3.1 Markets Covered
1.3.2 Regional Scope
1.3.3 Years Considered for the Study
1.4 Currency
1.5 Limitations
1.6 Stakeholders
2 Research Methodology (Page No. - 24)
2.1 Research Data
2.1.1 Secondary Data
2.1.1.1 Key Data From Secondary Sources
2.1.2 Primary Data
2.1.2.1 Key Data From Primary Sources
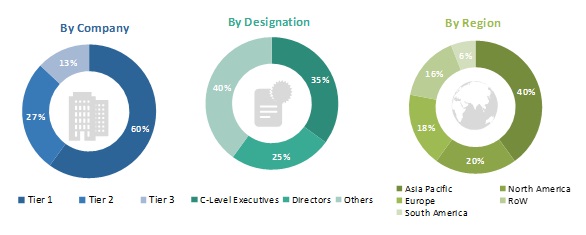
2.1.2.2 Breakdown of Primaries
2.2 Scope
2.3 Market Size Estimation
2.3.1 Demand-Side Analysis
2.3.1.1 Calculation
2.3.1.2 Assumptions
2.3.2 Supply-Side Analysis
2.3.2.1 Assumptions
2.3.2.2 Calculation
2.3.3 Forecast
2.4 Data Triangulation
2.5 Primary Insights
3 Executive Summary (Page No. - 34)
4 Premium Insights (Page No. - 38)
4.1 Attractive Opportunities in the Small Hydropower Market
4.2 Market, By Capacity
4.3 Market, By Type
4.4 Market, By Component
4.5 Market, By Region
5 Market Overview (Page No. - 41)
5.1 Introduction
5.2 Yc Shift Analysis
5.3 Market Dynamics
5.3.1 Drivers
5.3.1.1 Small Hydropower Projects to Increase Rural Electrification in Developing and Underdeveloped Countries
5.3.1.2 Financial Incentives and Assistance in the Form of Low-Interest Loans, Grants, Renewable Purchase Obligations, and Feed-In-Tariffs for Small Hydropower are Expected to Aid the Market Growth
5.3.1.3 Investments in Renewable and Small Hydropower Projects in Response to Climate Change are Expected to Drive the Market
5.3.2 Restraints
5.3.2.1 Unstable Supply, as the Energy Generated Depends on Seasonal Highs and Lows, Can Act as A Deterrent for Small Hydropower Installations
5.3.3 Opportunities
5.3.3.1 Integration of Iot With Hydropower is Expected to Create New Opportunities
5.3.3.2 Positive Outlook Toward Small Hydropower Dams to Sustain Life in Rural Communities
5.3.4 Challenges
5.3.4.1 New Solar Photovoltaic (PV) and Onshore Wind Power are on the Verge of Costing Less Than the Marginal Operating Cost of Hydropower
6 Market, By Type (Page No. - 48)
6.1 Introduction
6.2 Micro Hydropower
6.2.1 Investments in Distributed Generation and Off-Grid Projects are Driving the Market in the Micro Hydropower Segment
6.3 Mini Hydropower
6.3.1 Increasing Investments in Renewable Energy to Combat Climate Change are Expected to Drive the Mini Hydropower Segment
7 Market, By Component (Page No. - 52)
7.1 Introduction
7.2 Electromechanical Equipment
7.2.1 Turbine
7.2.2 Generator
7.2.3 Other Equipment
7.3 Electric Infrastructure
7.3.1 Grid-Connected Small Hydropower Plants Require Additional Electric Infrastructure for Reliable Grid Connection
7.4 Civil Works
7.4.1 Civil Structures are Required for Better Efficiency and Optimal Utilization of Available Resources
7.5 Others
7.5.1 Engineering, Structural, Project Development, and Environmental Mitigation Activities are Necessary for Proper Small Hydropower Project Execution
8 Small Hydropower, By Capacity (Page No. - 61)
8.1 Introduction
8.2 Up to 1 MW
8.2.1 Increasing Investments in Rural Electrification are Driving the Up to 1 MW Segment
8.3 1�10 MW
8.3.1 Rural Electrification and Renewable Energy Targets are Driving the 1�10 MW Segment in the Small Hydropower Industry
9 Market, By Region (Page No. - 65)
9.1 Introduction
9.1.1 By Capacity
9.1.2 By Component
9.1.2.1 By Subcomponent
9.1.3 By Region
9.2 Asia Pacific
9.2.1 By Capacity
9.2.2 By Component
9.2.2.1 By Subcomponent
9.2.2.2 By Country
9.2.3 By Type
9.2.4 By Country
9.2.4.1 China
9.2.4.1.1 Rapid Increase in the Economic Growth With High Demand for Power Will Lead to an Increase in the Demand for Small Hydropower in China
9.2.4.2 India
9.2.4.2.1 Various Initiatives Taken By the Indian Government ForSmall Hydropower Will Drive the Market in the Country
9.2.4.3 Vietnam
9.2.4.3.1 National Level Commitment to Increase Energy Generation From Small Hydropower Plants are Expected to Drive the Market in Vietnam
9.2.4.4 Japan
9.2.4.4.1 Previously, Untapped Sources Such as Low-Head Nonpowered Dams Now Present New Opportunities for Small Hydropower Development
9.2.4.5 Rest of Asia Pacific
9.2.4.5.1 Rise in the Total Electricity Generation Through Hydropower, and the Growing Focus on Small Hydropower are the Driving Factors for the Small Hydropower Industry in the Rest of Asia Pacific Region
9.3 Europe
9.3.1 By Capacity
9.3.2 By Component
9.3.2.1 By Subcomponent
9.3.2.2 By Country
9.3.3 By Type
9.3.4 By Country
9.3.4.1 Norway
9.3.4.1.1 Growing Demand for Electricity Will Drive the Need for Small Hydropower Plants in Norway
9.3.4.2 France
9.3.4.2.1 Government Initiatives and Target to Increase Small Hydropower Projects are Expected to Drive the Market for Small Hydropower in France
9.3.4.3 Italy
9.3.4.3.1 Government Initiatives to Reduce the Environmental Effect Caused Due to Large Hydropower Projects Will Drive the Market for Small Hydropower in Italy
9.3.4.4 Austria
9.3.4.4.1 Upcoming Projects Related to Small Hydropower With Favorable Government Initiatives Will Lead to the Growth of the Small Hydropower Industry in Austria
9.3.4.5 Turkey
9.3.4.5.1 Increase in the Power Demand and Rise in the Installation of Hydropower Plants Reflect the Growth of the Small Hydropower Industry in Turkey
9.3.4.6 Rest of Europe
9.3.4.6.1 Investments in Off-Grid Energy Generation Supported By Government Initiatives are Contributing to the Small Hydropower Industry Growth
9.4 North America
9.4.1 By Capacity
9.4.2 By Component
9.4.2.1 By Subcomponent
9.4.2.2 By Country
9.4.3 By Type
9.4.4 By Country
9.4.4.1 US
9.4.4.1.1 Strong Economic Growth and Increase in the Installed Hydropower Capacity Year-On-Year Will Increase the Market for Small Hydropower in the US
9.4.4.2 Canada
9.4.4.3 Mexico
9.4.4.3.1 Rapid Increase in the Production of Electricity Through Clean Power Plant With the Aim to Produce 35% of the Electricity Through Clean Sources Will Thrive the Mexican Small Hydropower Industry
9.5 South America
9.5.1 By Capacity
9.5.2 By Component
9.5.2.1 By Subcomponent
9.5.2.2 By Country
9.5.3 By Type
9.5.4 By Country
9.5.4.1 Brazil
9.5.4.1.1 Rising Demand for Electricity With the Highest Amount of Installed Hydropower Capacity Across South America Reflects the Demand for Small Hydropower in the Country
9.5.4.2 Chile
9.5.4.2.1 Favorable Initiatives Taken By the Government to Increase the Demand for Small Hydropower Will Drive the Market in Chile
9.5.4.3 Colombia
9.5.4.3.1 Rise in the Country�s Power Generation With More Than Half of the Portion Produced By Hydropower, Along With the Focus on Small Hydropower Will Boost the Market for Small Hydropower in Future
9.5.4.4 Rest of South America
9.5.4.4.1 Increase in Electricity Production and Rise in the Installed Capacity of Small Hydropower Will Drive the Market for Small Hydropower in the Region
9.6 Rest of the World
9.6.1 By Capacity
9.6.2 By Component
9.6.2.1 By Subcomponent
9.6.2.2 By Country
9.6.3 By Type
9.6.4 By Country
9.6.4.1 Africa
9.6.4.2 Middle East
10 Competitive Landscape (Page No. - 117)
10.1 Overview
10.2 Ranking of Players and Industry Concentration, 2018
10.2.1 Contracts & Agreements
10.2.2 New Product Launches
10.2.3 Investments & Expansions
10.2.4 Partnerships & Collaborations
10.3 Competitive Leadership Mapping
10.3.1 Visionary Leaders
10.3.2 Innovators
10.3.3 Dynamic Differentiators
10.3.4 Emerging Companies
11 Company Profiles (Page No. - 125)
(Business Overview, Products Offered, Recent Developments, SWOT Analysis, and MnM View)*
11.1 Voith
11.2 ANDRITZ
11.3 GE Renewable Energy
11.4 Siemens
11.5 Toshiba
11.6 BHEL
11.7 SNC-Lavalin
11.8 HNAC Technology
11.9 Gilbert Gilkes & Gordon Ltd
11.10 Mavel
11.11 HM Hydro
11.12 GANZ EEM
11.13 Kolektor Turboinstitut
11.14 Canyon Hydro
11.15 CKD Blansko
11.16 Canadian Hydro Components
11.17 Atb Riva Calzoni
11.18 Flovel
11.19 B Fouress
11.20 Global Hydro
*Details on Business Overview, Products Offered, Recent Developments, SWOT Analysis, and MnM View Might Not Be Captured in Case of Unlisted Companies.
12 Appendix (Page No. - 160)
12.1 Insights of Industry Experts
12.2 Discussion Guide
12.3 Knowledge Store: Marketsandmarkets� Subscription Portal
12.4 Available Customizations
12.5 Related Reports
12.6 Author Details
List of Tables (119 Tables)
Table 1 Small Hydropower Market Terminology, By Capacity: Inclusions & Exclusions
Table 2 Market Terminology, By Type: Inclusions & Exclusions
Table 3 Market Terminology, By Component: Inclusions & Exclusions
Table 4 Market Snapshot
Table 5 Integration of Iot With Hydropower
Table 6 Market Size, By Type, 2017�2024 (USD Thousand)
Table 7 Micro Hydropower: Market Size, By Region, 2017�2024 (USD Thousand)
Table 8 Mini Hydropower: Market Size, By Region, 2017�2024 (USD Thousand)
Table 9 Market Size, By Component, 2017�2024 (USD Thousand)
Table 10 Electromechanical Equipment: Market Size, By Subcomponent, 2017�2024 (USD Thousand)
Table 11 Electromechanical Equipment: Market Size, By Region, 2017�2024 (USD Thousand)
Table 12 Turbine: Electromechanical Equipment, Market Size, By Region, 2017�2024 (USD Thousand)
Table 13 Generator: Electromechanical Equipment, Market Size, By Region, 2017�2024 (USD Thousand)
Table 14 Other Equipment: Electromechanical Equipment, Market Size, By Region, 2017�2024 (USD Thousand)
Table 15 Electric Infrastructure: Market Size, By Region, 2017�2024 (USD Thousand)
Table 16 Civil Works: Market Size, By Region, 2017�2024 (USD Thousand)
Table 17 Others: Market Size, By Region, 2017�2024 (USD Thousand)
Table 18 Small Hydropower Market Size, By Capacity, 2017�2024 (USD Thousand)
Table 19 Up to 1 MW: Market Size, By Region, 2017�2024 (USD Thousand)
Table 20 1�10 MW: Market Size, By Region, 2017�2024 (USD Thousand)
Table 21 Market Size, By Capacity, 2017�2024 (USD Thousand)
Table 22 Small Hydropower Market Size, By Component, 2017�2024 (USD Thousand)
Table 23 Electromechanical Equipment: Market Size, By Subcomponent, 2017�2024 (USD Thousand)
Table 24 Electromechanical Equipment: Market Size, By Region, 2017�2024 (USD Thousand)
Table 25 Market Size, By Region, 2017�2024 (USD Thousand)
Table 26 Asia Pacific: Market Size, By Capacity, 2017�2024 (USD Thousand)
Table 27 Asia Pacific: Market Size, By Component, 2017�2024 (USD Thousand)
Table 28 Asia Pacific: Electromechanical Equipment, Market Size, By Subcomponent, 2017�2024 (USD Thousand)
Table 29 Asia Pacific: Electromechanical Equipment, Market Size, By Country, 2017�2024 (USD Thousand)
Table 30 Asia Pacific: Market Size, By Type, 2017�2024 (USD Thousand)
Table 31 Asia Pacific: Market Size, By Country, 2017�2024 (USD Thousand)
Table 32 China: Market Size, By Capacity, 2017�2024 (USD Thousand)
Table 33 China: Market Size, By Component, 2017�2024 (USD Thousand)
Table 34 China: Electromechanical Equipment, Market Size, By Subcomponent, 2017�2024 (USD Thousand)
Table 35 India: Market Size, By Capacity, 2017�2024 (USD Thousand)
Table 36 India: Market Size, By Component, 2017�2024 (USD Thousand)
Table 37 India: Electromechanical Equipment, Market Size, By Subcomponent, 2017�2024 (USD Thousand)
Table 38 Vietnam: Market Size, By Capacity, 2017�2024 (USD Thousand)
Table 39 Vietnam: Market Size, By Component, 2017�2024 (USD Thousand)
Table 40 Vietnam: Electromechanical Equipment, Market Size, By Subcomponent, 2017�2024 (USD Thousand)
Table 41 Japan: Market Size, By Capacity, 2017�2024 (USD Thousand)
Table 42 Japan: Market Size, By Component, 2017�2024 (USD Thousand)
Table 43 Japan: Electromechanical Equipment, Market Size, By Subcomponent, 2017�2024 (USD Thousand)
Table 44 Rest of Asia Pacific: Market Size, By Capacity, 2017�2024 (USD Thousand)
Table 45 Rest of Asia Pacific: Market Size, By Component, 2017�2024 (USD Thousand)
Table 46 Rest of Asia Pacific: Electromechanical Equipment, Market Size, By Subcomponent, 2017�2024 (USD Thousand)
Table 47 Europe: Market Size, By Capacity, 2017�2024 (USD Thousand)
Table 48 Europe: Market Size, By Component, 2017�2024 (USD Thousand)
Table 49 Europe: Electromechanical Equipment, Market Size, By Subcomponent, 2017�2024 (USD Thousand)
Table 50 Europe: Electro-Mechanical Equipment Market Size, By Country, 2017�2024 (USD Thousand)
Table 51 Europe: Market Size, By Type, 2017�2024 (USD Thousand)
Table 52 Europe: Market Size, By Country, 2017�2024 (USD Thousand)
Table 53 Norway: Market Size, By Capacity, 2017�2024 (USD Thousand)
Table 54 Norway: Market Size, By Component, 2017�2024 (USD Thousand)
Table 55 Norway: Electromechanical Equipment, Market Size, By Subcomponent, 2017�2024 (USD Thousand)
Table 56 France: Market Size, By Capacity, 2017�2024 (USD Thousand)
Table 57 France: Market Size, By Component, 2017�2024 (USD Thousand)
Table 58 France: Electromechanical Equipment, Market Size, By Subcomponent, 2017�2024 (USD Thousand)
Table 59 Italy: Market Size, By Capacity, 2017�2024 (USD Thousand)
Table 60 Italy: Market Size, By Component, 2017�2024 (USD Thousand)
Table 61 Italy: Electromechanical Equipment, Market Size, By Subcomponent, 2017�2024 (USD Thousand)
Table 62 Austria: Market Size, By Capacity, 2017�2024 (USD Thousand)
Table 63 Austria: Market Size, By Component, 2017�2024 (USD Thousand)
Table 64 Austria: Electromechanical Equipment, Market Size, By Subcomponent, 2017�2024 (USD Thousand)
Table 65 Turkey: Market Size, By Capacity, 2017�2024 (USD Thousand)
Table 66 Turkey: Market Size, By Component, 2017�2024 (USD Thousand)
Table 67 Turkey: Electromechanical Equipment, Market Size, By Subcomponent, 2017�2024 (USD Thousand)
Table 68 Rest of Europe: Market Size, By Capacity, 2017�2024 (USD Thousand)
Table 69 Rest of Europe: Market Size, By Component, 2017�2024 (USD Thousand)
Table 70 Rest of Europe: Electromechanical Equipment, Market Size, By Subcomponent, 2017�2024 (USD Thousand)
Table 71 North America: Market Size, By Capacity, 2017�2024 (USD Thousand)
Table 72 North America: Market Size, By Component, 2017�2024 (USD Thousand)
Table 73 North America: Electromechanical Equipment, Market Size, By Subcomponent, 2017�2024 (USD Thousand)
Table 74 North America: Electromechanical Equipment, Market Size, By Country, 2017�2024 (USD Thousand)
Table 75 North America: Market Size, By Type, 2017�2024 (USD Thousand)
Table 76 North America: Market Size, By Country, 2017�2024 (USD Thousand)
Table 77 US: Market Size, By Capacity, 2017�2024 (USD Thousand)
Table 78 US: Market Size, By Component, 2017�2024 (USD Thousand)
Table 79 US: Electromechanical Equipment, Market Size, By Subcomponent, 2017�2024 (USD Thousand)
Table 80 Canada: Market Size, By Capacity, 2017�2024 (USD Thousand)
Table 81 Canada: Market Size, By Component, 2017�2024 (USD Thousand)
Table 82 Canada: Electromechanical Equipment, Market Size, By Subcomponent, 2017�2024 (USD Thousand)
Table 83 Mexico: Market Size, By Capacity, 2017�2024 (USD Thousand)
Table 84 Mexico: Market Size, By Component, 2017�2024 (USD Thousand)
Table 85 Mexico: Electromechanical Equipment, Market Size, By Subcomponent, 2017�2024 (USD Thousand)
Table 86 South America: Market Size, By Capacity, 2017�2024 (USD Thousand)
Table 87 South America: Market Size, By Component, 2017�2024 (USD Thousand)
Table 88 South America: Electromechanical Equipment, Market Size, By Subcomponent, 2017�2024 (USD Thousand)
Table 89 South America: Electromechanical Equipment, Market Size, By Country, 2017�2024 (USD Thousand)
Table 90 South America: Market Size, By Type, 2017�2024 (USD Thousand)
Table 91 South America: Market Size, By Country,2017�2024 (USD Thousand)
Table 92 Brazil: Market Size, By Capacity, 2017�2024 (USD Thousand)
Table 93 Brazil: Market Size, By Component, 2017�2024 (USD Thousand)
Table 94 Brazil: Electromechanical Equipment, Market Size, By Subcomponent, 2017�2024 (USD Thousand)
Table 95 Chile: Market Size, By Capacity, 2017�2024 (USD Thousand)
Table 96 Chile: Market Size, By Component, 2017�2024 (USD Thousand)
Table 97 Chile: Electromechanical Equipment, Market Size, By Subcomponent, 2017�2024 (USD Thousand)
Table 98 Colombia: Market Size, By Capacity, 2017�2024 (USD Thousand)
Table 99 Colombia: Market Size, By Component, 2017�2024 (USD Thousand)
Table 100 Colombia: Electromechanical Equipment, Market Size, By Subcomponent, 2017�2024 (USD Thousand)
Table 101 Rest of South America: Market Size, By Capacity, 2017�2024 (USD Thousand)
Table 102 Rest of South America: Market Size,By Component, 2017�2024 (USD Thousand)
Table 103 Rest of South America: Electromechanical Equipment, Market Size, By Subcomponent, 2017�2024 (USD Thousand)
Table 104 Rest of the World: Market Size, By Capacity, 2017�2024 (USD Thousand)
Table 105 Rest of the World: Market Size, By Component, 2017�2024 (USD Thousand)
Table 106 Rest of the World: Electromechanical Equipment, Market Size, By Subcomponent, 2017�2024 (USD Thousand)
Table 107 Rest of the World: Electromechanical Equipment, Market Size, By Country, 2017�2024 (USD Thousand)
Table 108 Rest of the World: Market Size, By Type, 2017�2024 (USD Thousand)
Table 109 Rest of the World: Market Size, By Country,2017�2024 (USD Thousand)
Table 110 Africa: Market Size, By Capacity, 2017�2024 (USD Thousand)
Table 111 Africa: Market Size, By Component, 2017�2024 (USD Thousand)
Table 112 Africa: Electromechanical Equipment, Market Size, By Subcomponent, 2017�2024 (USD Thousand)
Table 113 Middle East: Market Size, By Capacity, 2017�2024 (USD Thousand)
Table 114 Middle East: Market Size, By Component, 2017�2024 (USD Thousand)
Table 115 Middle East: Electromechanical Equipment, Market Size, By Subcomponent, 2017�2024 (USD Thousand)
Table 116 Contracts & Agreements, 2018�2019
Table 117 New Product Launches, 2017�2019
Table 118 Investments & Expansions, 2017�2019
Table 119 Investments & Expansions, 2018�2019
List of Figures (45 Figures)
Figure 1 Small Hydropower Market: Research Design
Figure 2 Main Metrics Considered While Constructing and Assessing the Demand for the Market
Figure 3 Increasing Installation of Small Hydropower Capacity is Expected to Boost the Growth of the Global Market
Figure 4 Market Estimation Methodology for the Global Market, From Supply Side
Figure 5 Small Hydropower Industry Share, 2018
Figure 6 Data Triangulation Methodology
Figure 7 Key Service Providers� Point of View
Figure 8 1�10 MW Segment is Expected to Hold A Larger Share of the Market, By Capacity, During the Forecast Period
Figure 9 Mini Hydropower Segment is Expected to Lead the Market, By Type, During the Forecast Period
Figure 10 Civil Works Segment is Expected to Hold the Largest Share of the Market, By Component, During the Forecast Period
Figure 11 Asia Pacific Dominated the Small Hydropower Industry in 2018
Figure 12 Increasing Investments in Rural Electrification and Renewable Energy are Expected to Drive the Market, 2019�2024
Figure 13 1�10 MW Segment Dominated the Small Hydropower, By Capacity, in 2018
Figure 14 Mini Hydropower Segment Dominated the Small Hydropower, By Type, in 2018
Figure 15 Civil Works Segment Dominated the Small Hydropower, By Component, in 2018
Figure 16 Asia Pacific Market is Expected to Be the Largest During the Forecast Period
Figure 17 Market: Drivers, Restraints, Opportunities, and Challenges
Figure 18 Rural Electrification, By Region, 2017
Figure 19 Renewable Power Investments, By Type, 2010�2018 (USD Billion)
Figure 20 Monthly Average Flow of Swan River, 2018 (Megaliters)
Figure 21 Global Weighted Average Total Installed Costs, By Type, 2010�2018 (USD/Kw)
Figure 22 Market, By Type, 2018
Figure 23 Small Hydropower, By Component, 2018
Figure 24 Small Hydropower, By Capacity, 2018
Figure 25 Regional Snapshot: Rest of the World Market is Expected to Grow at the Highest Cagr During the Forecast Period
Figure 26 Small Hydropower Industry Share (Value), By Region, 2018
Figure 27 Asia Pacific: Regional Snapshot
Figure 28 Europe: Regional Snapshot
Figure 29 Key Developments in the Market, 2016�2019
Figure 30 Voith and ANDRITZ Led the Small Hydropower in 2018
Figure 31 Small Hydropower Market (Global) Competitive Leadership Mapping, 2018
Figure 32 Voith: Company Snapshot
Figure 33 Voith: SWOT Analysis
Figure 34 ANDRITZ : Company Snapshot
Figure 35 ANDRITZ : SWOT Analysis
Figure 36 GE Renewable Energy: Company Snapshot
Figure 37 GE Renewable Energy: SWOT Analysis
Figure 38 Siemens: Company Snapshot
Figure 39 Siemens: SWOT Analysis
Figure 40 Toshiba: Company Snapshot
Figure 41 Toshiba: SWOT Analysis
Figure 42 BHEL: Company Snapshot
Figure 43 BHEL: SWOT Analysis
Figure 44 SNC-Lavalin: Company Snapshot
Figure 45 SNC-Lavalin: SWOT Analysis
This study involved four major activities in estimating the current size of the small hydropower market. Exhaustive secondary research was done to collect information on the market, the peer market, and the parent market. The next step was to validate these findings, assumptions, and market sizing with industry experts across the value chain through rigorous primary research. Both top-down and bottom-up approaches were used to estimate the total market size. The market breakdown and data triangulation techniques were employed to estimate the market size of the segments and the corresponding subsegments.
Secondary Research
This research study involved the use of extensive secondary sources, directories, and databases such as UNCTAD data, industry publications, several newspaper articles, Statista Industry Journal, Factiva, and hydropower journals to identify and collect information useful for a technical, market-oriented, and commercial study of the small hydropower market. The other secondary sources included annual reports, press releases & investor presentations of companies, white papers, certified publications, articles by recognized authors, manufacturer associations, trade directories, and databases.
Primary Research
The small hydropower market comprises several stakeholders such as companies related to the utilities, IPP�s, consulting companies in the energy & power sector, power generation companies, government & research organizations, forums, alliances & associations, small hydropower solution providers, state & national utility authorities, small hydropower component manufacturers, dealers & suppliers, and vendors. The demand side of the market is characterized by utilities and Independent Power producers(IPP�s), investments in areas such as rural electrification, and off-grid generation. Moreover, demand is also driven by the rising interest in renewable energy solutions. The supply side is characterized by the increase in contracts & agreements and mergers & acquisitions among big players. Various primary sources from both the supply and demand sides of the market were interviewed to obtain qualitative and quantitative information. The breakdown of primary respondents is given below:
To know about the assumptions considered for the study, download the pdf brochure
Market Size Estimation
Both top-down and bottom-up approaches have been used to estimate and validate the size of the global small hydropower market and its dependent submarkets. These methods were also used extensively to determine the size of various subsegments in the market. The research methodology used to estimate the market size includes the following:
- The key players in the industry and demand have been identified through extensive secondary research, and their market shares in the respective regions have been determined through both primary and secondary research.
- The industry�s supply chain and market size, in terms of value, have been determined through primary and secondary research processes.
- All percentage shares, splits, and breakdowns have been determined using secondary sources and verified through primary sources.
Data Triangulation
After arriving at the overall market size-using the market size estimation processes as explained above-the market was split into several segments and subsegments. To complete the entire market engineering process and arrive at the exact statistics of each market segment and subsegment, the data triangulation, and market breakdown procedures were employed, wherever applicable. The data was triangulated by studying various factors and trends from both the demand and supply sides in the small hydropower sector.
Report Objectives
- To define, describe, and forecast the global small hydropower market based on capacity, type, component, and region
- To provide detailed information regarding the major factors influencing the growth of the market (drivers, restraints, opportunities, and industry-specific challenges)
- To strategically analyze the market concerning individual growth trends, future prospects, and contributions of each segment to the market
- To analyze market opportunities for stakeholders and provide details of the competitive landscape for market leaders
- To benchmark players within the market using the proprietary Vendor DIVE framework, which analyzes the market players on various parameters within the broad categories of business and product strategies
- To track and analyze competitive developments such as contracts & agreements, expansions, new product developments, and mergers & acquisitions in the market
Available Customizations:
With the given market data, MarketsandMarkets offers customizations as per the client�s specific needs. The following customization options are available for this report:
Product Analysis
- Product Matrix, which provides a detailed comparison of the product portfolio of each company
Company Information
- Detailed analysis and profiling of additional market players


Growth opportunities and latent adjacency in Small Hydropower Market