
Heat Pump Market

Heat Pump Market by Technology (Air-to-Air, Air-to-Water, Water Source, Geothermal, Hybrid, PVT), Refrigerant (R410A, R407C, R744, R290, R717), Type (Reversible, Non-reversible), Rated Capacity, End User, Application, and Region - Global Forecast to 2030


OVERVIEW
Source: Secondary Research, Interviews with Experts, MarketsandMarkets Analysis
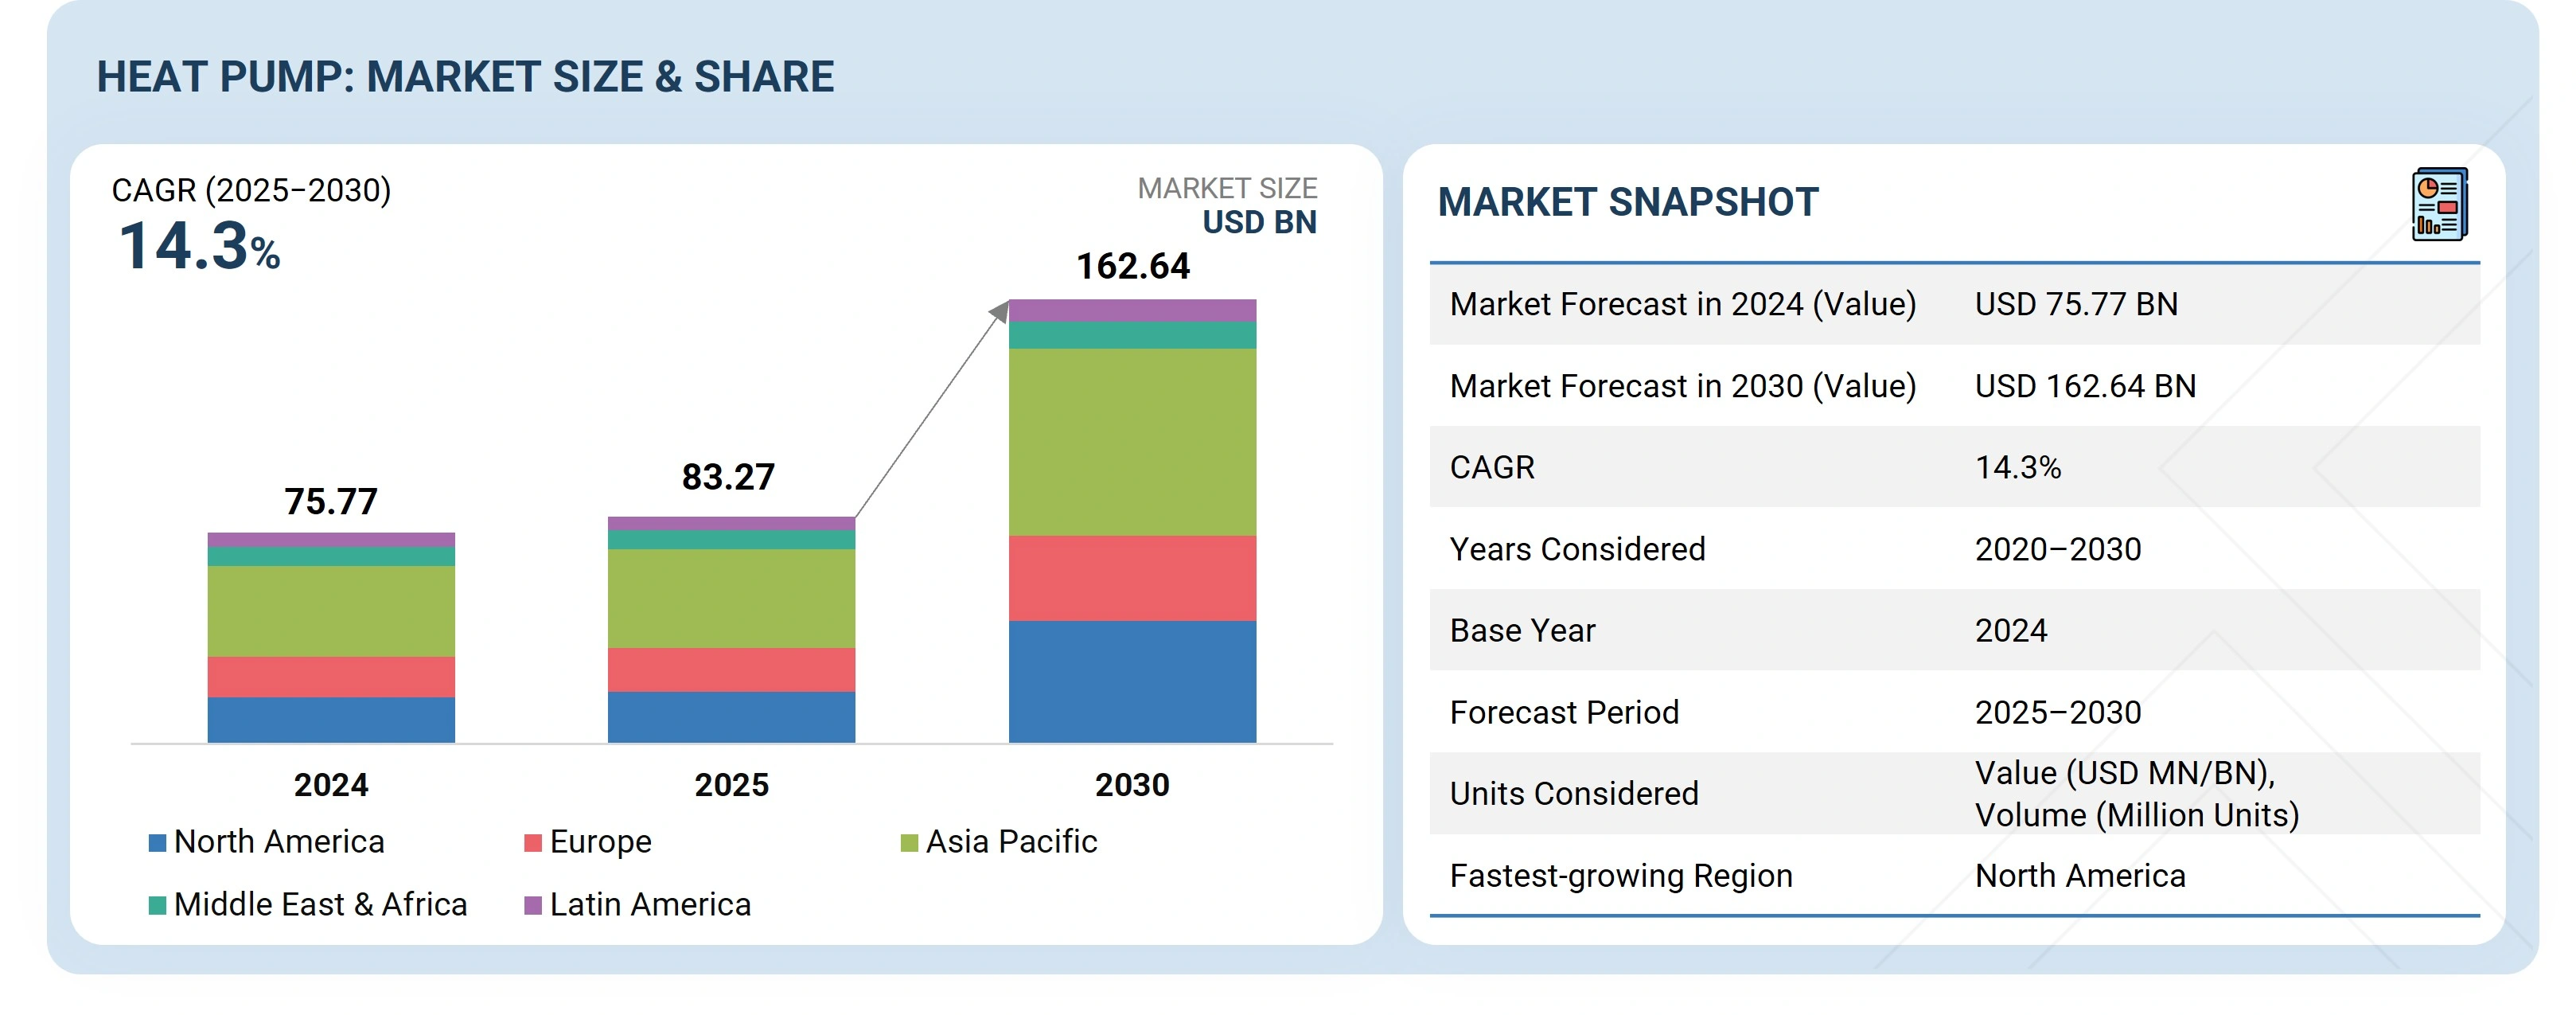
The global heat pump market is expected to reach USD 162.64 billion by 2030, from USD 83.27 billion in 2025, with a CAGR of 14.3%. Heat pumps are increasingly used as an energy-efficient alternative to traditional electric or gas water heaters for heating and cooling. The market growth is driven by the rising demand for sustainable options beyond fossil fuels in sectors that are challenging to decarbonize, such as aviation, shipping, and heavy-duty transportation. The heat pump market size is expanding at an exceptional pace, primarily driven by stringent environmental regulations aimed at curbing greenhouse gas emissions and enhancing energy efficiency. Heat pumps, known for their superior energy performance compared to conventional heating and cooling systems, are increasingly being adopted as a sustainable alternative across residential, commercial, and industrial sectors.
Heat Pump Market Size and Forecast:
- Market Size Value in 2024: USD 75.77 Billion
- Market Size Value in 2025: USD 83.27 Billion
- Revenue Forecast in 2030: USD 162.64 Billion
- Growth Rate: CAGR of 14.3% from 2025 to 2030
- Data available from 2020 to 2030
Heat Pump Market Trends and Insights
- Market Growth: Heat Pump Market growth is driven by increasing investments in energy-efficient heating solutions, supportive government policies, and rising adoption of renewable energy technologies.
-
Growing Trends: The Heat Pump market is witnessing increased deployment of air-source heat pumps, smart heat pump systems, and low-carbon heating solutions across residential and commercial sectors.
- Growth Opportunities: Embedding IoT, ML, and AI technologies into heat pump, Enhanced performance of co2 Heat Pumps, and growing demand for sustainable heating technologies are creating significant Heat Pump market opportunities.
- Market Share Analysis: The air-source heat pump segment holds the largest Heat Pump market share due to its cost-effectiveness, ease of installation, and widespread adoption.
KEY TAKEAWAYS
-
BY TECHNOLOGYMany existing buildings have older, less efficient heating and cooling systems. Retrofitting or upgrading to air-to-air heat pumps is often easier compared to more complex heat pump types (like ground source or air-to-water with hydronic infrastructure). Ductless mini-splits or splits (where ductwork is minimal or nonexistent) make such retrofits possible.
-
BY TYPENon-reversible heat pumps have simpler designs because they do not need mechanisms to reverse refrigerant flow and supporting controls, resulting in lower manufacturing costs and reduced maintenance complexity. This leads to a lower purchase price, which benefits markets and segments where cost sensitivity is high.
-
BY REFRIGERANTR410A provides higher cooling capacities and good efficiency (COP) in many air conditioning and heat pump applications compared to older refrigerants. It enables better heat transfer under certain conditions due to its pressure and temperature characteristics.
-
BY RATED CAPACITYIn areas with mild winters or moderate heating needs, large capacity heating systems are unnecessary. Up to 10 kW is adequate. Less severe cold weather promotes the use of smaller units.
-
BY END USERIndustrial processes often involve heating, drying, evaporation, and distillation. Heat pumps can be incorporated into these processes to lower energy consumption, recover waste heat, or shift heat loads more effectively. This helps industries reduce energy input per output, enhance process control, and improve product quality.
-
BY APPLICATIONHeat pumps now feature improved inverter compressors, heat exchangers, and refrigerants that enable effective performance even in low outdoor temperatures. This alleviates worries about heat pumps being inadequate for heating in colder weather.
-
BY REGIONEfforts are underway in North America to strengthen the domestic supply of compressors and related components, partly prompted by trade tariff concerns and the desire for supply chain resilience. Additionally, investments are being made to increase the production and manufacturing capacity of heat pump parts in the US and Canada.
As utilities modernize, the potential for heat pumps to be integrated into demand response programs, smart controls, and time-of-use rates increases. Heat pumps capable of shifting or modulating load are more valuable in this context.
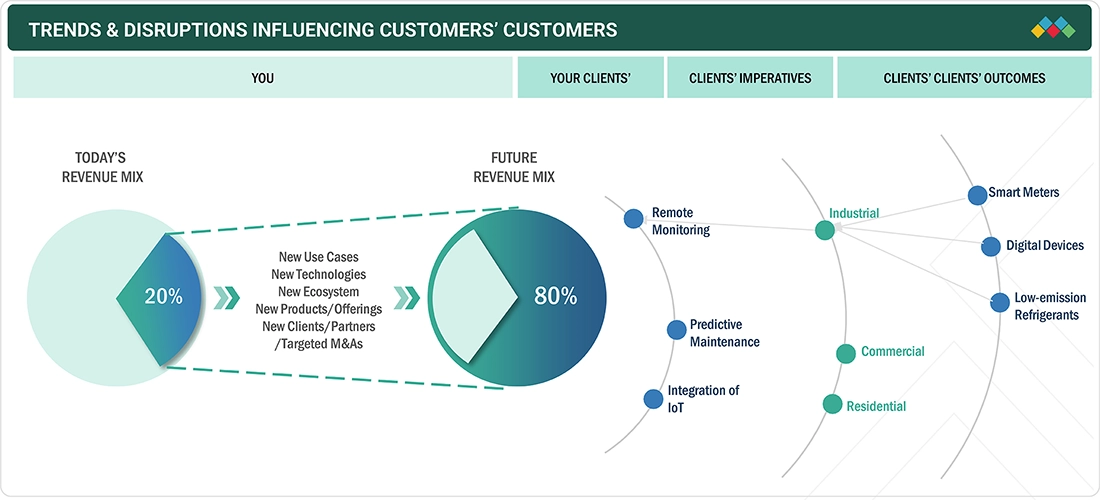
TRENDS & DISRUPTIONS IMPACTING CUSTOMERS' CUSTOMERS
The heat pump market is expected to grow at a CAGR of 14.3% during the forecast period. Major manufacturers like SAMSUNG, Panasonic Corporation, DENSO CORPORATION, Midea, and Mitsubishi Electric Corporation are expanding their product and service offerings across the value chain to increase revenue opportunities. These companies are transitioning from traditional to digital operations and are increasingly adopting low-emission refrigerants. They are also investing in integrating IoT technologies to make their heat pumps smarter and more efficient.
Source: Secondary Research, Interviews with Experts, MarketsandMarkets Analysis
MARKET DYNAMICS
Level
-
Government incentives for sustainable transitions

-
Favorable policies for energy-efficient heating and cooling systems

Level
-
Retrofitting challenges and complex installation of heat pumps

-
Space constraints for ground-source systems

Level
-
Manufacturers' focus on embedding IoT, machine learning, and AI technologies into heat pump systems

-
Cold climate optimization

Level
-
High installation costs

-
Energy source dependency

Source: Secondary Research, Interviews with Experts, MarketsandMarkets Analysis
Driver: Government incentives for sustainable transitions
Governments worldwide are implementing comprehensive policies to speed up the adoption of sustainable heating technologies. Measures like capital subsidies, tax incentives, low-interest loans, and dedicated grant programs help reduce upfront costs, making clean heating options more affordable. Major programs, including the EU Green Deal, REPowerEU, and the US Inflation Reduction Act, direct significant funding toward energy-efficient, climate-resilient technologies, with a particular emphasis on heat pumps. These supportive policies, along with increased awareness of energy efficiency and decarbonization goals, are driving steady growth in heat pump adoption, particularly for systems that utilize natural refrigerants. The industrial, commercial, and district heating sectors are increasingly embracing the shift to electrified, low-emission heating solutions, underscoring the vital role of heat pumps in advancing the clean energy transition.
Restraint: Retrofitting challenges and complex installation of heat pumps
Installing heat pumps can present significant challenges, particularly in older buildings, due to extensive modifications often required to existing infrastructure. These changes can increase both the complexity and cost of installation, posing a key barrier to broader adoption. In buildings with traditional ducted heating systems, ductwork may need to be upgraded or replaced to meet the specific requirements of a heat pump. Additionally, older electrical systems may be incompatible with modern heat pump technology, necessitating costly upgrades to ensure safety and reliable operation. Aesthetic considerations can also influence adoption. Outdoor units, along with additional components such as ducting or radiators, may be viewed as visually intrusive, which can deter homeowners who prioritize the architectural or visual appeal of their property. These challenges collectively limit the seamless integration of heat pumps in existing building stock.
Opportunity: Cold climate optimization
Recent technological innovations are improving the performance of CO2 (R-744) heat pumps in cold climate environments. Historically constrained by lower efficiency at low ambient temperatures, these systems now incorporate advanced features such as ejectors, parallel compression, and cascade configurations, which enhance energy efficiency, boost heating capacity, and maintain stable operation even in sub-zero conditions. These improvements make CO2 heat pumps a reliable and effective heating solution for northern and high-altitude regions, where consistent thermal performance is critical during harsh winters. Consequently, CO2-based systems are gaining traction in district heating networks, commercial buildings, and industrial applications, reinforcing the broader transition toward sustainable heating technologies that utilize natural refrigerants.
Challenge: Energy source dependency
The efficiency and environmental benefits of heat pumps are closely tied to the energy sources used to power them, making a region’s location and electricity mix key determinants of their overall impact. In areas where the grid relies heavily on fossil fuels, the potential environmental advantages of heat pumps can be diminished. While heat pumps are inherently energy-efficient, their net environmental benefit depends on the carbon intensity of the electricity that drives them. This dependence highlights the connection between the heat pump market and broader energy policies, underscoring the importance of a comprehensive approach to decarbonizing both heating and electricity systems. Shifting toward cleaner, sustainable energy sources is crucial to unlocking the full environmental potential of heat pump technology.
Heat Pump Market: COMMERCIAL USE CASES ACROSS INDUSTRIES
| COMPANY | USE CASE DESCRIPTION | BENEFITS |
|---|---|---|
 |
Breweries are highly energy-intensive, with approximately 70% of their total energy consumption dedicated to thermal processes, such as heating water and generating steam. | By deploying high-temperature heat pumps (HTHPs) that utilize natural refrigerants such as ammonia or CO2, breweries can recover waste heat and transition from fossil fuel-based steam production to low-carbon, electric steam generation. For example, Coronado Brewing could utilize an HTHP to produce 115°C steam for wort boiling, thereby reducing greenhouse gas emissions and enhancing energy efficiency. These systems integrate with existing energy recovery setups, offering scalable and cost-effective solutions with minimal infrastructure changes, thereby supporting both decarbonization and reliable production in the food and beverage industry. |
 |
A hotel in a tourist destination faced rising energy costs and sought an eco-friendly solution to meet its high demand for hot water in guest services, laundry, and kitchen operations. | The hotel implemented the A. O. Smith Voltex Hybrid Electric Heat Pump Water Heater. A. O. Smith’s system efficiently met the hotel’s needs by extracting heat from the air, significantly lowering energy use. The hotel saw a 30% reduction in energy costs and boosted its sustainability image. The dependable, high-performance system improved the guest experience while supporting the hotel’s commitment to environmental responsibility. |
Logos and trademarks shown above are the property of their respective owners. Their use here is for informational and illustrative purposes only.
MARKET ECOSYSTEM
The ecosystem analysis reveals the interconnections/adjacencies that influence the heat pump market by illustrating MnM's coverage of the market under study. The ecosystem includes major players operating at different levels. Bosch Rexroth (Germany), SR Systems (India), AMI (AmiTech India Pvt. Ltd.) (India), and Koyo Electronics Industries (Japan) are leading component manufacturers. Major DCS providers include ABB (Switzerland), Siemens (Germany), GE Vernova (US), and Rockwell Automation (US).
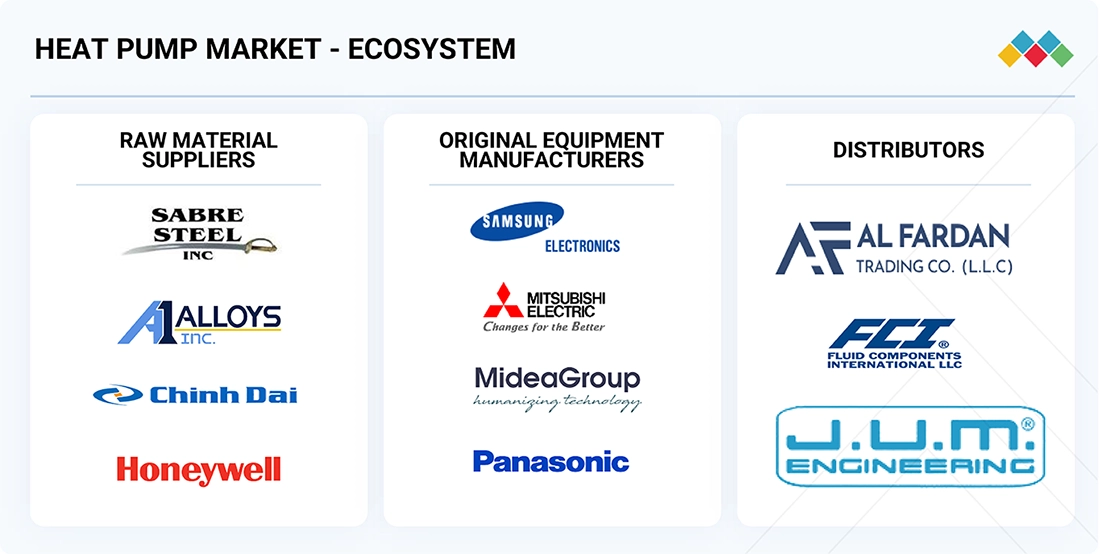
Logos and trademarks shown above are the property of their respective owners. Their use here is for informational and illustrative purposes only.
MARKET SEGMENTS
Source: Secondary Research, Interviews with Experts, MarketsandMarkets Analysis
Heat Pump Market, By End User
The residential segment is expected to hold the largest share of the heat pump market due to its convenience and high energy efficiency. Unlike traditional systems, heat pumps reduce greenhouse gas emissions by transferring ambient heat without relying on fossil fuels. They help homeowners lower energy bills while supporting carbon neutrality and compliance with energy codes. The growing interest in sustainable technologies, combined with government incentives such as subsidies, tax credits, and low-interest financing, is driving their adoption. Overall, heat pumps offer an environmentally friendly, cost-effective, and energy-efficient heating solution for homes.
Heat Pump Market, By Application
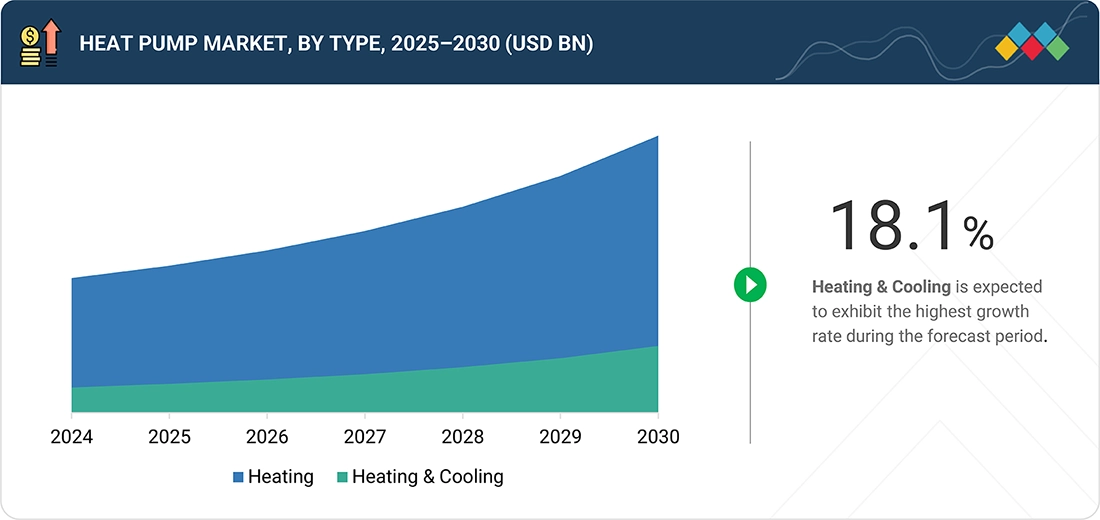
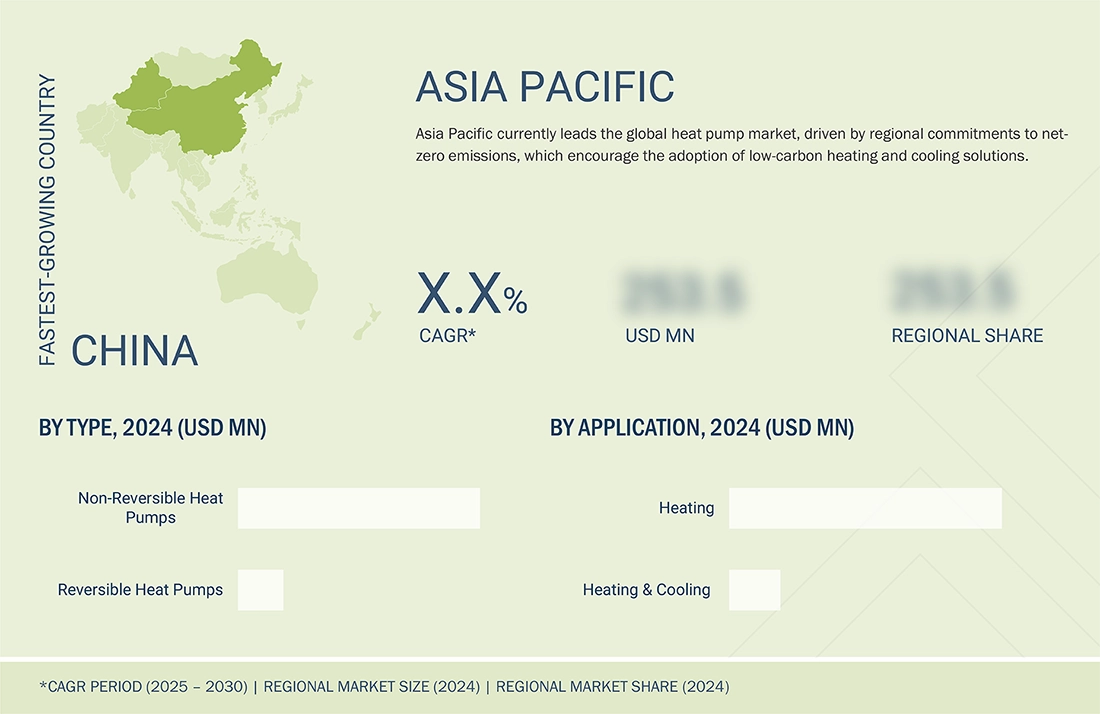
The heating application segment is projected to hold the highest market share, driven by demand for energy-efficient space and water heating in residential, commercial, and industrial sectors. Stricter building codes and decarbonization policies are boosting adoption, as space heating is a major source of CO2 emissions. Advances in compressor technology, variable-speed components, and inverter-driven systems are improving performance in cold climates. Standards and certifications, such as ISO and AHRI, ensure reliability, efficiency, and interoperability. Growth is further supported by retrofitting legacy systems in mature markets, as well as by combined policy, financial incentives, and product innovations.
Heat Pump Market, By Type
Non-reversible heat pumps are dominating the heat pump market, as they feature a heating-only function and are purpose-built to deliver consistent and stable performance under diverse operating conditions. Their focused design minimizes mechanical strain and operational stress, reducing maintenance needs and extending the system’s overall lifespan. By optimizing components specifically for heating, these systems ensure dependable operation even in demanding environments, offering homeowners and businesses a durable, long-term solution that combines efficiency with reliability.
Heat Pump Market, By Refrigerant Type
The R-410A refrigerant is the largest segment in the heat pump market. R-410A is a chlorine-free refrigerant, making it safe for the ozone layer and fully aligned with global environmental regulations. Its eco-friendly composition allows manufacturers and end-users to adopt sustainable cooling solutions without compromising performance. By reducing the environmental impact of air conditioning and heat pump systems, R-410A supports broader climate protection initiatives, helping stakeholders meet stringent regulatory standards and sustainability goals while maintaining high system efficiency and reliability.
REGION
Asia Pacific to be largest region in heat pump market during forecast period
Across the Asia Pacific region, governments are setting ambitious carbon neutrality and net-zero targets in line with international climate agreements. This regulatory push is accelerating the shift away from carbon-intensive heating and cooling systems that rely on coal, oil, or natural gas. Heat pumps are becoming a key technology in this transition, as they can provide two to four times more energy efficiency than traditional systems while significantly reducing direct CO2 emissions. They are used in both residential and commercial buildings, replacing fossil-fuel boilers, and in industrial sectors, where they recover waste heat and decarbonize process heating. By enabling the electrification of thermal demand and aligning with cleaner power grids, heat pumps support national and regional decarbonization efforts while advancing sustainability goals.
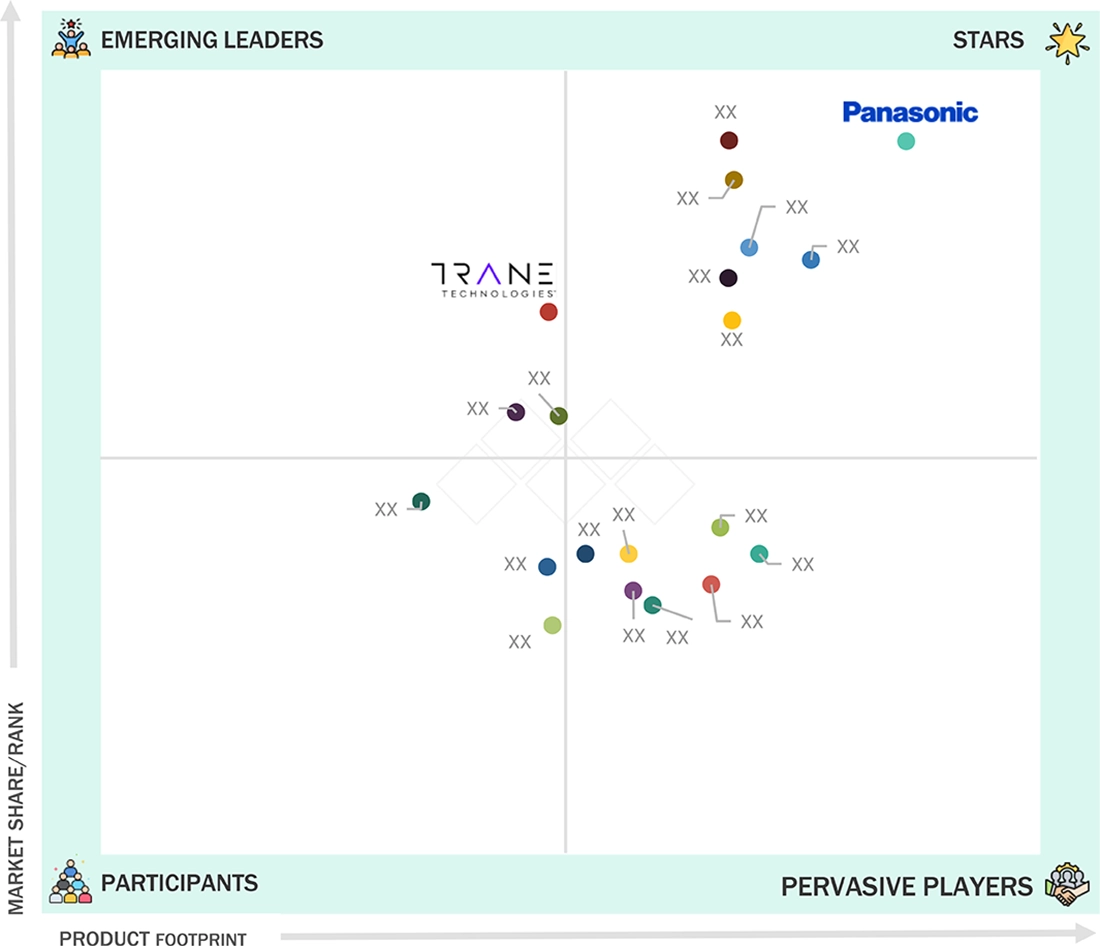
Heat Pump Market: COMPANY EVALUATION MATRIX
In the company evaluation matrix for the heat pump market, Panasonic Holdings Corporation leads with a strong market presence and a comprehensive product portfolio, driving heat pump adoption across various industries, including grid management and renewable energy integration. Trane Technologies plc is gaining traction with sustainable adiabatic solutions.
Source: Secondary Research, Interviews with Experts, MarketsandMarkets Analysis
KEY MARKET PLAYERS
MARKET SCOPE
| REPORT METRIC | DETAILS |
|---|---|
| Market Size in 2025 (Value) | USD 75.75 BN |
| Market Forecast in 2030 (Value) | USD 162.64 BN |
| Growth Rate | CAGR of 14.3% (2025–2030) |
| Years Considered | 2020–2030 |
| Base Year | 2024 |
| Forecast Period | 2025–2030 |
| Units Considered | Value (USD MN/BM), Volume (Million Units) |
| Report Coverage | Revenue Forecast, Company Ranking, Competitive Landscape, Growth Factors, and Trends |
| Segments Covered |
|
| Regions Covered | Europe, Asia Pacific, North America, Middle East & Africa, South America |
WHAT IS IN IT FOR YOU: Heat Pump Market REPORT CONTENT GUIDE
DELIVERED CUSTOMIZATIONS
We have successfully delivered the following deep-dive customizations:
| CLIENT REQUEST | CUSTOMIZATION DELIVERED | VALUE ADDS |
|---|---|---|
| US Based Heat Pump Project | • Market estimation based on US market for heat pumps | • Identified each segment under US market in form of key highlights and market shares |
| North America HVAC Systems | • Market estimation based on North American market for heat pumps | • Insights on regulatory framework, along with detailed analysis of drivers, restraints, opportunities, and challenges, based on heat pump market in North America |
RECENT DEVELOPMENTS
- February 2024 : Panasonic Holdings Corporation introduced the ECOi-W Aqua-G Blue, a new air-to-water reversible heat pump using propane (R290), suitable for commercial, industrial, and multi-residential buildings. This product offers a rated power range from 50 to 80 kW.
- November 2023 : LG Electronics opened a research facility in Alaska, US, to advance its research and development in heating, ventilation, and air conditioning (HVAC). This facility is part of the Consortium for Advanced Heat Pump Research (CAHR) between LG and local universities. The collaboration aims to enhance the competitiveness of its HVAC products.
- November 2023 : Daikin Industries Ltd. introduced new air-to-air heat pumps. These products use difluoromethane (R32) as the refrigerant. The VRV 5 series includes two models: a Mini-VRV system that produces up to 33.5 kW, and the Top-Blow series that reaches 56 kW. With this new product line, Daikin can expand its portfolio of heat pump options.
- September 2023 : Fujitsu General Australia and Fujitsu General New Zealand announced a partnership with Sensibo to expand smart home air conditioning solutions in the Australian and New Zealand markets.
Table of Contents
 Exclusive indicates content/data unique to MarketsandMarkets and not available with any competitors.
Methodology
The study involved major activities in estimating the current size of the heat pump market. Exhaustive secondary research was done to collect information on the peer and parent markets. The next step was to validate these findings, assumptions, and sizing with industry experts across the value chain through primary research. Both top-down and bottom-up approaches were employed to estimate the complete market size. Thereafter, market breakdown and data triangulation were used to estimate the market size of the segments and subsegments.
Secondary Research
This research study on the heat pump market involved the use of extensive secondary sources, directories, and databases, such as Hoovers, Bloomberg, Businessweek, Factiva, International Energy Agency, and BP Statistical Review of World Energy, to identify and collect information useful for a technical, market-oriented, and commercial study of the global heat pump market. The other secondary sources included annual reports, press releases, and investor presentations of companies, white papers, certified publications, articles by recognized authors, manufacturer associations, trade directories, and databases.
Primary Research
The heat pump market comprises stakeholders such as heat pump manufacturers, technology providers, and support providers in the supply chain. The demand side of this market is characterized by the rising demand for heating and cooling solutions in various applications such as energy, mobility, industrial, and grid injection. The supply side is characterized by rising demand for contracts from the industrial sector and mergers & acquisitions among big players. Various primary sources from both the supply and demand sides of the market were interviewed to obtain qualitative and quantitative information. The following is the breakdown of primary respondents:

Notes: “Others” include sales managers, engineers, and regional managers.
The tiers of the companies are defined based on their total revenue as of 2024: Tier 1: >USD 1 billion, Tier 2:
USD 500 million–1 billion, and Tier 3:
To know about the assumptions considered for the study, download the pdf brochure
Market Size Estimation
Both the top-down and bottom-up approaches were used to estimate and validate the size of the heat pump market. These methods were also used extensively to estimate the size of various subsegments in the market. The research methodology used to estimate the market size includes the following.
Heat Pump Market : Top-Down and Bottom-Up Approach

Data Triangulation
The total market was split into several segments and subsegments after arriving at the overall market size from the above estimation process. Data triangulation and market breakdown processes were employed to complete the overall market engineering process and arrive at the exact statistics for all the segments and subsegments, wherever applicable. The data was triangulated by studying various factors and trends from the demand and supply sides. In addition, the market size was validated using both the top-down and bottom-up approaches.
Market Definition
A heat pump is an electrical device that uses electricity to transfer heat from one place to another. Refrigerants play a key role in the movement of heat from one set of coils in the heat pump to another. The heat exchange process allows the heat pump to warm the room/building/facility during the winter and cool it during the summer. The heat pump has four main components—an evaporator, a condenser, a compressor, and an expansion device. Refrigerant is the working fluid that passes through all these components. The heat pump only transfers heat and does not generate it. It is considered an energy-efficient alternative to furnaces and air conditioners in all climates.
Stakeholders
- Maintenance and other major service providers
- Heat pump component manufacturers
- Government and research organizations
- Institutional investors
- National and local government organizations
- Heat pump equipment manufacturers
- Heat pump manufacturing companies
- Technology standard organizations, forums, alliances, and associations
Report Objectives
- To define, describe, segment, and forecast the heat pump market size, by type, refrigerant, rated capacity, end user, and application, in terms of value
- To forecast the heat pump market size, by technology, in terms of volume
- To forecast the market size across five key regions: North America, Europe, Asia Pacific, Latin America, and the Middle East & Africa, along with country-level analysis, in terms of value and volume
- To describe the key elements required to manufacture a heat pump
- To provide statistical data for installed heat pump capacity for each region and country
- To provide detailed information regarding key drivers, restraints, opportunities, and challenges influencing the market growth
- To provide the supply chain analysis, trends/disruptions impacting customer business, market mapping, pricing analysis, and regulatory landscape pertaining to the heat pump market
- To strategically analyze the ecosystem, standards and regulations, patent analysis, trade analysis, Porter’s five forces, and case studies pertaining to the market under study
- To strategically analyze micromarkets1 with respect to individual growth trends, prospects, and contributions to the overall market size
- To analyze opportunities for stakeholders in the heat pump market and draw a competitive landscape for market players
- To benchmark players within the market using the company evaluation matrix, which analyzes market players based on several parameters within the broad categories of business and product strategies
- To compare the key market players with respect to the market share, product specifications, and applications
- To strategically profile the key players and comprehensively analyze their market ranking and core competencies
- To analyze competitive developments in the heat pump market, such as contracts, agreements, investments, expansions, product launches, partnerships, joint ventures, and collaborations
Available Customizations
MarketsandMarkets offers customizations according to the specific needs of the companies with the given market data.
The following customization options are available for the report:
Product Analysis
- Product matrix, which gives a detailed comparison of the product portfolio of each company
Geographic Analysis as per Feasibility
- Further breakdown of the heat pump market, by country
Company Information
- Detailed analysis and profiling of additional market players (up to five)
Key Questions Addressed by the Report
What is the size of the heat pump market??
The size of the heat pump market in 2025 was USD 83.27 billion.
What are the major drivers for the heat pump market?
Government subsidies, tax credits, and rebates for the installation of heat pumps are incentivizing consumers to adopt this technology.
Which region is expected to be the biggest market for heat pump during the forecast period?
Asia Pacific is expected to dominate the heat pump market between 2025 and 2030, followed by Europe and North America.
Which is the largest segment, by type, in the heat pump market during the forecast period?
The non-reversible segment is estimated to account for the largest market share during the forecast period, owing to the relatively mature and cost-effective technology.
Which is the largest segment, by application, in the heat pump market during the forecast period?
Heating is estimated to account for the largest market share during the forecast period.
Need a Tailored Report?
Customize this report to your needs
Get 10% FREE Customization
Customize This ReportPersonalize This Research
- Triangulate with your Own Data
- Get Data as per your Format and Definition
- Gain a Deeper Dive on a Specific Application, Geography, Customer or Competitor
- Any level of Personalization
Let Us Help You
- What are the Known and Unknown Adjacencies Impacting the Heat Pump Market
- What will your New Revenue Sources be?
- Who will be your Top Customer; what will make them switch?
- Defend your Market Share or Win Competitors
- Get a Scorecard for Target Partners

Custom Market Research Services
We Will Customise The Research For You, In Case The Report Listed Above Does Not Meet With Your Requirements
Get 10% Free CustomisationTESTIMONIALS

Kimberly Murphy
GLOBAL MARKETING DIRECTOR
Bently Nevada,
Leading Condition Monitoring & Asset Protectionwww.bakerhughesds.com/bently-nevada

MarketsandMarkets™ showed consistent rigor for success and relentlessly worked with Bently Nevada stakeholders to positively impact go-to-market strategy. Their proactiveness and flexibility has been instrumental in achieving the objectives to grow our sales pipeline in key industrial markets.

DARRICK HUEBER
Business Development Leader
Nexus Controls LLC,
Leading Manufacturer of Automation System & Electrical Panelswww.bakerhughesds.com/nexus-controls

We partnered with MarketsandMarkets to expand our business further by tapping into new industrial segments. It was critical for us to gather crucial business insights about specific markets to achieve this goal. MarketsandMarkets engagement model and client services helped us provide those insights, it was really impressive and valuable for my business. The team was extremely flexible and helpful.

Mike Schoff
Global Industrial Commercial Strategy Leader
Nexus Controls LLC
Leading Manufacturer of Automation System & Electrical Panelswww.bakerhughesds.com/nexus-controls
We consulted MarketsandMarkets for potential Partner Identification. Overall, it was a good experience. The insights provided through interviews conducted by the team helped us put together the questionnaire required for discussion with the selected partners. Their ability to provide insights through interviews with customers in a timely manner was quite impressive.
Growth opportunities and latent adjacency in Heat Pump Market


William
May, 2022
We want to know the competitive scenario for the Heat Pump Market? and the Top vendors in the Heat Pump Industry for the Forecast period 2022 to 2026..