
Smart Appliances Market Size, Share & Trends

Smart Appliances Market Size, Share & Trends by Product (Refrigerator, Washing Machine & Dryer, Dishwasher, Oven & Cooktop, AC, Water Heater, Microwave, Coffee Maker, Air Purifier, Cooker, Vacuum Cleaning Robot), Connectivity Type, Sales Channel - Global Forecast to 2030


SMART APPLIANCES MARKET SIZE, SHARE & TRENDS
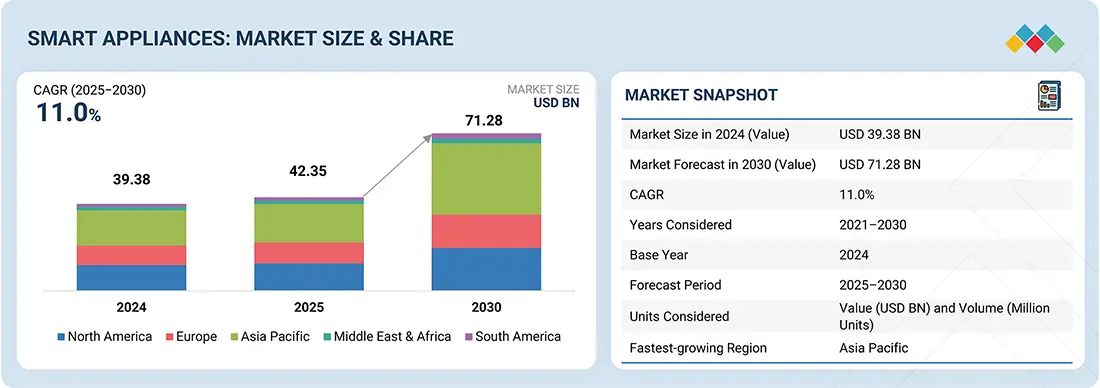
According to Marketsandmarkets, the smart appliances market size was valued at USD 42.35 billion in 2025 and is projected to reach USD 71.28 billion by 2030, growing at a CAGR of 11.0% from 2025 to 2030. The smart home appliances market includes refrigerators, washing machines, dishwashers, ovens, air conditioners, water heaters, microwaves, coffee makers, vacuum robots, air purifiers, cooking robots, etc. These connected devices enhance convenience, energy efficiency, and performance through IoT and AI, driving adoption, sustainability, and demand for smart and automated living solutions worldwide.
MARKET SNAPSHOT TABLE
| REPORT METRIC | DETAILS |
|---|---|
| Market Size in 2025 (Value) | USD 42.35 Billion |
| Market Forecast in 2030 (Value) | USD 71.28 Billion |
| Growth Rate | CAGR of 11.0% from 2025 to 2030 |
| Years Considered | 2021–2030 |
| Base Year | 2024 |
| Forecast Period | 2025–2030 |
| Units Considered | Value (USD Million) and Volume (Million Units) |
| Report Coverage | Revenue Forecast, Company Ranking, Competitive Landscape, Growth Factors, and Trends |
| Top Companies |
|
| Growth Driver |
|
| Segments Covered | By Product: Refrigerators, Washing Machines & Dryers, Dishwashers, Ovens & Cooktops, Air Conditioners, Water Heaters, Microwaves, Coffee Makers, Vacuum Cleaning Robots, Air Purifiers, Cookers/Cooking Robots, and Other Smart Appliances By Connectivity: Wi- |
| Regions Covered | North America, Europe, Asia Pacific, the Middle East & Africa, and South America |
Market Size & Forecast
• 2025 Market Size: USD 42.35 Billion
• 2030 Projected Market Size: USD 71.28 Billion
• CAGR (2025-2030): 11.0%
• Online channels: Rapidly Growing Market
• Asia Pacific: Highest CAGR
KEY TAKEAWAYS
-
BY PRODUCTThe market spans a wide range of appliances, including refrigerators, washing machines and dryers, dishwashers, ovens and cooktops, air conditioners, water heaters, microwaves, coffee makers, vacuum cleaning robots, air purifiers, cooking robots, and other smart kitchen appliances. It is driven by the surging demand for convenience, efficiency, and connected living.
-
BY CONNECTIVITY TYPEWi-Fi-enabled smart appliances dominate due to seamless integration with IoT ecosystems, while Bluetooth-based products provide cost-effective, short-range connectivity, catering to households seeking simpler solutions.
-
BY SALES CHANNELOnline channels are expanding rapidly with growing e-commerce adoption and digital promotions, while offline retail attracts buyers who prefer in-store product demonstrations and after-sales services.
-
BY VERTICALThe residential sector leads adoption, supported by rising demand for smart homes and energy-efficient solutions. In contrast, the commercial industry adopts smart appliances to improve hotel, restaurant, and office operational efficiency.
-
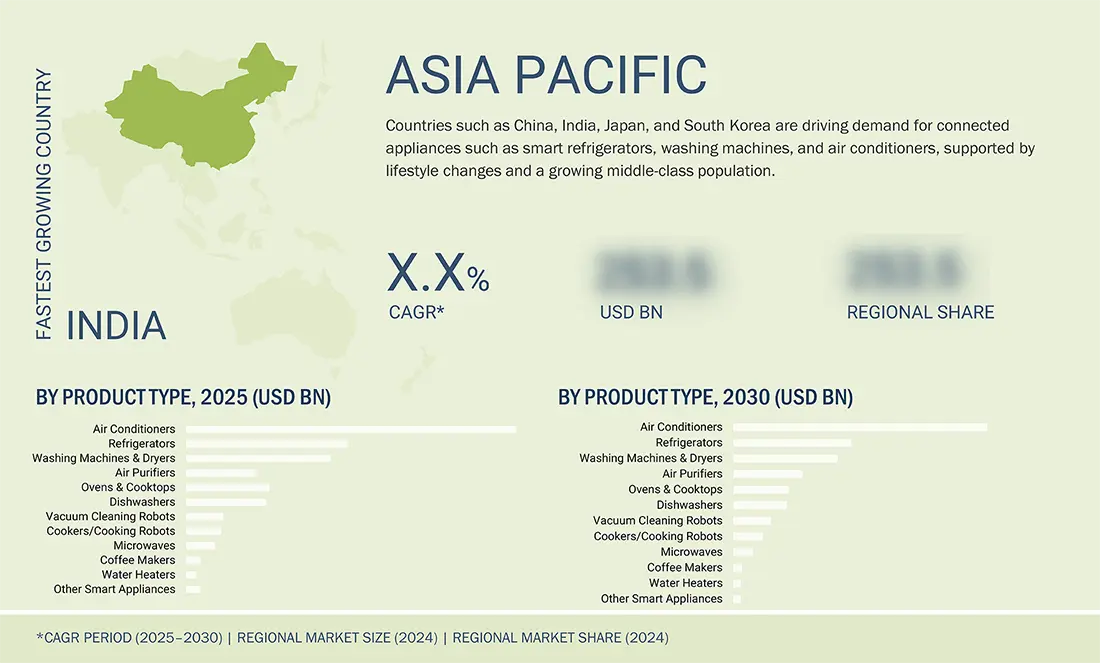
BY REGIONAsia Pacific is expected to register the highest CAGR of 13.1%, fueled by rapid urbanization, rising disposable incomes, and increasing adoption of smart home technologies.
-
COMPETITIVE LANDSCAPEThe major market players have adopted organic and inorganic strategies, including partnerships and investments. For instance, Midea announced a strategic alliance with Ferencvárosi Torna Club (FTC) to strengthen its presence in Central Europe. This sponsorship aligns Midea's innovation-driven brand with Hungary's top football club, enhancing local engagement and showcasing energy-efficient solutions.
Home Appliances Industry analysis
The home appliances industry analysis ana is projected to grow significantly, fueled by rising consumer demand for convenience, energy efficiency, and connected living. Products such as smart refrigerators, washing machines, ovens, and vacuum robots are increasingly integrated with IoT and AI to enhance user experience and sustainability. Growing smart home adoption, digitalization, and eco-friendly innovations are key factors shaping this market expansion.Urbanization, increased disposable incomes, and shifting consumer lifestyles are all contributing factors to the home appliances industry analysis consistent rise. Sales of large appliances including refrigerators, washing machines, air conditioners, and kitchen appliances have increased due to the growing desire for convenience, energy efficiency, and time-saving solutions. Rapid housing building and expanding middle-class populations are major factors contributing to market expansion in emerging economies. Meanwhile, as consumers replace outdated appliances with more contemporary, feature rich models, replacement demand in developed nations keeps the sector stable.The home appliances industry analysis indicates strong growth driven by rising adoption of smart, connected devices and increasing consumer demand for energy-efficient solutions. Advancements in IoT, AI integration, and remote monitoring features are reshaping the market landscape. As smart appliances become mainstream, manufacturers are focusing on innovation and enhanced user experience to stay competitive.
Source: Secondary Research, Interviews with Experts, MarketsandMarkets Analysis
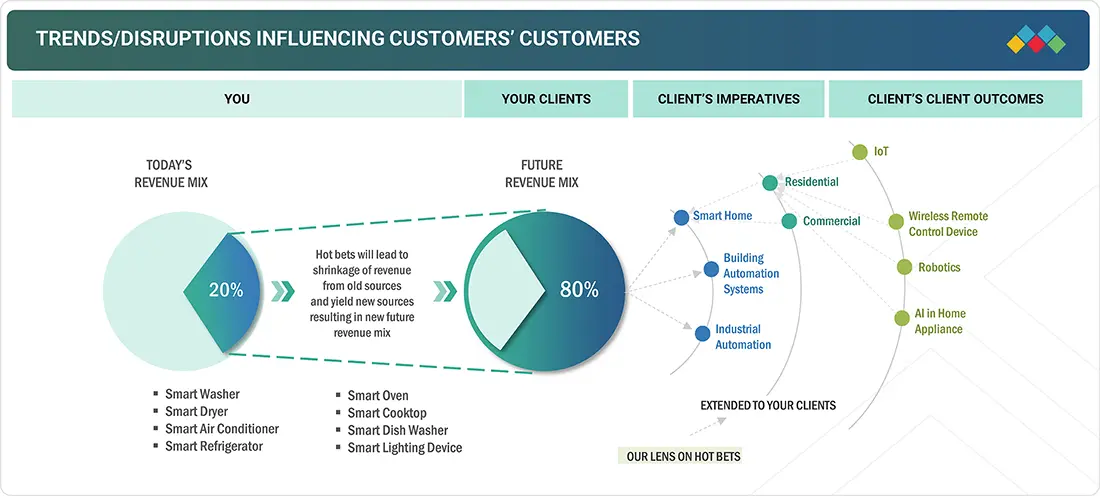
TRENDS & DISRUPTIONS IMPACTING CUSTOMERS' CUSTOMERS
Customer trends are reshaping the smart appliances industry, with IoT enabling cloud connectivity, predictive maintenance, and remote monitoring. Consumers demand energy-efficient, sustainable, and interoperable devices with AI-driven personalization. Growing focus on data security, affordability, and service-oriented models transforms appliances from standalone products into connected solutions within smart home ecosystems.
Source: Secondary Research, Interviews with Experts, MarketsandMarkets Analysis
MARKET DYNAMICS
Level
-
Rising global adoption of internet and smartphones

-
Expanding network of wireless connectivity solutions

Level
-
Data privacy concerns among consumers

Level
-
Better voice assistant integration and smart ecosystem connectivity

-
Cloud-based analytics for performance optimization and service innovation

Level
-
High costs of smart appliance installation

-
Interoperability issues among devices from different manufacturers

Source: Secondary Research, Interviews with Experts, MarketsandMarkets Analysis
Driver: Rising Global Adoption of Internet and Smartphones
Smart appliances rely on internet connectivity to deliver advanced features, and increasing global internet penetration has accelerated their adoption. The growing number of smartphone users further supports this trend, as appliances can now be monitored and controlled remotely through mobile apps. The convenience of managing multiple household devices via a single interface enhances consumer appeal. Companies such as LG, Panasonic, Xiaomi, and Control4 are leveraging this shift to expand personalized smart living solutions.
Restraint: Data Privacy Concerns Among Consumers
Data privacy remains a significant barrier to smart appliance adoption as these devices collect sensitive user information through brand-specific apps. Rising incidents of data breaches and internet crimes, with US losses exceeding USD 16 billion in 2024, heighten concerns. Many consumers fear unauthorized data sharing, with 68% reporting privacy worries in 2025. Regulatory bodies, including the Federal Trade Commission, enforce stricter actions against companies failing to protect user data.
Opportunity: Better Voice Assistant Integration and Smart Ecosystem Connectivity
Improved voice assistant integration and ecosystem connectivity drive smart appliance growth. Compatibility with Amazon Alexa, Google Assistant, and Apple Siri enables hands-free control and enhances convenience in daily routines. Connecting appliances with broader smart ecosystems, covering lighting, security, HVAC, and entertainment, creates unified control experiences. For manufacturers, this fosters brand loyalty and data-driven services, while in commercial sectors, it boosts efficiency, accessibility, and predictive maintenance, strengthening global adoption.
Challenge: High Cost of Smart Appliance Installation
Smart appliances remain costlier than traditional ones, with installation expenses ranging from USD 50 to USD 1,000, depending on the setup. While these devices offer long-term efficiency, high upfront investment discourages many consumers. In developed markets, affordability remains a concern for advanced models, while in emerging economies such as India and China, even basic appliances are out of reach. These cost barriers limit global market expansion despite rising awareness of long-term benefits.
Smart Appliances Market: COMMERCIAL USE CASES ACROSS INDUSTRIES
| COMPANY | USE CASE DESCRIPTION | BENEFITS |
|---|---|---|
 |
Panasonic introduced a facial recognition system at Denmark’s football stadium to enhance security by identifying and preventing troublemakers from entering. | Improved stadium safety | Reduced manual checks | Encouraged fans and families to return to matches |
 |
Haier implemented IoT-based Smart Laundry solutions in China, integrating mobile apps for cycle monitoring and predictive maintenance. | Reduced equipment downtime | Improved customer experience | Lowered operational costs for service providers |
 |
Whirlpool partnered with Amazon Alexa and Google Assistant to enable voice-controlled smart ovens, dishwashers, and washing machines. | Increased consumer convenience | Seamless integration with connected home ecosystems | Better appliance efficiency monitoring |
 |
LG Electronics introduced ThinQ-enabled AI smart refrigerators in Europe, providing automated grocery tracking and energy-saving modes. | Enhanced food management | Reduced energy consumption | Improved sustainability by minimizing food waste |
 |
Miele rolled out Wi-Fi–enabled dishwashers and ovens with remote diagnostics and smart cooking programs in Germany. | Boosted customer satisfaction through predictive maintenance | Better food preparation outcomes | Reduced servicing delays |
Logos and trademarks shown above are the property of their respective owners. Their use here is for informational and illustrative purposes only.
MARKET ECOSYSTEM
The smart appliances market ecosystem comprises appliance manufacturers, connectivity and IoT platform providers, component and technology suppliers, retailors and distributors, and after-sales service providers. This integrated network supports developing, connecting, and adopting smart home appliances and smart kitchen appliances, enabling enhanced user convenience, energy efficiency, and automation. The ecosystem delivers end-to-end solutions for connected living across households and commercial applications, from hardware production and cloud integration to retail distribution and maintenance services.
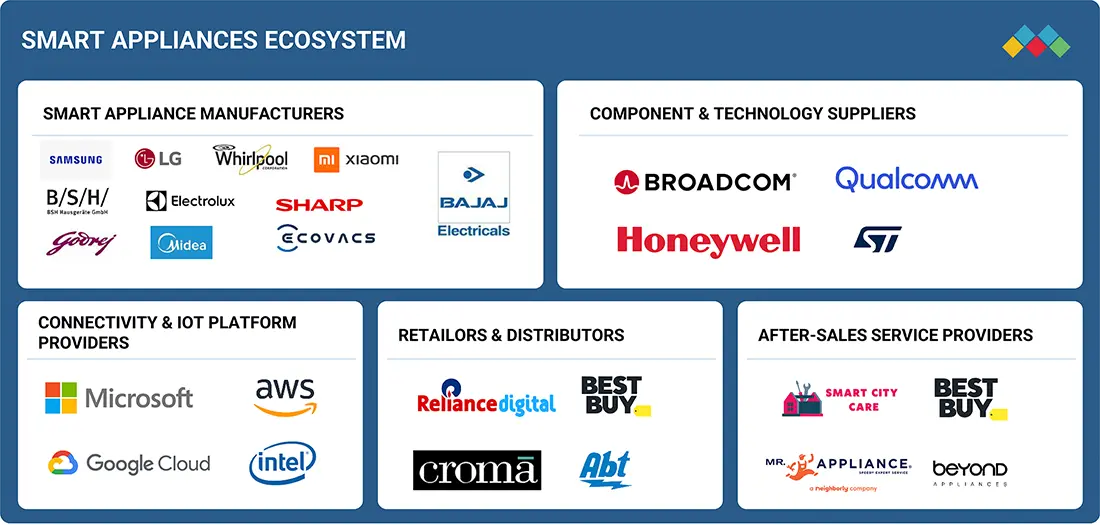
Logos and trademarks shown above are the property of their respective owners. Their use here is for informational and illustrative purposes only.
MARKET SEGMENTS
Source: Secondary Research, Interviews with Experts, MarketsandMarkets Analysis
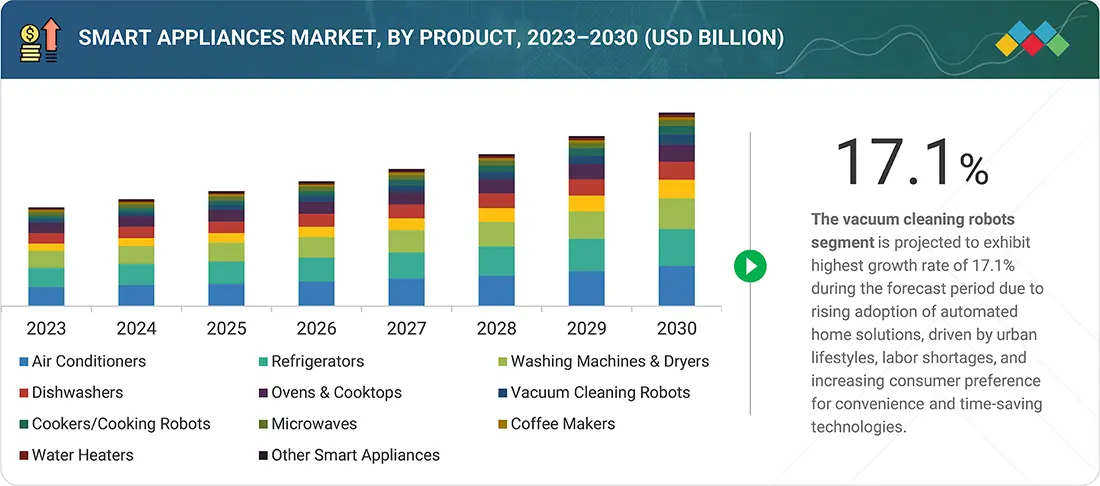
Smart Appliance Market, by Product
Air conditioners dominate the smart appliances market due to rising demand for energy-efficient, connected cooling solutions. Global warming, urbanization, and smart home adoption drive market. Features such as AI-powered temperature control, voice assistants, remote monitoring, and IoT-based energy optimization enhance comfort and cost savings. Supportive government energy regulations, inverter technologies, strong demand across residential, commercial, and industrial sectors, and innovations from leading brands further accelerate smart air conditioner adoption.
Smart Appliance Market, by Connectivity
The Wi-Fi segment leads the smart appliances market owing to its broad adoption, seamless integration, and compatibility with smart home systems. Wi-Fi enables remote monitoring and control of devices such as refrigerators, washing machines, and air conditioners via smartphones and voice assistants. High-speed data transfer supports AI-driven recommendations, predictive maintenance, and real-time monitoring. Rising internet penetration, home automation demand, and manufacturers’ integration of Wi-Fi as a standard feature further drive its dominance.
Smart Appliance Market, by Vertical
The residential segment dominates the smart appliances market, driven by rising adoption of connected devices that enhance convenience, energy efficiency, and comfort. Consumers are increasingly using smart refrigerators, air conditioners, washing machines, and lighting systems controllable via smartphones and voice assistants. Growing smart home adoption, IoT integration, urbanization, and higher incomes further fuel demand. Manufacturers’ focus on Wi-Fi-enabled, AI-powered appliances tailored for households solidifies residential use as the leading vertical in the global market.
Smart Appliance Market, by Sales Channel
The offline sales channel holds the largest share of the smart appliances market as consumers prefer physically experiencing products before purchase, particularly high-value items such as refrigerators and washing machines. In-store demonstrations, consultations, and immediate availability enhance confidence, while services including installation and warranties build trust. In emerging markets, traditional retail dominance and limited digital adoption sustain offline sales, further supported by manufacturers’ partnerships with retail chains to expand product reach and strengthen market leadership.
REGION
During the forecast period, the Asia Pacific is expected to be the fastest-growing region in the global smart appliances market.
The Asia Pacific region is expected to witness the fastest growth rate in the smart appliance industry due to rapid urbanization, rising disposable incomes, and increasing adoption of smart home technologies. Countries such as China, India, Japan, and South Korea drive demand for connected appliances such as smart refrigerators, washing machines, and air conditioners, supported by lifestyle changes and a growing middle-class population. The region benefits from strong manufacturing infrastructure, the presence of global appliance brands, and government initiatives promoting energy efficiency and smart city development. Expanding internet connectivity, high smartphone penetration, and continuous AI- and IoT-driven innovations further accelerate adoption.
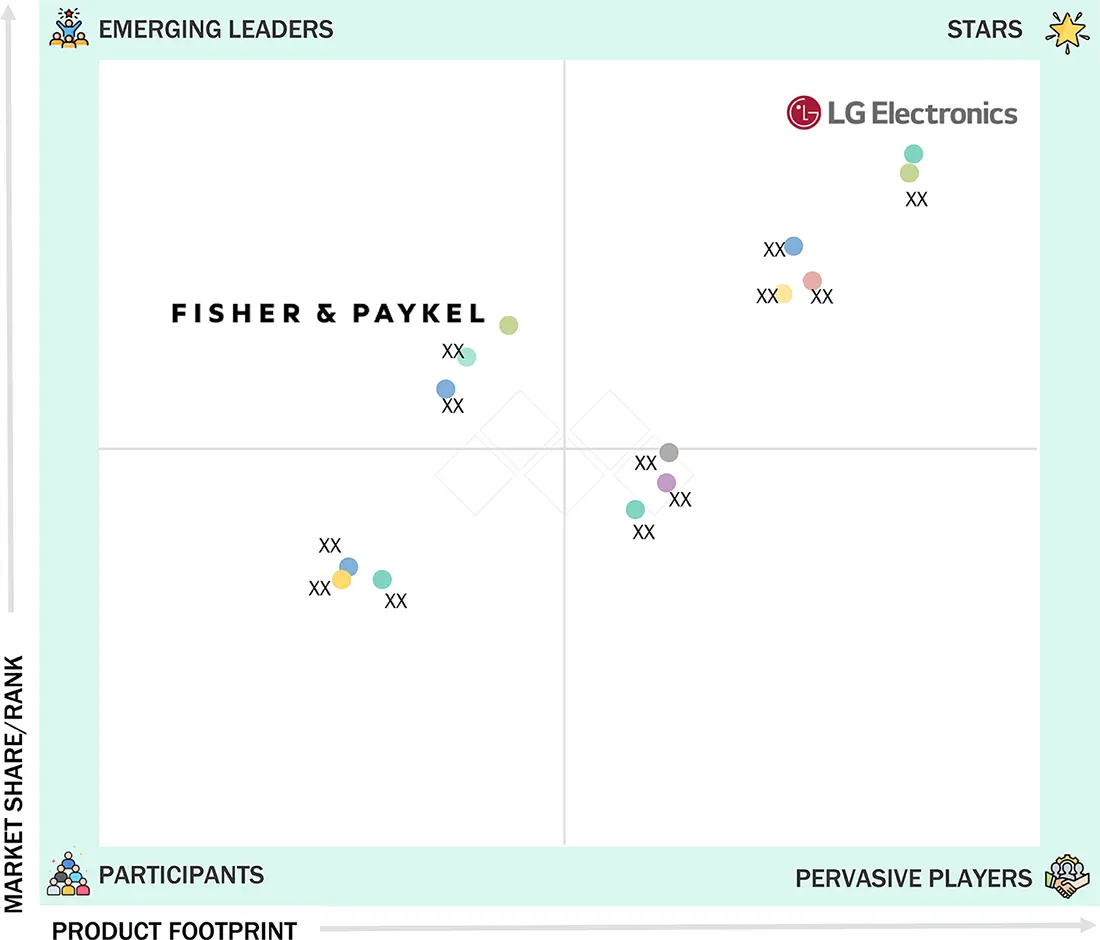
Smart Appliances Market: COMPANY EVALUATION MATRIX
In the smart appliances companies matrix, LG Electronics and Samsung (Stars) lead with strong market presence and extensive product portfolios, driving widespread adoption across industries and households. Their innovation and global reach position them as dominant smart appliance players. Fisher & Paykel (Emerging Leader) is gaining traction by enhancing its product footprint and steadily expanding its market influence, positioning itself as a growing player in the industry.
Source: Secondary Research, Interviews with Experts, MarketsandMarkets Analysis
KEY MARKET PLAYERS
- SAMSUNG (South Korea)
- LG Electronics (South Korea)
- Panasonic Corporation (Japan)
- Whirlpool (US)
- GE Appliances, a Haier company (US)
- AB Electrolux (Sweden)
- Midea (China)
- BSH Hausgeräte GmbH (Germany)
- Xiaomi (China)
- Miele & Cie. KG (Germany)
- Fisher & Paykel Appliances Ltd (New Zealand)
- Hangzhou Robam Appliances Co., Ltd. (China)
- Havells India Ltd. (India)
- Godrej Enterprises (India)
- Bajaj Electricals Limited (India)
WHAT IS IN IT FOR YOU: Smart Appliances Market REPORT CONTENT GUIDE
DELIVERED CUSTOMIZATIONS
We have successfully delivered the following deep-dive customizations:
| CLIENT REQUEST | CUSTOMIZATION DELIVERED | VALUE ADDS |
|---|---|---|
| US-based Smart Appliances Provider | Competitive analysis with market share & growth rates Detailed TAM, SAM, and SOM analysis with 5 to 7-year CAGR projections Benchmarking against key competitors (market share, product features, pricing strategies) | Enables understanding of demand trends and investment opportunities across key sectors Provides insights for differentiation & positioning Supports financial analysis and investment evaluation |
| India-based Smart Appliances Provider | India market numbers: Size, CAGR, household penetration rates, Tier-1 vs. Tier-2/3 demand split Competitive landscape in India: Pricing, market share of Samsung, LG, Whirlpool, Voltas, etc. Distribution channels: Online (Flipkart, Amazon, Tata Neu) vs. offline (Croma, Reliance Digital) | Helps identify growth hotspots and prioritize regional expansion. Provides benchmarking insights to fine-tune pricing, features, and positioning Optimizes channel strategy by balancing reach (online) and trust (offline retail) |
| Europe-based Smart Appliances Startup | Competitor mapping (Bosch, Siemens, Electrolux, Haier presence) Go-to-market strategy (retail partnerships vs. D2C, e-commerce penetration) Tech adoption trends (Alexa/Google Home interoperability, sustainability-first appliances) | Identifies white space opportunities and helps craft differentiation strategy Build a scalable entry plan with the right channel mix Ensures future-ready product design aligned with consumer demand. |
RECENT DEVELOPMENTS
- July 2025 : Midea partnered with Ferencvárosi Torna Club (FTC) to strengthen its presence in Central Europe. This sponsorship aligns Midea's innovation-driven brand with Hungary's top football club, enhancing local engagement and showcasing energy-efficient solutions.
- June 2025 : BSH Hausgeräte GmbH inaugurated its first African production facility in Cairo, Egypt, marking a strategic expansion into the region. This expansion aims to strengthen local manufacturing, create 1,000 jobs, and support growth across African and Middle Eastern markets.
- June 2025 : Xiaomi launched the Mijia Air Conditioner Pro Eco Inverter, featuring proprietary AI for adaptive cooling that adjusts automatically to room conditions. The unit provides more efficient climate control than conventional models.
- June 2025 : Samsung launched the 2025 Bespoke AI appliance range in India, expanding the AI Home experience across refrigerators, washers, and air conditioners, reflecting the brand's 'Screens Everywhere' vision.
- May 2025 : Xiaomi and Qualcomm Technologies extended their multi-year partnership to enhance smart home innovation. Xiaomi integrated Qualcomm's advanced Wi-Fi solutions, including Wi-Fi 7, into its connected appliance ecosystem. This collaboration supports seamless connectivity and performance across Xiaomi's expanding smart home product lineup.
- March 2025 : Whirlpool of India launched its 2025 Air Conditioner range featuring 6th Sense Technology, designed to sense and adapt to users' intuitive needs for optimal cooling. Enhanced with 3D Cool Technology and smart sensors, it delivers personalized comfort with high energy efficiency.
Table of Contents
 Exclusive indicates content/data unique to MarketsandMarkets and not available with any competitors.
Methodology
The study used four major activities to estimate the market size of smart appliances. Exhaustive secondary research was conducted to gather information on the market and its peer and parent markets. The next step was to validate these findings, assumptions, and sizing with industry experts across the value chain through primary research. Both top-down and bottom-up approaches were employed to estimate the total market size. Finally, market breakdown and data triangulation methods were utilized to estimate the market size for different segments and subsegments.
Secondary Research
The research methodology used to estimate and forecast the size of the smart appliances market began with the acquisition of data related to the revenues of key vendors in the market through secondary research. Various secondary sources have been referred to in the secondary research process to identify and collect information for this study. Secondary sources include annual reports, press releases, and investor presentations of companies; white papers, journals, certified publications, and articles by recognized authors; websites; directories; and databases. Secondary research has mainly been used to obtain key information about the value chain of the smart appliances market, key players, market classification, and segmentation according to the industry trends to the bottom-most level, geographic markets, and key developments from both market and technology-oriented perspectives. The secondary research referred to for this research study involves various white papers, such as User Interface Design for Smart Appliances, Study on Smart Appliances, Next-Generation Smart Home: Building for the Future, and various other sources. Moreover, the study involved extensive use of secondary sources, directories, and databases, such as Hoovers, Bloomberg Businessweek, and Factiva, to identify and collect valuable information for a technical, market-oriented, and commercial study of the smart appliances market.
Primary Research
In the primary research process, various primary sources from both the supply and demand sides have been interviewed to obtain the qualitative and quantitative information relevant to this report. Primary sources from the supply side include key industry participants, subject-matter experts (SMEs), and C-level executives and consultants from various key companies and organizations in the smart appliances ecosystem. After the complete market engineering (including calculations for the market statistics, the market breakdown, the market size estimations, the market forecasting, and the data triangulation), extensive primary research has been conducted to verify and validate the critical market
numbers obtained. Several primary interviews have been conducted with market experts from the demand and supply-side players across key regions: North America, Europe, Asia Pacific, and the Rest of the World (Middle East, Africa, and South America).
Primary data has been collected through questionnaires, emails, and telephone interviews. In the canvassing of primaries, various departments within organizations, such as sales, operations, and administration, were covered to provide a holistic viewpoint in our report. This and the opinions of in-house subject matter experts have led us to the findings described in the remainder of this report.

Note: The three tiers of the companies are defined based on their total revenue in 2024: Tier 1 - revenue greater than or equal to USD 1 billion; Tier 2 - revenue between USD 100 million and USD 1 billion; and Tier 3 revenue less than or equal to USD 100 million. Other designations include sales managers, marketing managers, and product managers.
To know about the assumptions considered for the study, download the pdf brochure
Market Size Estimation
Both top-down and bottom-up approaches were utilized to estimate and validate the size of the smart appliances market and its submarkets. Secondary research was conducted to identify the key players in the market, and primary and secondary research were used to determine their market share in specific regions. The entire process involved studying top players' annual and financial reports and conducting extensive interviews with industry leaders such as CEOs, VPs, directors, and marketing executives. Secondary sources were used to determine all percentage shares and breakdowns, which were verified through primary sources. All parameters that could impact the markets covered in this research study were accounted for, analyzed in detail, verified through primary research, and consolidated to obtain the final quantitative and qualitative data.
Smart Appliances Market : Top-Down and Bottom-Up Approach

Data Triangulation
Once the overall size of the smart appliances market was determined using the methods described above, it was divided into multiple segments and subsegments. Market engineering was performed for each segment and subsegment using market breakdown and data triangulation methods, as applicable, to obtain accurate statistics. To triangulate the data, various factors and trends from the demand and supply sides were studied. The market was validated using both the top-down and bottom-up approaches.
Market Definition
The smart appliances market comprises a wide range of connected and intelligent household and commercial devices that enhance convenience, efficiency, and energy management. These offerings are designed to simplify daily tasks, optimize energy consumption, and provide seamless user experiences. Smart appliances are segmented by product type into refrigerators, washing machines and dryers, dishwashers, ovens and cooktops, air conditioners, water heaters, microwaves, coffee makers, vacuum cleaning robots, air purifiers, cookers/cooking robots, and other smart appliances.
By connectivity type, these appliances leverage Wi-Fi and Bluetooth to enable remote control, automation, and integration into broader smart home ecosystems. Through online and offline sales channels, smart appliances are accessible to both residential and commercial consumers, supporting daily operations, convenience, and energy efficiency. Smart appliances contribute to sustainable living, smarter energy usage, and more connected, intuitive environments, driving adoption across urban and emerging markets globally.
Key Stakeholders
- Manufacturers and suppliers
- Component Suppliers
- Software & Platform Providers
- Distributors & Retailers
- System Integrators & Service Providers
- Telecom & Connectivity Providers
- Regulatory & Standards Bodies
- End-user industries
- Research & Development Firms
Report Objectives
- To estimate and forecast the size of the smart appliances market, in terms of value, based on product, connectivity, sales channel, vertical, and region
- To describe and forecast the market size, in terms of value, for four major regions - North America, Europe, Asia Pacific, and the Rest of World (RoW)
- To provide detailed information regarding major factors such as drivers, restraints, opportunities, and challenges influencing market growth
- To provide a detailed overview of the smart appliances value chain
- To strategically analyze micromarkets regarding individual market trends, growth prospects, and contributions to the total market
- To strategically profile key players and comprehensively analyze their market position in terms of ranking and core competencies, along with a detailed competitive landscape for the market leaders
- To analyze major growth strategies such as product launches/developments and acquisitions adopted by the key market players to enhance their market position
- To assess the impact of AI on the growth and adoption of the smart appliances market
Available Customizations
With the given market data, MarketsandMarkets offers customizations according to the specific requirements of companies. The following customization options are available for the report:
- Detailed analysis and profiling of additional market players (up to 5)
- Additional country-level analysis of the smart appliances market
Product Analysis
- Product matrix, which provides a detailed comparison of the product portfolio of each company in the smart appliances market.
Key Questions Addressed by the Report
What is the current size of the global Smart Appliances Market?
The global Smart Appliances Market was valued at USD 39.38 billion in 2024 and is estimated to reach USD 42.35 billion in 2025.
What is the projected market size of the Smart Appliances Market by 2030?
The market is projected to reach USD 71.28 billion by 2030, driven by increasing adoption of connected home technologies.
What is the expected CAGR of the Smart Appliances Market?
The Smart Appliances Market is expected to grow at a CAGR of 11.0% during 2025–2030.
What are the major growth drivers of the Smart Appliances industry?
Key growth drivers include increasing adoption of IoT, AI, cloud connectivity, smart homes, energy-efficient appliances, and remote monitoring capabilities.
Which region is expected to witness the highest growth in the Smart Appliances Market?
Asia Pacific is expected to register the highest CAGR of 13.1% through 2030 due to rapid urbanization, rising disposable incomes, and smart home adoption.
Which connectivity technology dominates the Smart Appliances Market?
Wi-Fi-enabled appliances dominate the market because they provide seamless integration with smart home ecosystems, mobile apps, and voice assistants.
Which product segment leads the Smart Appliances Market?
Smart Air Conditioners currently dominate the market due to demand for energy-efficient cooling, IoT connectivity, and AI-powered temperature management.
Which product category is expected to grow the fastest?
Vacuum Cleaning Robots are expected to be the fastest-growing segment owing to increasing demand for automated home cleaning and AI-enabled navigation technologies.
Who are the leading companies operating in the Smart Appliances Market?
Major players include Samsung Electronics, LG Electronics, Panasonic Corporation, Whirlpool Corporation, GE Appliances, Electrolux, Midea Group, and Xiaomi.
What key insights does the MarketsandMarkets report provide?
The report provides analysis across products, connectivity types, sales channels, regions, competitive landscape, market forecasts (2021–2030), growth factors, trends, and strategic developments, covering approximately 230 pages and 150 market tables.
Need a Tailored Report?
Customize this report to your needs
Get 10% FREE Customization
Customize This ReportPersonalize This Research
- Triangulate with your Own Data
- Get Data as per your Format and Definition
- Gain a Deeper Dive on a Specific Application, Geography, Customer or Competitor
- Any level of Personalization
Let Us Help You
- What are the Known and Unknown Adjacencies Impacting the Smart Appliances Market
- What will your New Revenue Sources be?
- Who will be your Top Customer; what will make them switch?
- Defend your Market Share or Win Competitors
- Get a Scorecard for Target Partners

Custom Market Research Services
We Will Customise The Research For You, In Case The Report Listed Above Does Not Meet With Your Requirements
Get 10% Free CustomisationTESTIMONIALS

Tetsuya Ohhira
Business Development Manager-Technology Business
Nikon Corporation,
Leading Japanese MNC specializing in optics and imaging productswww.nikon.com
MarketsandMarkets™ response
is quick. Their attitude is flexible and positive. Analyst Insights are globally considered and
significant. Client Services quickly respond to our inquiry and demand. Their wide range of global
surveys help us make our strategic plan.
We hope Knowledge Store will be easier to search
for a report.
VP - Marketing & Business Development
Leading Provider of Process Control Solutions
We engaged with MarketsandMarkets on a study to perform an analysis and recommend a Go-To-Market strategy for metrology and process control in the semiconductor market. The study was tailored to our targets and needs with well-defined milestones. Our overall experience with the MarketsandMarkets team was very good throughout the project in all aspects including the analysis methodologies used, the quality and depth of primary and secondary data sets, the professionalism and flexibility of the team and the ability to meet the target schedule and milestones. We want to thank MarketsandMarkets team for a job well done.


Growth opportunities and latent adjacency in Smart Appliances Market