Global Active, Smart and Intelligent Packaging Market By Products , Applications ,Trends and Forecasts (2010-2015)


Owing to increasing urban lifestyle and global population trends, the demand for packaged, frozen, and ready-to-eat food has witnessed a significant surge in demand in recent times. With supply of exotic fruits and vegetables, meat products and frozen foods transcending geographical boundaries, the packaging industry has been focusing on development of solutions that provide maximum food security while maintaining nutritional value at competitive prices.
The food and beverage packaging has dramatically shifted from traditional to advanced packaging. Traditional packaging only addresses issues related to protection from external factors. However, advanced packaging interacts internally (active packaging) and externally (intelligent packaging) with the environment and enhances the visual appeal of the products. Therefore, manufacturers of food and beverages and packaging manufacturers are looking into the way the physical, chemical and microbial textures change inside the packaged food.
Global advanced packaging technology market is witnessing a high growth due to the increase in demand for convenience food such as ready-to-cook meal, stricter food safety regulations, and demand for sustainable packaging. Growing health awareness among consumers, food wastage, and manufacturers� concern for longer shelf life of the food products and supply chain inefficiencies are the other factors fueling the growth of the market. Further, the consumers� confidence with regards to packaged food, organized food safety regulations, threat from bioterrorism, and increased applications in ready-to-eat meals and frozen foods have created a huge opportunity for advanced packaging technology market. In 2010, the active and intelligent packaging technology held the highest growth rate, estimated at a CAGR of 10.5% and 12.1% respectively from 2010 to 2015. Modified atmosphere technology accounted for largest share (approximately 54%) of the total market in advanced packaging technology. The global advanced packaging technology is estimated to grow at a CAGR of 8.2% from 2010 to 2015.
The application market for advanced packaging technology includes food, beverage, pharma, beauty, and others segments. Food and beverage are the two largest segments contributing to the packaging technologies mentioned above. From the consumption side, these two segments form the largest market share and are prone to microbial attack, easily change their physical and chemical texture when exposed to oxygen, and stringent food safety regulations.
Out of the total market for the global advanced packaging, the contribution of food sector is 51%, while that of beverage is 19%. Active packaging is mainly used for food packaging, which enhances the food quality with flavor, taste, color. Intelligent packaging is used for both - food and beverage packaging.
New technologies such as intelligent packaging, smart packaging, active, and modified atmosphere packaging are replacing traditional methods such as canning. The industry is expected to witness significant growth in the years to come. Similar to the other aspects in the food industry, this market is also highly regulated with strict guidelines for packaging materials, testing, and labeling. Another emerging technology in the market is nanotechnology. Nanomaterials have various applications; both in active and intelligent packaging. In active packaging, the nanostructures that can enhance the vapor permeability of plastics are used. They have various applications such as fruits and vegetables packaging. The nanosensors categorized under intelligent packaging can help in detecting pathogens, toxins, and chemicals. With nanosensors incorporated inside the packaging, the consumer can easily know the status of food inside, which means these sensors can inform the consumers about the food�s freshness level and nutrition status.
The major players in advanced packaging technology market are Multisorb Technologies (U.S.), Sealed Air Corporation (U.S.), Ball Corporation (U.S.); Amcor limited (Australia), Timestrip PLC (U.K.), Sysco Corporation (U.S.), Paksense Incorporated (U.S.), Eastman Chemical Company, and M&G USA Corporation. These players have launched new products in active and intelligent packaging technology as a part of their major strategy.
Scope of the report
This research report categorizes the global market for packaging technology for food and beverages on the basis of applications, technology, and geography; forecasting revenues and analyzing trends in each of the following submarkets:
On the basis of technology: Active packaging, modified atmosphere, and intelligent packaging technology.
On the basis of applications: Seafood, meat and poultry, soup, dairy products, confectionaries, fruits and vegetables and ready to eat meal segment.
On the basis of geography: North America, Europe, Asia, ROW
Global Active, Smart and Intelligent Packaging Market (2010-2015)
The increasing demand for fresh and quality packaged food, consumer convenience and manufacturers� concern for longer shelf life of the food products are driving the market for global active and smart packaging technology for food and beverage market. The global market for active and smart packaging technology for food and beverage is expected to grow from $15.798 million in 2010 to $23,474 million in 2015, at a CAGR of 8.2% from 2010 to 2015. Modified atmosphere packaging commands the largest share of the overall active and smart packaging technology in terms of value, while smart and intelligent packaging technology is witnessing the fastest growth at a CAGR of 12.1%.
Share of Advanced Packaging Technology Breakup, By Types (2010)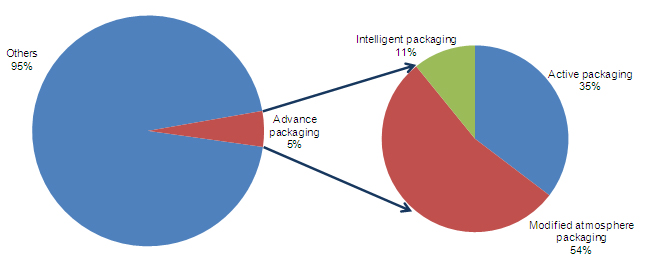
Source: MarketsandMarkets
In 2010, advanced packaging accounted for just 5% of the overall packaging market. The advanced packaging market is dominated by MAP (Modified Atmosphere Packaging), which accounted for over 50% of the total advanced packaging market in 2010.
Active and smart packaging technology offers tremendous potential to fulfill the growing demand of food safety in various applications which include dairy products, meat and poultry, ready-to-eat meal segment. In active packaging, oxygen scavengers and moisture absorbers form the two largest product segments. Both are estimated to grow at a CAGR of 8% and 11.9% respectively.
North America is the major market for active and smart packaging technology due to increasing health awareness among the consumers. Therefore, it holds the largest share (35.1%) of the global active and smart packaging market. Europe forms the second largest market for active and smart packaging technology due to increased demand for sustainable packaging and stringent regulations.
Currently, the market players are focusing on development of new products. Due to this reason, new product development accounted for the highest share of the total competitive developments in the global advanced packaging technology market for food and beverage from June 2008 to September 2010. Maximum developments are seen in oxygen scavenger product segment.
 Exclusive indicates content/data unique to MarketsandMarkets and not available with any competitors.
TABLE OF CONTENTS
EXECUTIVE SUMMARY
� Market overview
� Market scenario
� Emerging technologies
1 INTRODUCTION
1.1 Key take-aways
1.2 Report description
1.3 Markets covered
1.4 Stakeholders
1.5 Research methodology
2 SUMMARY
3 MARKET OVERVIEW
3.1 Porter�s five forces analysis
3.1.1 Degree of competition
3.1.2 Supplier power
3.1.3 Buyer power
3.1.4 Threat from substitutes
3.1.5 Threat of new entrants
3.2 Defining the global advanced packaging market
3.3 Evolution of food and beverage packaging
3.4 Global advanced packaging technology market
3.5 Advanced packaging technology by applications
3.6 Role of advanced packaging
3.7 Value chain analysis
3.8 Patent analysis
4 ADVANCED PACKAGING TECHNOLOGIES
4.1 Active packaging
4.1.1 Drivers
4.1.1.1 Increasing demand for fresh and quality packaged food
4.1.1.2 Manufacturers� concerns for longer shelf life
4.1.1.3 Demand for sustainable packaging
4.1.1.4 Demand for safe and healthy packaged food
4.1.2 Restraints
4.1.2.1 Increased testing costs
4.1.2.2 Harmful effects of packaging materials on human body
4.1.3 Regulatory challenges
4.1.4 Opportunities
4.1.4.1 Consumers gaining confidence on food safety
4.1.4.2 Packaging as a tool for product differentiation
4.2 Global active packaging: by sub segments
4.2.1 Oxygen scavengers
4.2.2 Carbon dioxide scavengers
4.2.3 Ethylene scavengers
4.2.4 Preservative releaser
4.2.5 Ethanol emitter
4.2.6 Moisture absorbers
4.2.7 Flavor/Odor absorbers
4.2.8 Temperature control packaging
4.2.9 Antimicrobial packaging
4.2.9.1 Materials used as antimicrobial agents
4.2.9.2 Edible films and coatings
4.2.9.3 Regulations
4.2.9.4 Challenges
4.2.10 Nanotechnology in active packaging
4.2.10.1 Nanocomposite
4.2.11 Developments in Nanotechnology
4.2.11.1 Carbon Nanotubes
4.2.11.2 Nano based polymers
4.2.11.3 Nanowheels
4.3 Modified atmosphere packaging
4.3.1 Challenges in modified atmosphere packaging (MAP)
4.3.1.1 Map is not a substitute for temperature control
4.3.1.2 Providing the right mix of gases in MAP technology
4.4 Modified Atmosphere packaging by types
4.5 Intelligent packaging technology
4.5.1 Drivers
4.5.1.1 Product monitoring capability
4.5.1.2 Increasing number of counterfeit products
4.5.2 Restraints
4.5.2.1 High implementation cost
4.5.2.2 Increasing raw material cost
4.5.2.3 Consumers fear loss of privacy
4.5.3 Opportunities
4.5.3.1 Brand promotion
4.5.3.2 Scope in developing economies
4.5.3.3 Increasing demand for organic food
4.5.4 Freshness indicator
4.5.5 Time/Temperature indicators
4.5.5.1 Importance to cold chain management
4.5.6 Thermochromatic inks
4.5.6.1 Ideal temperature indicator for consumption
4.5.6.2 Challenges
4.5.6.2.1 Shortage of raw materials
4.5.7 Radio frequency identification (RFID)
4.5.7.1 Advantages
4.5.7.2 Tracking products throughout the supply chain
4.6 Other intelligent packaging technologies
4.6.1 Moisture indicators
4.6.2 Gas indicators
4.6.3 Physical shock indicators
4.6.4 Nanotechnology in intelligent packaging
4.6.4.1 Nanosensors
4.6.4.2 DNA biochips
5 APPLICATIONS
5.1 Introduction
5.2 Packaged food
5.2.1 Sea food
5.2.2 Meat and poultry
5.3 Frozen processed food by types
5.4 Dairy
5.5 Chilled processed food
5.6 Dried processed food
6 COMPETITIVE LANDSCAPE
6.1 Introduction
6.2 New product development account for 82% of all strategic developments
6.3 Maximum developments in active packaging technology
6.4 Maximum developments in oxygen scavengers (June 2008 � September 2010)
6.5 Multisorb technologies and sealed air corporation leads in the number of developments
7 GEOGRAPHICAL ANALYSIS
8 REGULATIONS
8.1 U.S.
8.1.1 U.S. food-contact regulations
8.1.2 U.S. food package labeling requirements
8.2 EU food contact and package labeling regulations
8.3 Food-contact regulations: Asia-Pacific
8.3.1 Food packaging regulations in China
8.3.2 Food contact regulations in Australia & New Zealand
8.3.3 Food packaging materials regulation in Australia and New Zealand
9 COMPANY PROFILES
9.1 AMCOR LIMITED
9.1.1 Overview
9.1.2 Product portfolio
9.1.3 Strategy
9.1.4 Developments
9.2 AMPACET CORPORATION
9.2.1 Overview
9.2.2 Product portfolio
9.2.3 Strategy
9.2.4 Developments
9.3 BALL CORPORATION
9.3.1 Overview
9.3.2 Product portfolio
9.3.3 Strategy
9.3.4 Developments
9.4 BEMIS COMPANY, INC.
9.4.1 Overview
9.4.2 Product portfolio
9.4.3 Strategy
9.4.4 Developments
9.5 CONSTAR INTERNATIONAL INC.
9.5.1 Overview
9.5.2 Product portfolio
9.5.3 Strategy
9.5.4 Developments
9.6 CROWN HOLDINGS INC.
9.6.1 Overview
9.6.2 Product portfolio
9.6.3 Strategy
9.6.4 Developments
9.7 W. R. GRACE & CO.
9.7.1 Overview
9.7.2 Product portfolio
9.7.3 Strategy
9.7.4 Developments
9.8 GRAHAM PACKAGING COMPANY INC.
9.8.1 Overview
9.8.2 Product portfolio
9.8.3 Strategy
9.8.4 Developments
9.9 INNOVIA FILMS
9.9.1 Overview
9.9.2 Product portfolio
9.9.3 Strategy
9.9.4 Developments
9.10 KLOCKNER PENTAPLAST (SUBSIDIARY OF BLACKSTONE GROUP)
9.10.1 Overview
9.10.2 Product portfolio
9.10.3 Strategy
9.10.4 Developments
9.11 LANDEC CORPORATION
9.11.1 Overview
9.11.2 Product portfolio
9.11.3 Strategy
9.11.4 Developments
9.12 MITSUBISHI GAS CHEMICAL COMPANY, INC.
9.12.1 Overview
9.12.2 Product portfolio
9.12.3 Strategy
9.12.4 Developments
9.13 MULTISORB TECHNOLOGIES
9.13.1 Overview
9.13.2 Product portfolio
9.13.3 Strategy
9.13.4 Developments
9.14 PAKSENSE
9.14.1 Overview
9.14.2 Product portfolio
9.14.3 Strategy
9.14.4 Developments
9.15 PAPER PAK INDUSTRIES
9.15.1 Overview
9.15.2 Product portfolio
9.15.3 Strategy
9.15.4 Developments
9.16 REXAM, PLC.
9.16.1 Overview
9.16.2 Product portfolio
9.16.3 Strategy
9.16.4 Developments
9.17 SEALED AIR CORPORATION
9.17.1 Overview
9.17.2 Product portfolio
9.17.3 Strategy
9.17.4 Developments
9.18 SONOCO
9.18.1 Overview
9.18.2 Product portfolio
9.18.3 Strategy
9.18.4 Developments
9.19 SYSCO CORPORATION (FRESH POINT SERVICES)
9.19.1 Overview
9.19.2 Product portfolio
9.19.3 Strategy
9.19.4 Developments
9.20 TIMESTRIP, PLC.
9.20.1 Overview
9.20.2 Primary business
9.20.3 Strategy
9.20.4 Developments
9.21 VIP PACKAGING
9.21.1 Overview
9.21.2 Product portfolio
9.21.3 Strategy
9.21.4 Developments
10 APPENDIX
� U.S. Patents
� EUROPE Patents
� JAPAN Patents
LIST OF TABLES
1 Global advanced packaging market, revenue by technologies, 2008 � 2015 ($Million)
2 Global active packaging market, revenue by technologies, 2008 � 2015 ($Million)
3 Active packaging technology market, revenues by geography, 2008 � 2015 ($Million)
4 Active packaging: technical specifications
5 Oxygen scavenger technology market, revenue by geography, 2008 � 2015 ($Million)
6 Carbon dioxide scavenger technology market, revenue by geography, 2008 � 2015 ($Million)
7 Ethylene scavenger technology market, revenue by geography, 2008 � 2015 ($Million)
8 Preservative releaser technology market, revenue by geography, 2008 � 2015 ($Million)
9 Ethanol emitter technology market, revenue by geography, 2008 � 2015 ($Million)
10 Moisture absorber technology market, revenue by geography, 2008 � 2015 ($Million)
11 Flavor absorber technology market, revenue by geography, 2008 � 2015 ($Million)
12 Temperature control technology market, revenue by geography, 2008 � 2015 ($Million)
13 Others active packaging technology market, revenue by geography, 2008 � 2015 ($Million)
14 Modified atmosphere packaging technology market, revenue by geography, 2008 � 2015 ($Million)
15 Modified atmosphere packaging, by types
16 Global intelligent packaging market, revenue by technology, 2008 � 2015 ($Million)
17 Intelligent packaging technology market, revenue by geography, 2008 � 2015 ($Million)
18 Food and packaging waste in europe at various stages supply chain (Metric tons)
19 Intelligent packaging: technical perspective
20 Freshness indicators packaging technology market, revenues by geography, 2008 � 2015 ($Million)
21 Time temperature indicators packaging technology market, revenue by geography, 2008 � 2015 ($Million)
22 Thermochromatic inks packaging technology market, revenue by geography, 2008 � 2015 ($Million)
23 RFID packaging technology market, by geography, 2008 � 2015 ($Million)
24 Other intelligent packaging technology market, revenue by geography, 2008 � 2015 ($Million)
25 Global packaged food market, 2008-2015 ($Billion)
26 Shelf life of meat and other products using advanced packaging
27 Global active packaging technology market in packaged foods, 2008 � 2015 ($Million)
28 Global intelligent packaging technology market in packaged foods, 2008 � 2015 ($Million)
29 Global map technology market in packaged foods, 2008 � 2015 ($Million)
30 Packaged food retail sales by North America region countrywise, 2008 � 2015 ($Billion)
31 North America active packaging technology market in packaged food, by retail sales, 2008 � 2015 ($Million)
32 North America intelligent packaging technology market in packaged food, by retail sales, 2008 � 2015 ($Million) 33 North America map technology market in packaged food, by retail sales, 2008 � 2015 ($Million)
34 Packaged food retail sales, by Europe region country wise 2008 � 2015 ($Billion)
35 Europe active packaging technology market in packaged food, by retail sales, 2008 � 2015 ($Million)
36 Europe intelligent packaging technology market in packaged food, by retail sales, 2008 � 2015 ($Million)
37 Europe map technology market in packaged food, by retail sales, 2008 � 2015 ($Million)
38 Packaged food retail sales, by Asia-Pacific region countrywise, 2008 � 2015 ($Billion)
39 Asia-Pacific active packaging market in packaged food, by retail sales, 2008 � 2015 ($Million)
40 Asia-Pacific intelligent packaging market in packaged food, by retail sales, 2008 � 2015 ($Million)
41 Asia-Pacific map technology market in packaged food, by retail sales, 2018 � 2015 ($Million)
42 Global packaged food retail sales, by type, 2008 � 2015 ($Billion)
43 Global other packaged food retail sales, 2008 � 2015 ($Billion)
44 Global frozen food market, by retail sales, by type, 2008 � 2015 ($Million)
45 Global active packaging in frozen food, by retail sales, 2008 � 2015 ($Million)
46 Global intelligent packaging in frozen food, by retail sales, 2008 � 2015 ($Million)
47 Global map technology market in frozen food, by retail sales, 2008 � 2015 ($Million)
48 Global frozen fruits and vegetables market, by retail sales, by geography, 2008 � 2015 ($Million)
49 Global frozen fruit market by retail sales, by geography, 2008 � 2015 ($Million)
50 Global frozen vegetables market, by retail sales, by geography, 2008 � 2015 ($Million)
51 Frozen potato market, by geography, 2008 � 2015 ($Million)
52 Global frozen soup market by retail sales, by geography, 2008 � 2015 ($Million)
53 Global frozen meat market by retail sales, by geography, 2008 � 2015 ($Million)
54 Global frozen fish market by retail sales, by geography, 2008 � 2015 ($Million)
55 Frozen ready meals market by retail sales, by geography, 2008 � 2015 ($Million)
56 Frozen pizza market, by retail sales, by geography, 2008 � 2015 ($Million)
57 Dairy packaged food market, by retail sales, by geography, 2008 � 2015 ($Billion)
58 Global active packaging technology market in dairy, by retail sales, by geography, 2008 � 2015 ($Million)
59 Global intelligent packaging technology market in dairy packaged food, by retail sales, 2008 � 2015 ($Million)
60 Global MAP technology market in dairy packaged food, by retail sales, 2008 � 2015 ($Million)
61 Global market for chilled processed food, by retails sales, by geography, 2008 � 2015 ($Billion)
62 Global market for active packaging in chilled processed food, by retail sales, by geography, 2008 � 2015 ($Million)
63 Global intelligent packaging market in chilled processed food, by retail sales, by geography, 2008 � 2015 ($Million)
64 Global market for MAP technology in chilled processed food, by retail sales, by geography, 2008 � 2015 ($Million)
65 Global dried processed food market, by retail sales, by geography, 2008 � 2015 ($Billion)
66 Global active packaging technology market in dried processed food, by retail sales, by geography, 2008 � 2015 ($Million)
67 Global market for intelligent packaging in dried processed food, by retail sales, by geography, 2008 -2015 ($Million)
68 Global market for map technology in dried processed food, by retail sales, by geography, 2008 � 2015 ($Million)
69 New product development (May 2007 � September 2010)
70 Partnership (May 2007 � July 2010)
71 Acquisitions (July 2007 � October 2010)
72 Global advanced packaging technology market, by geography, 2008 � 2015 ($Million)
73 North America advanced packaging technology market, by geography, 2008 � 2015 ($Million)
74 Europe advanced packaging technology market, by geography, 2008 � 2015 ($Million)
75 Asia advanced packaging technology market, by geography, 2008 � 2015 ($Million)
76 ROW advanced packaging technology market, by geography, 2008 � 2015 ($Million)
LIST OF FIGURES
1 Market snapshot
2 Porter�s five forces analysis
3 Advanced packaging: market segmentation
4 Evolution of food and beverage packaging
5 Share of advanced packaging technology breakup, by types, 2010
6 Global advanced packaging market, by applications, 2009
7 Role of advanced packaging technologies
8 Value chain analysis
9 Patent analysis: by companies, 2005 � 2010
10 Patent analysis: by packaging segment, 2005 � 2010
11 Patents analysis: by geography, 2005 � 2010
12 Percentage of single households in major geographies, 2008
13 Expected penetration of sustainable packaging at major U.S. retailers
14 Packaged food: North America
15 Availability and clarity of information for consumers
16 Increased production of pet bottles
17 Average wood pulp cost
18 Consumer understanding of freshness indicators
19 Consumer usage & benefits of freshness indicator
20 Per capita per year consumption of fish
21 World per capita poultry consumption
22 Global dairy segment packaging breakup
23 Growth strategies in advanced packaging technology market, (June 2008 � September 2010)
24 Advanced packaging: growth strategies, by packaging technology types, (June 2008 � September 2010)
25 Advanced packaging: growth strategies, by product category, (June 2008 � September 2010)
26 Advanced packaging: major developments, by companies, (June 2008 � September 2010)


Growth opportunities and latent adjacency in Global Active, Smart and Intelligent Packaging Market