Space On-board Computing Platform Market by Platform, Application (Earth Observation, Navigation, Communication, Military & Scientific), Orbit, Communication Frequency, Technology, and Region (North America, Europe, APAC and RoW) - Forecast to 2027
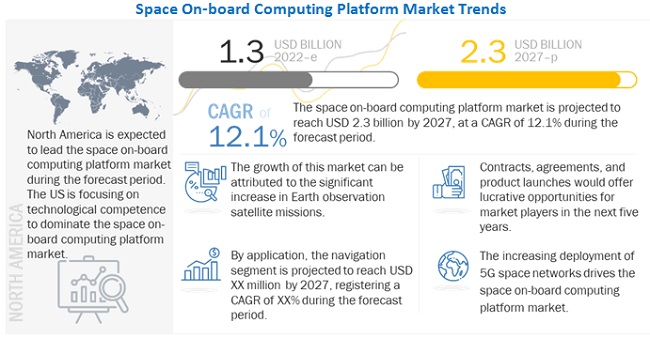
[223 Pages Report] The Space on-board computing platform market is estimated to be USD 1.3 billion in 2022 and is projected to reach USD 2.3 billion by 2027, at a CAGR of 12.1% from 2022 to 2027. The market is driven by factors such as innovations in Space on-board computing platform used in navigation and communication satellites across the world.
To know about the assumptions considered for the study, Request for Free Sample Report
COVID-19 has led to several challenges for many industries. The Aerospace & defense industry is no exception to that. The budget allotted to the defense sector has been reduced by several countries due to the COVID-19 pandemic. This puts most research projects on hold. The export of Space on-board computing platform to several countries in the Middle East, Africa, and Latin America has also been reduced. All these scenarios affect the development of Space on-board computing platform.
Space On-board Computing Platform Market Dynamics
Software-defined payloads for communication satellites
Software-defined payload is considered the central unit of a software-defined satellite. It is responsible for providing core functionality and purpose for a particular application. Various end users, basically commercial industries, such as oil and gas, mining, and agriculture, utilize software-defined satellites for their product mapping, earth exploration, and communication.
Conventional satellites were earlier tailored to comply with single mission requirements. Satellite developers are gradually adopting the vision of software-defined satellites that can be reprogrammed and reconfigured to allow a satellite to take up new applications and expand its performance. Different technologies such as reconfigurable payload, AI, cloud computing, and software-defined radio are embedded in the satellites, which allow them to be reconfigurable and flexible. Thus, increased demand for software-defined payloads has driven the space on-board computing platforms market.
Opportunity : Use of software-defined technology for flexibility to alter space missions
Flexibility and the ability to reconfigure a satellite that is already in orbit are some applications demanded by operators. The ability to adjust the spacecraft to the changing needs of the market is essential for operators of Geostationary Orbit (GEO) satellites that usually have lifespans of 15 years or more. That might include moving a satellite into a different position or switching its functionality from TV broadcasting to internet connectivity—something that would be impossible with the traditional hardware-defined satellites.
In 2021, American satellite manufacturer Lockheed Martin launched a bunch of CubeSats into the LEO. These CubeSats were different from regular CubeSats. They were launched in formations, act as a space-based cloud computing platform, process data onboard, and have their functionality changed through software updates beamed from the ground during the mission. This demonstrated the entry of the company into software-defined satellites that rely on generic hardware, flexible software, and an advanced and distributed space on-board computing platform to define their missions.
With its hi-tech on-board computing platform, software-defined technology provides the flexibility they need and could also reduce costs in the future. However, manufacturers and operators have already introduced partially software-defined satellites for LEO and MEO constellations. Thus, software-defined technology has created growth opportunities for the space on-board computing platform market.
Challenges : Use of COTS components and systems in satellites
Increasing use of Commercial-off-the-shelf (COTS) based components and systems in satellite payloads is expected to pose a challenge for the space on-board computing platform. The Commercial-off-the-shelf (COTS) components and systems have different specifications than the MIL-STD components, and their specifications are the sole responsibility of the manufacturer. It is required to study the component and system well and decide whether it is compatible with the satellite. Hence, it poses a challenge for space on-board computing platform manufacturers to develop suitable products as per COTS standards.
Space on-board computing platform used in navigation satellites to lead the Space on-board computing platform market by application, during the forecast period
Space on-board computing platforms are useful for mapping of the Earth and navigation across regions. The data collected through these applications is processed through the web of satellites by their on-board computing platforms, which enables the development of exact maps of the Earth’s surface. These platforms improve the performance of GPS-based navigation due to their enhanced processing capabilities. The satellite, with the help of enhanced space on-board computing platforms, uses GNSS to generate signals for effective navigation, which was previously possible only with traditional and larger satellites. Many transportation and marine companies are investing more in small satellite and medium satellites to develop better navigation and tracking systems. All these factors have resulted in increased growth of this market.
S-band segment to command the Space on-board computing platform market by communication frequency, during the forecast period
S-band frequencies are used in most mobile satellite services in the US. In satellite communication, the frequency band range from 1.98–2.01 GHz is used for Earth to space communication, whereas the frequency band range from 2.17 GHz to 2.20 GHz is used for space to Earth communication. The on-board computing platform for managing such satellites is designed to handle antennas that operate on the above-mentioned frequency ranges.
The North America market is projected to contribute the largest share from 2022 to 2027
To know about the assumptions considered for the study, download the pdf brochure
Emerging Industry Trends
Use of small satellites to provide communication services
OneWeb and SpaceX are expected to introduce networks to bring a change in terms of communication-related services provided by small satellites. These companies plan to use small satellites for low-priced applications that were previously not feasible using traditional systems. The constellations proposed by the abovementioned companies aim to offer high-throughput bandwidth in real time. The proposed launch of massive smallsat communication constellations is also expected to deliver substantial economies of scale in terms of manufacturing. Low manufacturing cost is expected to enable companies to offer broadband services at prices that rival terrestrial alternatives. Space on-board computing platforms play a vital role in managing communication from a satellite. The involvement of satellite communication in rapidly evolving 5G technology would benefit the growth of space on-board computing platforms.
Key Players
Major players in the Space on-board computing platform market include BAE Systems (UK), L3harris Technologies (US), Lockheed Martin Corporation (US), Thales Group (France), Northrop Grumman Corp. (US), Honeywell International Inc. (US), and Lockheed Martin (US). The report covers various industry trends and new technological innovations in the Space on-board computing platform market for the period, 2018-2027.
Get online access to the report on the World's First Market Intelligence Cloud
- Easy to Download Historical Data & Forecast Numbers
- Company Analysis Dashboard for high growth potential opportunities
- Research Analyst Access for customization & queries
- Competitor Analysis with Interactive dashboard
- Latest News, Updates & Trend analysis
Request Sample Scope of the Report
Get online access to the report on the World's First Market Intelligence Cloud
- Easy to Download Historical Data & Forecast Numbers
- Company Analysis Dashboard for high growth potential opportunities
- Research Analyst Access for customization & queries
- Competitor Analysis with Interactive dashboard
- Latest News, Updates & Trend analysis
Report Metric |
Details |
Market size available for years |
2018–2027 |
Base year considered |
2021 |
Forecast period |
2022-2027 |
Forecast units |
Value (USD Million) |
Segments covered |
By Application, By Platform, By Communication Frequency, By Orbit, By Technology |
Geographies covered |
North America, Europe, Asia Pacific, and Rest of the World |
Companies covered |
SAAB AB (Sweden), Raytheon Technologies (US), Honeywell International Inc (US), Thales Group (France), and BAE Systems (UK) |
The study categorizes the Space on-board computing platform market based on Application, Platform, Orbit, Communication Frequency, and Region.
Based on Application, the space based computing platforms market has been segmented as follows:
- Communication
- Earth Observation
- Navigation
- Meteorology
- Other
Based on Platform, the space based computing platforms market has been segmented as follows:
- Nano Satellite
- Micro satellite
- Small satellite
- Medium satellite
- Large satellite
- Spacecraft
Based on the Communication Frequency, the space based computing platforms market has been segmented as follows:
- X-band
- S-band
- K-band
- UHF/VHF Band
Based on the Orbit, space based computing platforms market has been segmented as follows:
- Low Earth Orbit (LEO)
- Medium Earth Orbit (MEO)
- Geostationary Earth Orbit (GEO)
Based on the region, space based computing platforms market has been segmented as follows:
- North America
- Europe
- Asia Pacific
- Rest of the World (RoW)
Rest of the World includes Latin America, Middle East, and Africa
Recent Developments
- In March 2022, Ramon Space unveiled a storage system that can withstand the harsh environment of space. NuStream is the latest computing infrastructure platform for data-driven space missions. It has high-density storage and advanced modular architecture.
- In August 2021, The radiation-hardened RAD510 System on Chip (SoC) is designed by BAE Systems and manufactured by GlobalFoundries (GF) and forms the core of a single board computer (SBC) with twice the performance capability of the industry-standard RAD750 microprocessor. The SBC provides Power Architecture software-compatible processing that is more advanced than the RAD750 radiation-hardened general-purpose processor.
Frequently Asked Questions (FAQ):
What are your views on the growth prospect of the Space on-board computing platform market?
The Space on-board computing platform market is expected to grow substantially owing to the technological development in designing of the Space on-board computing platform based systems for several military & commercial applications.
What are the key sustainability strategies adopted by leading players operating in the Space on-board computing platform market?
Key players have adopted various organic and inorganic strategies to strengthen their position in the Space on-board computing platform market. Major players including BAE Systems (UK), L3harris Technologies (US), Lockheed Martin Corporation (US), Honeywell International Inc. (US), Northrop Grumman Corp. (US), Thales Group (France), and Lockheed Martin (US). have adopted various strategies, such as contracts and agreements, to expand their presence in the market further.
What are the new emerging technologies and use cases disrupting the Space on-board computing platform market?
Some of the major emerging technologies and use cases disrupting the market include the use of COTS components in satellite manufacturing.
Who are the key players and innovators in the ecosystem of the Space on-board computing platform market?
Major players in the Space on-board computing platform market include BAE Systems (UK), L3harris Technologies (US), Lockheed Martin Corporation (US), Honeywell International Inc. (US), Northrop Grumman Corp. (US), Thales Group (France), and Lockheed Martin (US).
Which region is expected to hold the highest market share in the Space on-board computing platform market?
Space on-board computing platform market in The North America region is estimated to account for the largest share of 62.5% of the market in 2022 and is expected to grow at the highest CAGR of 13.5% during the forecast period. .
To speak to our analyst for a discussion on the above findings, click Speak to Analyst
TABLE OF CONTENTS
1 INTRODUCTION (Page No. - 31)
1.1 OBJECTIVES OF THE STUDY
1.2 MARKET DEFINITION
1.3 MARKET SCOPE
1.3.1 MARKETS COVERED
FIGURE 1 SPACE ON-BOARD COMPUTING PLATFORM MARKET SEGMENTATION
1.3.2 REGIONAL SCOPE
1.3.3 YEARS CONSIDERED FOR THE STUDY
1.4 INCLUSIONS & EXCLUSIONS
1.5 CURRENCY & PRICING
1.6 USD EXCHANGE RATES
1.7 LIMITATIONS
1.8 MARKET STAKEHOLDERS
2 RESEARCH METHODOLOGY (Page No. - 36)
2.1 RESEARCH DATA
FIGURE 2 REPORT PROCESS FLOW
FIGURE 3 RESEARCH DESIGN
2.1.1 SECONDARY DATA
2.1.2 PRIMARY DATA
2.1.2.1 Key data from primary sources
2.1.2.2 Key primary sources
FIGURE 4 BREAKDOWN OF PRIMARY INTERVIEWS: BY COMPANY TYPE, DESIGNATION, AND REGION
2.1.3 DEMAND-SIDE INDICATORS
2.1.4 SUPPLY-SIDE ANALYSIS
2.2 MARKET SIZE ESTIMATION
2.2.1 SEGMENTS AND SUBSEGMENTS
2.3 RESEARCH APPROACH & METHODOLOGY
2.3.1 BOTTOM-UP APPROACH
TABLE 1 SPACE ON-BOARD COMPUTING PLATFORM MARKET ESTIMATION PROCEDURE
FIGURE 5 MARKET SIZE ESTIMATION METHODOLOGY: BOTTOM-UP APPROACH
2.3.2 TOP-DOWN APPROACH
FIGURE 6 MARKET SIZE ESTIMATION METHODOLOGY: TOP-DOWN APPROACH
2.4 DATA TRIANGULATION
FIGURE 7 DATA TRIANGULATION
2.4.1 TRIANGULATION THROUGH PRIMARY AND SECONDARY RESEARCH
2.5 GROWTH RATE ASSUMPTIONS
2.6 ASSUMPTIONS FOR THE RESEARCH STUDY
2.7 RISKS
3 EXECUTIVE SUMMARY (Page No. - 45)
FIGURE 8 COMMUNICATION APPLICATION TO REGISTER HIGHEST CAGR DURING FORECAST PERIOD
FIGURE 9 MEDIUM SATELLITES TO DOMINATE MARKET DURING FORECAST PERIOD
FIGURE 10 S-BAND SEGMENT TO COMMAND LARGEST SHARE DURING FORECAST PERIOD
FIGURE 11 LOW EARTH ORBIT SEGMENT TO LEAD MARKET DURING FORECAST PERIOD
FIGURE 12 NORTH AMERICA TO HOLD LARGEST SHARE OF SPACE ON-BOARD COMPUTING PLATFORM MARKET IN 2022
4 PREMIUM INSIGHTS (Page No. - 49)
4.1 ATTRACTIVE GROWTH OPPORTUNITIES IN SPACE ON-BOARD COMPUTING PLATFORM MARKET
FIGURE 13 INCREASING DEMAND FOR COMMUNICATION SATELLITES RESPONSIBLE FOR MARKET GROWTH
4.2 SPACE ON-BOARD COMPUTING PLATFORM MARKET, BY APPLICATION
FIGURE 14 NAVIGATION SEGMENT TO COMMAND MARKET FROM 2018 TO 2027
4.3 SPACE ON-BOARD COMPUTING PLATFORM MARKET, BY PLATFORM
FIGURE 15 MEDIUM SATELLITES EXPECTED TO DOMINATE MARKET FROM 2018 TO 2027
4.4 SPACE ON-BOARD COMPUTING PLATFORM MARKET, BY COMMUNICATION FREQUENCY
FIGURE 16 S-BAND SEGMENT TO DOMINATE MARKET FROM 2018 TO 2027
4.5 SPACE ON-BOARD COMPUTING PLATFORM MARKET, BY ORBIT
FIGURE 17 LOW EARTH ORBIT SEGMENT TO WITNESS UPWARD TREND FROM 2018 TO 2027
4.6 SPACE ON-BOARD COMPUTING PLATFORM MARKET, BY COUNTRY
FIGURE 18 US PROJECTED TO BE FASTEST-GROWING MARKET FROM 2022 TO 2027
5 MARKET OVERVIEW (Page No. - 53)
5.1 INTRODUCTION
5.2 MARKET DYNAMICS
FIGURE 19 SPACE ON-BOARD COMPUTING PLATFORM MARKET DYNAMICS
5.2.1 DRIVERS
5.2.1.1 Rise in space exploration missions
TABLE 2 LARGEST SPACE MISSIONS FROM 2020 TO 2026
5.2.1.2 Increasing use of small satellites in various applications
FIGURE 20 SMALL SATELLITE LAUNCHES (2015-2021)
5.2.1.3 Software-defined payloads for communication satellites
5.2.1.4 Demand for Earth observation imagery and analytics
5.2.1.5 New application areas for CubeSats
5.2.2 RESTRAINTS
5.2.2.1 Absence of cohesive government policies
5.2.2.2 Export restrictions on US manufacturers
5.2.3 OPPORTUNITIES
5.2.3.1 Use of software-defined technology for flexibility to alter space missions
5.2.3.2 Development of satellite networks for internet access in areas without broadband connectivity
5.2.3.3 Government investments in space technology
5.2.4 CHALLENGES
5.2.4.1 Concerns over space debris
5.2.4.2 Use of COTS components and systems in satellites
5.2.5 DEMAND-SIDE IMPACT
5.2.5.1 Key developments from January 2019 to March 2022
TABLE 3 KEY DEVELOPMENTS IN SPACE ON-BOARD COMPUTING PLATFORM MARKET, 2019-2022
5.3 TRENDS/DISRUPTIONS IMPACTING CUSTOMER BUSINESSES
FIGURE 21 TRENDS AND DISRUPTIONS IMPACTING CUSTOMERS
5.4 MARKET ECOSYSTEM
FIGURE 22 SPACE ON-BOARD COMPUTING PLATFORM: MARKET ECOSYSTEM
5.4.1 PROMINENT COMPANIES
5.4.2 PRIVATE AND SMALL ENTERPRISES
5.4.3 END USERS
TABLE 4 SPACE ON-BOARD COMPUTING PLATFORM MARKET ECOSYSTEM
5.5 PRICING ANALYSIS
5.5.1 AVERAGE SELLING PRICE ANALYSIS OF SPACE ON-BOARD COMPUTING PLATFORMS IN 2021
FIGURE 23 AVERAGE SELLING PRICE OF SPACE ON-BOARD COMPUTING PLATFORM (ESA) OFFERED BY TOP PLAYERS
5.6 TARIFF REGULATORY LANDSCAPE
5.6.1 NORTH AMERICA: LIST OF REGULATORY BODIES, GOVERNMENT AGENCIES, AND OTHER AGENCIES
5.6.2 EUROPE: LIST OF REGULATORY BODIES, GOVERNMENT AGENCIES, AND OTHER AGENCIES
5.6.3 ASIA PACIFIC: LIST OF REGULATORY BODIES, GOVERNMENT AGENCIES, AND OTHER AGENCIES
5.6.4 REST OF THE WORLD: LIST OF REGULATORY BODIES, GOVERNMENT AGENCIES, AND OTHER AGENCIES
5.7 TRADE DATA
5.7.1 TRADE ANALYSIS
TABLE 5 COUNTRY-WISE EXPORTS, 2019-2021 (USD THOUSAND)
TABLE 6 COUNTRY-WISE EXPORTS, 2019-2021 (USD THOUSAND)
5.8 PATENT ANALYSIS
FIGURE 24 MAJOR PATENTS FOR SPACE ON-BOARD COMPUTING PLATFORMS
TABLE 7 LIST OF MAJOR PATENTS FOR SPACE ON-BOARD COMPUTING PLATFORMS
5.9 VALUE CHAIN ANALYSIS OF SPACE ON-BOARD COMPUTING PLATFORM MARKET
FIGURE 25 VALUE CHAIN ANALYSIS
5.1 TECHNOLOGY ANALYSIS
5.10.1 KEY TECHNOLOGY
5.10.1.1 Introduction of distributed computing architecture in satellites
5.10.2 COMPLEMENTARY TECHNOLOGY
5.10.2.1 Deployment of 5G technology
FIGURE 26 COUNTRY-WISE AVAILABILITY OF 5G NETWORK (2021)
5.11 PORTER’S FIVE FORCES MODEL
5.11.1 SPACE ON-BOARD COMPUTING PLATFORM MARKET: PORTER’S FIVE FORCES ANALYSIS
FIGURE 27 SPACE ON-BOARD COMPUTING PLATFORM MARKET: PORTER'S FIVE FORCES ANALYSIS
5.11.2 THREAT OF NEW ENTRANTS
5.11.3 THREAT OF SUBSTITUTES
5.11.4 BARGAINING POWER OF SUPPLIERS
5.11.5 BARGAINING POWER OF BUYERS
5.11.6 INTENSITY OF COMPETITIVE RIVALRY
5.12 KEY STAKEHOLDERS & BUYING CRITERIA
5.12.1 KEY STAKEHOLDERS IN BUYING PROCESS
FIGURE 28 INFLUENCE OF STAKEHOLDERS IN BUYING SPACE ON-BOARD COMPUTERS, BY APPLICATION
TABLE 8 INFLUENCE OF STAKEHOLDERS IN BUYING SPACE ON-BOARD COMPUTING PLATFORM, BY APPLICATION (%)
5.12.2 BUYING CRITERIA
FIGURE 29 KEY BUYING CRITERIA FOR SPACE ON-BOARD COMPUTING PLATFORM, BY PLATFORM
TABLE 9 KEY BUYING CRITERIA FOR SPACE ON-BOARD COMPUTING PLATFORM, BY PLATFORM
5.13 USE CASES
5.13.1 RADIATION HARDENED POWER PC (RHPPC) ON-BOARD COMPUTERS DEVELOPED BY HONEYWELL INTERNATIONAL INC.
5.14 KEY CONFERENCES & EVENTS, 2022-23
TABLE 10 SPACE ON-BOARD COMPUTING PLATFORM MARKET: DETAILED LIST OF CONFERENCES & EVENTS
5.15 OPERATIONAL DATA
TABLE 11 NUMBER OF SATELLITES LAUNCHED, BY TYPE, 2015-2021
6 INDUSTRY TRENDS (Page No. - 76)
6.1 INTRODUCTION
6.2 SUPPLY CHAIN ANALYSIS
FIGURE 30 SUPPLY CHAIN ANALYSIS
6.2.1 MAJOR COMPANIES
6.2.2 SMALL AND MEDIUM ENTERPRISES
6.2.3 END USERS/CUSTOMERS
6.3 EMERGING INDUSTRY TRENDS
6.3.1 LOW POWER DEVICES
6.3.2 NEW ARCHITECTURES IN SPACE ON-BOARD COMPUTING PLATFORMS
6.3.3 USE OF SMALL SATELLITES TO PROVIDE COMMUNICATION SERVICES
FIGURE 31 NUMBER OF SMALL SATELLITES LAUNCHED FOR COMMUNICATION SERVICES (2015 – 2021)
6.4 IMPACT OF MEGATRENDS
6.4.1 5G SPACE NETWORK
FIGURE 32 TOP 8 COUNTRIES WITH 5G DEPLOYMENT
6.4.1.1 Use cases of 5G space network
6.4.1.1.1 Role of LEO satellites in 5G
6.4.1.1.2 ARTES telecommunications space initiative
6.4.1.1.3 Inmarsat to deploy new type of 5G compatible satellite network
6.4.1.1.4 5G new radio over satellite communication network
6.4.2 DEPLOYMENT OF EARTH OBSERVATION SATELLITES
FIGURE 33 NUMBER OF EARTH OBSERVATION SATELLITES LAUNCHED FROM 2015 TO 2021
6.4.2.1 Use cases of Earth observation satellite launches
6.4.2.1.1 Taranis launched by France space agency (CNES)
6.4.2.1.2 EOS-4 Mission by Indian Space Research Organisation (ISRO)
6.5 INNOVATIONS AND PATENT REGISTRATIONS
7 SPACE ON-BOARD COMPUTING PLATFORM MARKET, BY APPLICATION (Page No. - 82)
7.1 INTRODUCTION
FIGURE 34 COMMUNICATION SEGMENT TO GROW FASTEST DURING FORECAST PERIOD
TABLE 12 SPACE ON-BOARD COMPUTING PLATFORM MARKET, BY APPLICATION, 2018–2021 (USD MILLION)
TABLE 13 SPACE ON-BOARD COMPUTING PLATFORM MARKET, BY APPLICATION, 2022–2027 (USD MILLION)
7.2 NAVIGATION
7.2.1 DEMAND FOR MAPPING AND NAVIGATION SATELLITES DRIVES SEGMENT
7.3 EARTH OBSERVATION
7.3.1 SIGNIFICANT ADVANCEMENTS IN GEOSPATIAL IMAGERY ANALYTICS FUELS SEGMENT
7.4 COMMUNICATION
7.4.1 5G AND MODERN HARDWARE SYSTEMS PRESENT OPPORTUNITIES IN SATELLITE-ENABLED COMMUNICATION
7.5 MILITARY & SCIENTIFIC
7.5.1 NEED TO EXPLORE TACTICAL UTILITY OF SPACE INTELLIGENCE AND RECONNAISSANCE BOOSTS SEGMENT
7.6 OTHERS
8 SPACE ON-BOARD COMPUTING PLATFORM MARKET, BY PLATFORM (Page No. - 87)
8.1 INTRODUCTION
FIGURE 35 NANOSATELLITES SEGMENT TO GROW AT HIGHEST CAGR DURING FORECAST PERIOD
TABLE 14 SPACE ON-BOARD COMPUTING PLATFORM MARKET, BY PLATFORM, 2018–2021 (USD MILLION)
TABLE 15 SPACE ON-BOARD COMPUTING PLATFORM MARKET, BY PLATFORM, 2022–2027 (USD MILLION)
8.2 NANOSATELLITES (1 TO 10 KG)
8.2.1 DEMAND FOR MINIATURE SATELLITES IN SPACE APPLICATIONS BOOSTS MARKET
8.3 MICROSATELLITES (10 TO 50 KG)
8.3.1 INCREASED USE OF MICROSATELLITES FOR REMOTE SENSING AND NAVIGATION BOOSTS SEGMENT
8.4 SMALL SATELLITES (50 TO 150 KG)
8.4.1 SMALLSAT TECH DEVELOPMENT TO PLAY IMPORTANT ROLE IN SPACE ON-BOARD COMPUTING ADVANCEMENT
8.5 MEDIUM SATELLITES (150 TO 1000 KG)
8.5.1 INCREASING NUMBER OF MEDIUM SATELLITE LAUNCHES FOR SCIENTIFIC RESEARCH FUELS SEGMENT
8.6 LARGE SATELLITES (> 1,000 KG)
8.6.1 LARGE SATELLITES MANUFACTURED ONLY BY MAJOR PLAYERS
8.7 SPACECRAFT
8.7.1 SEGMENT DRIVEN BY DEVELOPMENT OF NEW, CREWED, AND UNCREWED SPACECRAFT
9 SPACE ON-BOARD COMPUTING PLATFORM MARKET, BY COMMUNICATION FREQUENCY (Page No. - 93)
9.1 INTRODUCTION
FIGURE 36 X-BAND SEGMENT TO GROW AT HIGHEST CAGR DURING FORECAST PERIOD
TABLE 16 SPACE ON-BOARD COMPUTING PLATFORM MARKET, BY COMMUNICATION FREQUENCY, 2018–2021 (USD MILLION)
TABLE 17 SPACE ON-BOARD COMPUTING PLATFORM MARKET, BY COMMUNICATION FREQUENCY, 2022–2027 (USD MILLION)
9.2 S-BAND
9.2.1 INCREASING DEMAND FOR COMMUNICATION SATELLITES IN NORTH AMERICA DRIVES SEGMENT
9.3 X-BAND
9.3.1 DEMAND FOR BORDER SECURITY AND SURVEILLANCE FUELS SEGMENT
9.4 C-BAND
9.4.1 INCLUSION OF GEOSTATIONARY COMMUNICATION SATELLITES IN 5G SPACE NETWORK BOOSTS SEGMENT
9.5 K-BAND
9.5.1 INCREASING SCIENTIFIC OPERATIONS DRIVE USE OF K-BAND IN SATELLITES
9.6 VHF-/UHF-/HF-BAND
9.6.1 INCREASING DEMAND FOR LEO COMMUNICATION SATELLITES BOOSTS SEGMENT
9.7 OTHERS
10 SPACE ON-BOARD COMPUTING PLATFORM MARKET, BY ORBIT (Page No. - 97)
10.1 INTRODUCTION
FIGURE 37 LEO SEGMENT TO DOMINATE MARKET DURING FORECAST PERIOD
TABLE 18 SPACE ON-BOARD COMPUTING PLATFORM MARKET, BY ORBIT, 2018–2021 (USD MILLION)
TABLE 19 SPACE ON-BOARD COMPUTING PLATFORM MARKET, BY ORBIT, 2022–2027 (USD MILLION)
10.2 LOW EARTH ORBIT
10.2.1 DEVELOPMENT OF 5G SPACE NETWORKS BOOSTS SEGMENT
10.3 MEDIUM EARTH ORBIT
10.3.1 USE OF SPACE ON-BOARD COMPUTING PLATFORM FOR MILITARY, NAVIGATION, AND COMMUNICATION TO DRIVE SEGMENT
10.4 GEOSTATIONARY EARTH ORBIT (GEO)
10.4.1 INCREASING NEED FOR WEATHER FORECASTING SATELLITES FUELS SEGMENT
11 SPACE ON-BOARD COMPUTING PLATFORM MARKET, BY TECHNOLOGY (Page No. - 100)
11.1 INTRODUCTION
11.2 COTS
11.2.1 USE OF COTS STANDARD COMPONENTS FOR MISSION-CRITICAL SPACE APPLICATIONS BOOSTS MARKET
11.3 NON-COTS
11.3.1 RUGGEDNESS, RELIABILITY, CONSISTENCY – FEATURES OF NON-COTS COMPONENTS THAT ENSURE THEIR DOMINANCE
12 REGIONAL ANALYSIS (Page No. - 101)
12.1 INTRODUCTION
FIGURE 38 NORTH AMERICA TO HOLD LARGEST SHARE OF SPACE ON-BOARD COMPUTING PLATFORM MARKET IN 2022
12.2 IMPACT OF COVID-19
FIGURE 39 IMPACT OF COVID-19 ON SPACE ON-BOARD COMPUTING PLATFORM MARKET
TABLE 20 SPACE ON-BOARD COMPUTING PLATFORM MARKET, BY REGION, 2018–2021 (USD MILLION)
TABLE 21 SPACE ON-BOARD COMPUTING PLATFORM MARKET, BY REGION, 2022–2027 (USD MILLION)
12.3 NORTH AMERICA
FIGURE 40 NORTH AMERICA: NUMBER OF SATELLITES LAUNCHED FROM 2018 TO 2021
12.3.1 PESTLE ANALYSIS: NORTH AMERICA
FIGURE 41 NORTH AMERICA: SPACE ON-BOARD COMPUTING PLATFORM MARKET SNAPSHOT
TABLE 22 NORTH AMERICA: SPACE ON-BOARD COMPUTING PLATFORM MARKET, BY COUNTRY, 2018–2021 (USD MILLION)
TABLE 23 NORTH AMERICA: SPACE ON-BOARD COMPUTING PLATFORM MARKET, BY COUNTRY, 2022–2027 (USD MILLION)
TABLE 24 NORTH AMERICA: SPACE ON-BOARD COMPUTING PLATFORM MARKET, BY APPLICATION, 2018–2021 (USD MILLION)
TABLE 25 NORTH AMERICA: SPACE ON-BOARD COMPUTING PLATFORM MARKET, BY APPLICATION, 2022–2027 (USD MILLION)
TABLE 26 NORTH AMERICA: SPACE ON-BOARD COMPUTING PLATFORM MARKET, BY PLATFORM, 2018–2021 (USD MILLION)
TABLE 27 NORTH AMERICA: SPACE ON-BOARD COMPUTING PLATFORM MARKET, BY PLATFORM, 2022–2027 (USD MILLION)
TABLE 28 NORTH AMERICA: SPACE ON-BOARD COMPUTING PLATFORM MARKET, BY COMMUNICATION FREQUENCY, 2018–2021 (USD MILLION)
TABLE 29 NORTH AMERICA: SPACE ON-BOARD COMPUTING PLATFORM MARKET, BY COMMUNICATION FREQUENCY, 2022–2027 (USD MILLION)
TABLE 30 NORTH AMERICA: SPACE ON-BOARD COMPUTING PLATFORM MARKET, BY ORBIT, 2018–2021 (USD MILLION)
TABLE 31 NORTH AMERICA: SPACE ON-BOARD COMPUTING PLATFORM MARKET, BY ORBIT, 2022–2027 (USD MILLION)
12.3.2 US
12.3.2.1 Increased investment in new computing platform architectures drives market
TABLE 32 US: SPACE ON-BOARD COMPUTING PLATFORM MARKET, BY APPLICATION, 2018–2021 (USD MILLION)
TABLE 33 US: SPACE ON-BOARD COMPUTING PLATFORM MARKET, BY APPLICATION, 2022–2027 (USD MILLION)
TABLE 34 US: SPACE ON-BOARD COMPUTING PLATFORM MARKET, BY ORBIT, 2018–2021 (USD MILLION)
TABLE 35 US: SPACE ON-BOARD COMPUTING PLATFORM MARKET, BY ORBIT, 2022–2027 (USD MILLION)
12.3.3 CANADA
12.3.3.1 Government support to enhance space capabilities drives market
TABLE 36 CANADA: SPACE ON-BOARD COMPUTING PLATFORM MARKET, BY APPLICATION, 2018–2021 (USD MILLION)
TABLE 37 CANADA: SPACE ON-BOARD COMPUTING PLATFORM MARKET, BY APPLICATION, 2022–2027 (USD MILLION)
TABLE 38 CANADA: SPACE ON-BOARD COMPUTING PLATFORM MARKET, BY ORBIT, 2018–2021 (USD MILLION)
TABLE 39 CANADA: SPACE ON-BOARD COMPUTING PLATFORM MARKET, BY ORBIT, 2022–2027 (USD MILLION)
12.4 EUROPE
FIGURE 42 EUROPE: NUMBER OF SATELLITES LAUNCHED FROM 2018 TO 2021
12.4.1 PESTLE ANALYSIS: EUROPE
FIGURE 43 EUROPE: SPACE ON-BOARD COMPUTING PLATFORM MARKET SNAPSHOT
TABLE 40 EUROPE: SPACE ON-BOARD COMPUTING PLATFORM MARKET, BY COUNTRY, 2018–2021 (USD MILLION)
TABLE 41 EUROPE: SPACE ON-BOARD COMPUTING PLATFORM MARKET, BY COUNTRY, 2022–2027 (USD MILLION)
TABLE 42 EUROPE: SPACE ON-BOARD COMPUTING PLATFORM MARKET, BY APPLICATION, 2018–2021 (USD MILLION)
TABLE 43 EUROPE: SPACE ON-BOARD COMPUTING PLATFORM MARKET, BY APPLICATION, 2022–2027 (USD MILLION)
TABLE 44 EUROPE: SPACE ON-BOARD COMPUTING PLATFORM MARKET, BY PLATFORM, 2018–2021 (USD MILLION)
TABLE 45 EUROPE: SPACE ON-BOARD COMPUTING PLATFORM MARKET, BY PLATFORM, 2022–2027 (USD MILLION)
TABLE 46 EUROPE: SPACE ON-BOARD COMPUTING PLATFORM MARKET, BY COMMUNICATION FREQUENCY, 2018–2021 (USD MILLION)
TABLE 47 EUROPE: SPACE ON-BOARD COMPUTING PLATFORM MARKET, BY COMMUNICATION FREQUENCY, 2022–2027 (USD MILLION)
TABLE 48 EUROPE: SPACE ON-BOARD COMPUTING PLATFORM MARKET, BY ORBIT, 2018–2021 (USD MILLION)
TABLE 49 EUROPE: SPACE ON-BOARD COMPUTING PLATFORM MARKET, BY ORBIT, 2022–2027 (USD MILLION)
12.4.2 UK
12.4.2.1 Space component modernization programs boost market
TABLE 50 UK: SPACE ON-BOARD COMPUTING PLATFORM MARKET, BY APPLICATION, 2018–2021 (USD MILLION)
TABLE 51 UK: SPACE ON-BOARD COMPUTING PLATFORM MARKET, BY APPLICATION, 2022–2027 (USD MILLION)
TABLE 52 UK: SPACE ON-BOARD COMPUTING PLATFORM MARKET, BY ORBIT, 2018–2021 (USD MILLION)
TABLE 53 UK: SPACE ON-BOARD COMPUTING PLATFORM MARKET, BY ORBIT, 2022–2027 (USD MILLION)
12.4.3 FRANCE
12.4.3.1 Government boost to nano- and microsatellites fuels market
TABLE 54 FRANCE: SPACE ON-BOARD COMPUTING PLATFORM MARKET, BY APPLICATION, 2018–2021 (USD MILLION)
TABLE 55 FRANCE: SPACE ON-BOARD COMPUTING PLATFORM MARKET, BY APPLICATION, 2022–2027 (USD MILLION)
TABLE 56 FRANCE: SPACE ON-BOARD COMPUTING PLATFORM MARKET, BY ORBIT, 2018–2021 (USD MILLION)
TABLE 57 FRANCE: SPACE ON-BOARD COMPUTING PLATFORM MARKET, BY ORBIT, 2022–2027 (USD MILLION)
12.4.4 GERMANY
12.4.4.1 Increased need for 5G compatible satellite communication expected to boost market
TABLE 58 GERMANY: SPACE ON-BOARD COMPUTING PLATFORM MARKET, BY APPLICATION, 2018–2021 (USD MILLION)
TABLE 59 GERMANY: SPACE ON-BOARD COMPUTING PLATFORM MARKET, BY APPLICATION, 2022–2027 (USD MILLION)
TABLE 60 GERMANY: SPACE ON-BOARD COMPUTING PLATFORM MARKET, BY ORBIT, 2018–2021 (USD MILLION)
TABLE 61 GERMANY: SPACE ON-BOARD COMPUTING PLATFORM MARKET, BY ORBIT, 2022–2027 (USD MILLION)
12.4.5 ITALY
12.4.5.1 Rising number of funded studies for space development programs – key market driver
TABLE 62 ITALY: SPACE ON-BOARD COMPUTING PLATFORM MARKET, BY APPLICATION, 2018–2021 (USD MILLION)
TABLE 63 ITALY: SPACE ON-BOARD COMPUTING PLATFORM MARKET, BY APPLICATION, 2022–2027 (USD MILLION)
TABLE 64 ITALY: SPACE ON-BOARD COMPUTING PLATFORM MARKET, BY ORBIT, 2018–2021 (USD MILLION)
TABLE 65 ITALY: SPACE ON-BOARD COMPUTING PLATFORM MARKET, BY ORBIT, 2022–2027 (USD MILLION)
12.4.6 RUSSIA
12.4.6.1 Market driven by increasing number of satellite launches for its military satellite constellation
TABLE 66 RUSSIA: SPACE ON-BOARD COMPUTING PLATFORM MARKET, BY APPLICATION, 2018–2021 (USD MILLION)
TABLE 67 RUSSIA: SPACE ON-BOARD COMPUTING PLATFORM MARKET, BY APPLICATION, 2022–2027 (USD MILLION)
TABLE 68 RUSSIA: SPACE ON-BOARD COMPUTING PLATFORM MARKET, BY ORBIT, 2018–2021 (USD MILLION)
TABLE 69 RUSSIA: SPACE ON-BOARD COMPUTING PLATFORM MARKET, BY ORBIT, 2022–2027 (USD MILLION)
12.4.7 REST OF EUROPE
TABLE 70 REST OF EUROPE: SPACE ON-BOARD COMPUTING PLATFORM MARKET, BY APPLICATION, 2018–2021 (USD MILLION)
TABLE 71 REST OF EUROPE: SPACE ON-BOARD COMPUTING PLATFORM MARKET, BY APPLICATION, 2022–2027 (USD MILLION)
TABLE 72 REST OF EUROPE: SPACE ON-BOARD COMPUTING PLATFORM MARKET, BY ORBIT, 2018–2021 (USD MILLION)
TABLE 73 REST OF EUROPE: SPACE ON-BOARD COMPUTING PLATFORM MARKET, BY ORBIT, 2022–2027 (USD MILLION)
12.5 ASIA PACIFIC
FIGURE 44 ASIA PACIFIC: NUMBER OF SATELLITES LAUNCHED FROM 2018 TO 2021
12.5.1 PESTLE ANALYSIS: ASIA PACIFIC
FIGURE 45 ASIA PACIFIC: SPACE ON-BOARD COMPUTING PLATFORM MARKET SNAPSHOT
TABLE 74 ASIA PACIFIC: SPACE ON-BOARD COMPUTING PLATFORM MARKET, BY COUNTRY, 2018–2021 (USD MILLION)
TABLE 75 ASIA PACIFIC: SPACE ON-BOARD COMPUTING PLATFORM MARKET, BY COUNTRY, 2022–2027 (USD MILLION)
TABLE 76 ASIA PACIFIC: SPACE ON-BOARD COMPUTING PLATFORM MARKET, BY APPLICATION, 2018–2021 (USD MILLION)
TABLE 77 ASIA PACIFIC: SPACE ON-BOARD COMPUTING PLATFORM MARKET, BY APPLICATION, 2022–2027 (USD MILLION)
TABLE 78 ASIA PACIFIC: SPACE ON-BOARD COMPUTING PLATFORM MARKET, BY PLATFORM, 2018–2021 (USD MILLION)
TABLE 79 ASIA PACIFIC: SPACE ON-BOARD COMPUTING PLATFORM MARKET, BY PLATFORM, 2022–2027 (USD MILLION)
TABLE 80 ASIA PACIFIC: SPACE ON-BOARD COMPUTING PLATFORM MARKET, BY COMMUNICATION FREQUENCY, 2018–2021 (USD MILLION)
TABLE 81 ASIA PACIFIC: SPACE ON-BOARD COMPUTING PLATFORM MARKET, BY COMMUNICATION FREQUENCY, 2022–2027 (USD MILLION)
TABLE 82 ASIA PACIFIC: SPACE ON-BOARD COMPUTING PLATFORM MARKET, BY ORBIT, 2018–2021 (USD MILLION)
TABLE 83 ASIA PACIFIC: SPACE ON-BOARD COMPUTING PLATFORM MARKET, BY ORBIT, 2022–2027 (USD MILLION)
12.5.2 CHINA
12.5.2.1 Demand driven by use of military satellites to tackle instability across neighboring countries
TABLE 84 CHINA: SPACE ON-BOARD COMPUTING PLATFORM MARKET, BY APPLICATION, 2018–2021 (USD MILLION)
TABLE 85 CHINA: SPACE ON-BOARD COMPUTING PLATFORM MARKET, BY APPLICATION, 2022–2027 (USD MILLION)
TABLE 86 CHINA: SPACE ON-BOARD COMPUTING PLATFORM MARKET, BY ORBIT, 2018–2021 (USD MILLION)
TABLE 87 CHINA: SPACE ON-BOARD COMPUTING PLATFORM MARKET, BY ORBIT, 2022–2027 (USD MILLION)
12.5.3 INDIA
12.5.3.1 Thriving telecommunication industry anticipated to drive market
TABLE 88 INDIA: SPACE ON-BOARD COMPUTING PLATFORM MARKET, BY APPLICATION, 2018–2021 (USD MILLION)
TABLE 89 INDIA: SPACE ON-BOARD COMPUTING PLATFORM MARKET, BY APPLICATION, 2022–2027 (USD MILLION)
TABLE 90 INDIA: SPACE ON-BOARD COMPUTING PLATFORM MARKET, BY ORBIT, 2018–2021 (USD MILLION)
TABLE 91 INDIA: SPACE ON-BOARD COMPUTING PLATFORM MARKET, BY ORBIT, 2022–2027 (USD MILLION)
12.5.4 JAPAN
12.5.4.1 Focus of private companies on developing advanced technologies for space applications boosts market growth
TABLE 92 JAPAN: SPACE ON-BOARD COMPUTING PLATFORM MARKET, BY APPLICATION, 2018–2021 (USD MILLION)
TABLE 93 JAPAN: SPACE ON-BOARD COMPUTING PLATFORM MARKET, BY APPLICATION, 2022–2027 (USD MILLION)
TABLE 94 JAPAN: SPACE ON-BOARD COMPUTING PLATFORM MARKET, BY ORBIT, 2018–2021 (USD MILLION)
TABLE 95 JAPAN: SPACE ON-BOARD COMPUTING PLATFORM MARKET, BY ORBIT, 2022–2027 (USD MILLION)
12.5.5 AUSTRALIA
12.5.5.1 Government efforts to set up satellite and launch facilities stimulate market growth
TABLE 96 AUSTRALIA: SPACE ON-BOARD COMPUTING PLATFORM MARKET, BY APPLICATION, 2018–2021 (USD MILLION)
TABLE 97 AUSTRALIA: SPACE ON-BOARD COMPUTING PLATFORM MARKET, BY APPLICATION, 2022–2027 (USD MILLION)
TABLE 98 AUSTRALIA: SPACE ON-BOARD COMPUTING PLATFORM MARKET, BY ORBIT, 2018–2021 (USD MILLION)
TABLE 99 AUSTRALIA: SPACE ON-BOARD COMPUTING PLATFORM MARKET, BY ORBIT, 2022–2027 (USD MILLION)
12.5.6 REST OF ASIA PACIFIC
TABLE 100 REST OF ASIA PACIFIC: SPACE ON-BOARD COMPUTING PLATFORM MARKET, BY APPLICATION, 2018–2021 (USD MILLION)
TABLE 101 REST OF ASIA PACIFIC: SPACE ON-BOARD COMPUTING PLATFORM MARKET, BY APPLICATION, 2022–2027 (USD MILLION)
TABLE 102 REST OF ASIA PACIFIC: SPACE ON-BOARD COMPUTING PLATFORM MARKET, BY ORBIT, 2018–2021 (USD MILLION)
TABLE 103 REST OF ASIA PACIFIC: SPACE ON-BOARD COMPUTING PLATFORM MARKET, BY ORBIT, 2022–2027 (USD MILLION)
12.6 REST OF THE WORLD
FIGURE 46 REST OF THE WORLD: NUMBER OF SATELLITES LAUNCHED FROM 2018 TO 2021
12.6.1 PESTLE ANALYSIS: REST OF THE WORLD
FIGURE 47 REST OF THE WORLD: SPACE ON-BOARD COMPUTING PLATFORM MARKET SNAPSHOT
TABLE 104 REST OF THE WORLD: SPACE ON-BOARD COMPUTING PLATFORM MARKET, BY REGION, 2018–2021 (USD MILLION)
TABLE 105 REST OF THE WORLD: SPACE ON-BOARD COMPUTING PLATFORM MARKET, BY REGION, 2022–2027 (USD MILLION)
TABLE 106 REST OF THE WORLD: SPACE ON-BOARD COMPUTING PLATFORM MARKET, BY APPLICATION, 2018–2021 (USD MILLION)
TABLE 107 REST OF THE WORLD: SPACE ON-BOARD COMPUTING PLATFORM MARKET, BY APPLICATION, 2022–2027 (USD MILLION)
TABLE 108 REST OF THE WORLD: SPACE ON-BOARD COMPUTING PLATFORM MARKET, BY PLATFORM, 2018–2021 (USD MILLION)
TABLE 109 REST OF THE WORLD: SPACE ON-BOARD COMPUTING PLATFORM MARKET, BY PLATFORM, 2022–2027 (USD MILLION)
TABLE 110 REST OF THE WORLD: SPACE ON-BOARD COMPUTING PLATFORM MARKET, BY COMMUNICATION FREQUENCY, 2018–2021 (USD MILLION)
TABLE 111 REST OF THE WORLD: SPACE ON-BOARD COMPUTING PLATFORM MARKET, BY COMMUNICATION FREQUENCY, 2022–2027 (USD MILLION)
TABLE 112 REST OF THE WORLD: SPACE ON-BOARD COMPUTING PLATFORM MARKET, BY ORBIT, 2018–2021 (USD MILLION)
TABLE 113 REST OF THE WORLD: SPACE ON-BOARD COMPUTING PLATFORM MARKET, BY ORBIT, 2022–2027 (USD MILLION)
12.6.2 MIDDLE EAST
TABLE 114 MIDDLE EAST: SPACE ON-BOARD COMPUTING PLATFORM MARKET, BY APPLICATION, 2018–2021 (USD MILLION)
TABLE 115 MIDDLE EAST: SPACE ON-BOARD COMPUTING PLATFORM MARKET, BY APPLICATION, 2022–2027 (USD MILLION)
TABLE 116 MIDDLE EAST: SPACE ON-BOARD COMPUTING PLATFORM MARKET, BY ORBIT, 2018–2021 (USD MILLION)
TABLE 117 MIDDLE EAST: SPACE ON-BOARD COMPUTING PLATFORM MARKET, BY ORBIT, 2022–2027 (USD MILLION)
12.6.3 AFRICA
TABLE 118 AFRICA: SPACE ON-BOARD COMPUTING PLATFORM MARKET, BY APPLICATION, 2018–2021 (USD MILLION)
TABLE 119 AFRICA: SPACE ON-BOARD COMPUTING PLATFORM MARKET, BY APPLICATION, 2022–2027 (USD MILLION)
TABLE 120 AFRICA: SPACE ON-BOARD COMPUTING PLATFORM MARKET, BY ORBIT, 2018–2021 (USD MILLION)
TABLE 121 AFRICA: SPACE ON-BOARD COMPUTING PLATFORM MARKET, BY ORBIT, 2022–2027 (USD MILLION)
12.6.4 LATIN AMERICA
TABLE 122 LATIN AMERICA: SPACE ON-BOARD COMPUTING PLATFORM MARKET, BY APPLICATION, 2018–2021 (USD MILLION)
TABLE 123 LATIN AMERICA: SPACE ON-BOARD COMPUTING PLATFORM MARKET, BY APPLICATION, 2022–2027 (USD MILLION)
TABLE 124 LATIN AMERICA: SPACE ON-BOARD COMPUTING PLATFORM MARKET, BY ORBIT, 2018–2021 (USD MILLION)
TABLE 125 LATIN AMERICA: SPACE ON-BOARD COMPUTING PLATFORM MARKET, BY ORBIT, 2022–2027 (USD MILLION)
13 COMPETITIVE LANDSCAPE (Page No. - 154)
13.1 INTRODUCTION
TABLE 126 KEY DEVELOPMENTS BY LEADING PLAYERS IN SPACE ON-BOARD COMPUTING PLATFORM MARKET BETWEEN 2019 AND MARCH 2022
13.2 MARKET SHARE ANALYSIS OF LEADING PLAYERS, 2021
FIGURE 48 REVENUE GENERATED BY MAJOR PLAYERS IN SPACE ON-BOARD COMPUTING PLATFORM MARKET, 2021
FIGURE 49 COLLECTIVE REVENUE SHARE OF TOP FIVE PLAYERS
13.3 RANK ANALYSIS, 2021
TABLE 127 DEGREE OF COMPETITION
TABLE 128 COMPANY REGION FOOTPRINT
TABLE 129 COMPANY APPLICATION FOOTPRINT
TABLE 130 COMPANY PLATFORM FOOTPRINT
13.4 COMPETITIVE EVALUATION QUADRANT
13.4.1 STARS
13.4.2 PERVASIVE COMPANIES
13.4.3 EMERGING LEADERS
13.4.4 PARTICIPANTS
FIGURE 50 SPACE ON-BOARD COMPUTING PLATFORM MARKET COMPETITIVE LEADERSHIP MAPPING, 2021
13.5 COMPETITIVE BENCHMARKING
13.5.1 PROGRESSIVE COMPANIES
13.5.2 RESPONSIVE COMPANIES
13.5.3 STARTING BLOCKS
13.5.4 DYNAMIC COMPANIES
FIGURE 51 SPACE ON-BOARD COMPUTING PLATFORM MARKET COMPETITIVE LEADERSHIP MAPPING (SME)
13.6 DETAILED LIST & COMPETITIVE BENCHMARKING OF KEY STARTUP/SMES
TABLE 131 SPACE ON-BOARD COMPUTING PLATFORM MARKET: DETAILED LIST OF KEY STARTUP/SMES
TABLE 132 SPACE ON-BOARD COMPUTING PLATFORM MARKET: COMPETITIVE BENCHMARKING OF KEY STARTUP/SMES
13.7 COMPETITIVE SCENARIO
13.7.1 NEW PRODUCT LAUNCHES
TABLE 133 NEW PRODUCT LAUNCHES, 2019–MARCH 2022
13.7.2 DEALS
TABLE 134 DEALS, 2019–MARCH 2022
14 COMPANY PROFILES (Page No. - 168)
14.1 INTRODUCTION
14.2 KEY PLAYERS
(Business Overview, Products/Services/Solutions Offered, MnM View, Key Strengths and Right to Win, Strategic Choices Made, Weaknesses and Competitive Threats, Recent Developments)*
14.2.1 NORTHROP GRUMMAN CORPORATION
TABLE 135 NORTHROP GRUMMAN CORPORATION: BUSINESS OVERVIEW
FIGURE 52 NORTHROP GRUMMAN CORPORATION: COMPANY SNAPSHOT
14.2.2 THALES GROUP
TABLE 136 THALES GROUP: BUSINESS OVERVIEW
FIGURE 53 THALES GROUP: COMPANY SNAPSHOT
TABLE 137 THALES GROUP: NEW PRODUCT DEVELOPMENT
14.2.3 LOCKHEED MARTIN
TABLE 138 LOCKHEED MARTIN: BUSINESS OVERVIEW
FIGURE 54 LOCKHEED MARTIN: COMPANY SNAPSHOT
TABLE 139 LOCKHEED MARTIN: NEW PRODUCT DEVELOPMENT
14.2.4 RAYTHEON TECHNOLOGIES
TABLE 140 RAYTHEON TECHNOLOGIES: BUSINESS OVERVIEW
FIGURE 55 RAYTHEON TECHNOLOGIES: COMPANY SNAPSHOT
14.2.5 HONEYWELL INTERNATIONAL INC.
TABLE 141 HONEYWELL INTERNATIONAL INC: BUSINESS OVERVIEW
FIGURE 56 HONEYWELL INTERNATIONAL INC: COMPANY SNAPSHOT
TABLE 142 HONEYWELL INTERNATIONAL INC: DEALS
14.2.6 BAE SYSTEMS
TABLE 143 BAE SYSTEMS: BUSINESS OVERVIEW
FIGURE 57 BAE SYSTEMS: COMPANY SNAPSHOT
TABLE 144 BAE SYSTEMS: NEW PRODUCT DEVELOPMENT
TABLE 145 BAE SYSTEMS: DEALS
14.2.7 AIRBUS GROUP
TABLE 146 AIRBUS GROUP: BUSINESS OVERVIEW
FIGURE 58 AIRBUS GROUP: COMPANY SNAPSHOT
14.2.8 LEONARDO S.P.A.
TABLE 147 LEONARDO S.P.A.: BUSINESS OVERVIEW
FIGURE 59 LEONARDO S.P.A.: COMPANY SNAPSHOT
14.2.9 L3HARRIS TECHNOLOGIES
TABLE 148 L3HARRIS TECHNOLOGIES: BUSINESS OVERVIEW
FIGURE 60 L3HARRIS TECHNOLOGIES: COMPANY SNAPSHOT
14.2.10 TELEDYNE TECHNOLOGIES
TABLE 149 TELEDYNE TECHNOLOGIES: BUSINESS OVERVIEW
FIGURE 61 TELEDYNE TECHNOLOGIES: COMPANY SNAPSHOT
14.2.11 MDA
TABLE 150 MDA: BUSINESS OVERVIEW
FIGURE 62 MDA: COMPANY SNAPSHOT
TABLE 151 MDA: DEALS
14.2.12 SAAB AB
TABLE 152 SAAB AB: BUSINESS OVERVIEW
FIGURE 63 SAAB AB: COMPANY SNAPSHOT
14.2.13 ST ENGINEERING
TABLE 153 ST ENGINEERING: BUSINESS OVERVIEW
FIGURE 64 ST ENGINEERING: COMPANY SNAPSHOT
TABLE 154 ST ENGINEERING: DEALS
14.2.14 IBM
TABLE 155 IBM: BUSINESS OVERVIEW
FIGURE 65 IBM: COMPANY SNAPSHOT
14.2.15 ELECNOR
TABLE 156 ELECNOR: BUSINESS OVERVIEW
FIGURE 66 ELECNOR: COMPANY SNAPSHOT
14.2.16 BALL CORP.
TABLE 157 BALL CORP.: BUSINESS OVERVIEW
FIGURE 67 BALL CORP.: COMPANY SNAPSHOT
14.3 OTHER KEY PLAYERS
14.3.1 RUAG SPACE
TABLE 158 RUAG SPACE: BUSINESS OVERVIEW
TABLE 159 RUAG SPACE: NEW PRODUCT DEVELOPMENT
14.3.2 RAMON SPACE
TABLE 160 RAMON SPACE; BUSINESS OVERVIEW
TABLE 161 RAMON SPACE: NEW PRODUCT DEVELOPMENT
TABLE 162 RAMON SPACE: DEALS
14.3.3 LMO SPACE
TABLE 163 LMO SPACE: BUSINESS OVERVIEW
14.3.4 COBHAM GAISLER AB
TABLE 164 COBHAM GAISLER AB: BUSINESS OVERVIEW
TABLE 165 COBHAM GAISLER AB: NEW PRODUCT DEVELOPMENT
14.3.5 GAUSS SRL
TABLE 166 GAUSS SRL: BUSINESS OVERVIEW
14.3.6 YORK SPACE SYSTEMS
TABLE 167 YORK SPACE SYSTEMS: BUSINESS OVERVIEW
14.3.7 SPACE TANGO
TABLE 168 SPACE TANGO: BUSINESS OVERVIEW
14.3.8 CONTEC
TABLE 169 CONTEC: BUSINESS OVERVIEW
14.3.9 ISI SPACE
TABLE 170 ISI SPACE: BUSINESS OVERVIEW
14.3.10 ENDUROSAT
TABLE 171 ENDUROSAT: BUSINESS OVERVIEW
14.3.11 LOFT ORBITAL
TABLE 172 LOFT ORBITAL: BUSINESS OVERVIEW
TABLE 173 LOFT ORBITAL: DEALS
*Business Overview, Products/Services/Solutions Offered, MnM View, Key Strengths and Right to Win, Strategic Choices Made, Weaknesses and Competitive Threats, Recent Developments might not be captured in case of unlisted companies.
15 APPENDIX (Page No. - 217)
15.1 DISCUSSION GUIDE
15.2 KNOWLEDGESTORE: MARKETSANDMARKETS’ SUBSCRIPTION PORTAL
15.3 AVAILABLE CUSTOMIZATION
15.4 RELATED REPORTS
15.5 AUTHOR DETAILS
The study involved four major activities in estimating the current size of the Space on-board computing platform market. Exhaustive secondary research was done to collect information on the market, peer market, and parent market. The next step was to validate these findings, assumptions, and sizing with industry experts across the value chain through primary research. Both top-down and bottom-up approaches were employed to estimate the complete market size. After that, market breakdown and data triangulation were used to estimate the market size of segments and subsegments.
Secondary Research
In the secondary research process, various sources were referred to for identifying and collecting information for this study. The secondary sources included government sources, such as SIPRI; corporate filings such as annual reports, press releases, and investor presentations of companies; white papers, journals, and certified publications; and articles from recognized authors, directories, and databases.
Primary Research
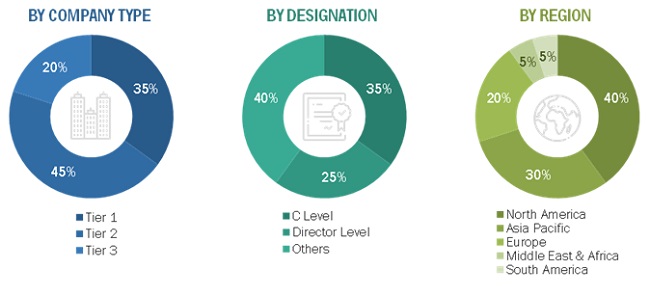
In the primary research process, various primary sources from both supply and demand sides were interviewed to obtain qualitative and quantitative information on the market. The primary sources from the supply side included various industry experts, such as Chief X Officers (CXOs), Vice Presidents (VPs), Directors, from business development, marketing, product development/innovation teams, and related key executives from space on-board computing platform vendors; system integrators; component providers; distributors; and key opinion leaders.
Primary interviews were conducted to gather insights such as market statistics, data of revenue collected from the products and services, market breakdowns, market size estimations, market forecasting, and data triangulation. Primary research also helped in understanding the various trends related to technology, application, vertical, and region. Stakeholders from the demand side, such as CIOs, CTOs, and CSOs, and installation teams of the customer/end users who are using space on-board computing platform were interviewed to understand the buyer’s perspective on the suppliers, products, component providers, and their current usage of space on-board computing platform and future outlook of their business which will affect the overall market.
Space on-board computing platform OEMS |
Others |
Honeywell International Inc. |
MDA |
Thales Group |
Teledyne |
Raytheon Technologies |
Ball Corp. |
Lockheed Martin |
SAAB AB |
To know about the assumptions considered for the study, download the pdf brochure
Market Size Estimation
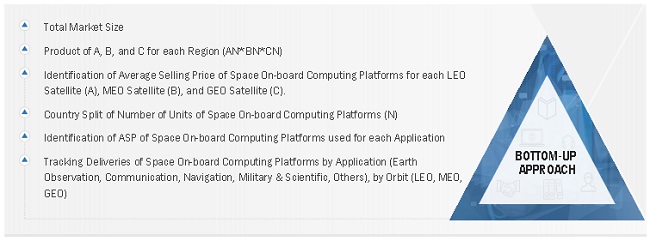
Both top-down and bottom-up approaches were used to estimate and validate the total size of the Space on-board computing platform market. These methods were also used extensively to estimate the size of various segments and subsegments of the market. The research methodology used to estimate the market size included the following:
- Key players in the industry and market were identified through extensive secondary research of their product matrix and geographical presence and developments undertaken by them.
- All percentage shares, splits, and breakdowns were determined using secondary sources and verified through primary sources.
Global Space On-board Computing Platform Market Size: Bottom-Up Approach
Data Triangulation
After arriving at the overall size of the Space on-board computing platform market using the market size estimation processes explained above, the market was split into several segments and subsegments. To complete the overall market engineering process and arrive at the exact statistics of each market segment and subsegment, data triangulation, and market breakdown procedures were employed, wherever applicable. The data was triangulated by studying various factors and trends from demand as well as supply sides of the Space on-board computing platform market.
Report Objectives
- To define, describe, and forecast the space on-board computing platform market by Platform, Application, Communication Frequency, Orbit, Technology, and region
- To analyze the demand- and supply-side indicators influencing the growth of the space on-board computing platform market
- To provide in-depth market intelligence regarding key market dynamics, such as drivers, restraints, opportunities, and industry-specific challenges, which influence the growth of the space on-board computing platform market
- To forecast the size of various segments of the space on-board computing platform market across four main regions, namely, North America, Europe, Asia Pacific, the Middle East & Africa, and Latin America
- To analyze micromarkets 1 with respect to individual growth trends, prospects, and their contribution to the space on-board computing platform market
- To analyze technological advancements and new product launches in the space on-board computing platform market
- To strategically profile key players in the space on-board computing platform market and comprehensively analyze their core competencies 2
- To identify products and key developments of leading companies operating in the space on-board computing platform market
- To provide a comprehensive analysis of business and corporate strategies adopted by key players operating in the space on-board computing platform market
- To provide a detailed competitive landscape of the space on-board computing platform market, along with market share ranking of leading players in the market
Available Customizations
With the given market data, MarketsandMarkets offers customizations according to the specific requirements of companies.
Product Analysis
- Product matrix, which gives a detailed comparison of the product portfolio of each company
Company Information
- Detailed analysis and profiles of additional market players (up to 5)
Growth opportunities and latent adjacency in Space On-board Computing Platform Market