[161 Pages Report] The global stem cell therapy market is projected to reach USD 401 million by 2026 from USD 187 million in 2021, at a CAGR of 16.5% during the forecast period. Market growth is driven mainly by factors such as rising stem cell research activities and increasing approvals of GMP-certified facilities to manufacture stem cells. The increasing demand for iPSCs as an alternative to ESCs and the growing demand for cell & gene therapies are also expected to support the growth of this market in the coming years.
To know about the assumptions considered for the study, download the pdf brochure
Coronavirus disease 2019 (COVID‐19) is an acute respiratory infectious disease caused by severe acute respiratory syndrome coronavirus 2 (SARS‐CoV‐2). Largely unknown before the outbreak began in Wuhan (China) in December 2019, COVID-19 has moved from a regional crisis to a global pandemic in just a few weeks. The World Health Organization (WHO) declared COVID-19 as a pandemic on March 11, 2020. Researchers have been finding new therapies and treatments to deal with this pandemic. In the last few years, stem cells have been proven to be an effective method to treat pulmonary disorders, including COVID-19.
The need for newer and better therapies for the treatment of autoimmune, neurological, and cardiovascular diseases has resulted in an overall increase in research activities and the availability of funding for cell-based research. In November 2019, the Australian government released a 10-year roadmap for stem cell research in AustraliaThe Stem Cell Therapies Mission.
Several ethical issues are associated with the use of stem cells, as these cells are derived by destroying the human embryo. The human embryo is viewed as potential life, and destroying it is considered unethical even if it can save a human life. Such concerns related to embryonic stem cells for developing stem cell therapy are factors restraining market growth across the globe
Induced pluripotent stem cells (iPSCs) are adult stem cells that have been genetically reprogrammed back to an embryonic stem cell-like state. iPSCs function similarly to embryonic stem cells (ESCs), having the ability to differentiate into specialized tissue cells according to the gene expression; this makes iPSCs an effective alternative to ESCs. As ESCs are derived from early-stage embryos, they are associated with socio-ethical issues and laws related to contraception, abortion, and in vitro fertilization. The use of iPSCs bypasses the need for human embryos, thus avoiding socio-ethical objections.
Based on type, the global stem cell therapy market is broadly segmented into allogeneic stem cell therapy and autologous stem cell therapy. In 2020, the allogeneic segment accounted for the largest share of the stem cell therapy market. The growth of the allogeneic segment is attributed to the ease of manufacturing & production processes and the increasing availability of novel stem cell products across major geographies.
Based on therapeutic application, the global stem cell therapy market is segmented into musculoskeletal disorders, wounds & injuries, cardiovascular diseases, surgeries, inflammatory & autoimmune diseases, neurological disorders, and other therapeutic applications (which include ocular diseases, fat loss, and peripheral arterial diseases). The neurological disorders segment is expected to grow at the highest CAGR during the forecast period owing to the increasing prevalence of neurological disorders and the high cost of therapy.
Geographically, the stem cell therapy market is segmented into North America, Europe, Asia Pacific, RoW. In 2020, North America accounted for the largest share of the stem cell therapy market, followed by Asia Pacific and Europe. The large share of this regional segment in the global market can primarily be attributed The large share of North America in the global market can be attributed to the increasing public-private funding and research grants for developing safe & effective stem cell therapy products and the growing number of clinical trials.
Key players in the stem cell therapy market include Smith & Nephew (UK), MEDIPOST Co., Ltd. (South Korea), Anterogen Co., Ltd. (South Korea), PHARMICELL Co., Ltd. (South Korea), JCR Pharmaceuticals Co., Ltd. (Japan), and NuVasive, Inc. (US).
Report Metric |
Details |
Market size available for years |
20192026 |
Base year considered |
2020 |
Forecast period |
20212026 |
Forecast units |
Value (USD) |
Segments covered |
Cell Source, Type, Therapeutic Application and Region |
Geographies covered |
North America, Europe, Asia Pacific, Rest of the World |
Companies covered |
Smith & Nephew (UK), MEDIPOST (South Korea), Anterogen (South Korea), CORESTEM (South Korea), PHARMICELL (South Korea), NuVasive (US), RTI Surgical (US), AlloSource (US), JCR Pharmaceuticals (Japan), Takeda Pharmaceutical Company (Japan), Holostem Terapie Avanzate S.r.l (Italy), Orthofix (US), Regrow Biosciences (India), and Stempeutics Research (India). |
This report categorizes the stem cell therapy market into the following segments and subsegments:
What is the impact of COVID-19 on the stem cell therapy market?
With the COVID-19 pandemic, stem cell therapies derived from a mesenchymal stem cell (MSC) depicted potential treatment as severely affected patients are associated with pneumonia, respiratory failure, ARDS, and pulmonary fibrosis cases. As a result, there has been an increase in the number of clinical trials. Countries such as the US, Spain, UK, France, Belgium, Mexico are conducting clinical trials for stem cell therapies to be used in the treatment against COVID-19.
Who are the key players in the stem cell therapy market?
Key players in the stem cell therapy market include Smith & Nephew (UK), MEDIPOST Co., Ltd. (South Korea), Anterogen Co., Ltd. (South Korea), PHARMICELL Co., Ltd. (South Korea
Which cell sources segment dominates in the stem cell therapy market?
In 2020, adipose tissue-derived MSCs accounted for the market's largest share due to their increasing utilization in treating inflammatory diseases and wounds & injuries. There are several associated advantages, such as ease of harvesting stem cells by minimally invasive methods, simplicity of the isolation procedure, and better quality & proliferation capacity of adipose tissue-derived stem cells.
Which therapeutic application segment of the global stem cell therapy market is expected to witness the highest growth?
The neurological disorders segment is expected to grow at the highest CAGR during the forecast period owing to the increasing prevalence of neurological disorders and the high cost of therapy.
What is the market size for stem cell therapy market?
The global stem cell therapy market is projected to reach USD 401.8 million by 2026 from USD 187.3 million in 2021, at a CAGR of 16.5% during the forecast period. .
To speak to our analyst for a discussion on the above findings, click Speak to Analyst
TABLE OF CONTENTS
1 INTRODUCTION (Page No. - 25)
1.1 OBJECTIVES OF THE STUDY
1.2 MARKET DEFINITION
1.2.1 INCLUSIONS & EXCLUSIONS
1.3 MARKET SCOPE
1.3.1 MARKETS COVERED
1.3.2 YEARS CONSIDERED FOR THE STUDY
1.4 CURRENCY
1.5 LIMITATIONS
1.6 STAKEHOLDERS
1.7 SUMMARY OF CHANGES
2 RESEARCH METHODOLOGY (Page No. - 30)
2.1 RESEARCH APPROACH
FIGURE 1 RESEARCH DESIGN
2.1.1 SECONDARY DATA
2.1.2 PRIMARY DATA
FIGURE 2 BREAKDOWN OF PRIMARIES: STEM CELL THERAPY MARKET
2.1.3 MARKET DATA ESTIMATION & TRIANGULATION
FIGURE 3 DATA TRIANGULATION METHODOLOGY
2.2 MARKET ESTIMATION METHODOLOGY
FIGURE 4 MARKET SIZE ESTIMATION APPROACH: COMPANY REVENUE ANALYSIS (BOTTOM-UP)
FIGURE 5 MARKET SIZE ESTIMATION APPROACH: PARENT MARKET (TOP DOWN)
FIGURE 6 STEM CELL THERAPY MARKET SIZE (USD MILLION): FINAL MARKET SIZE
2.3 GROWTH RATE ASSUMPTIONS/GROWTH FORECAST
FIGURE 7 GROWTH RATE ASSUMPTION BASED ON MARKET DYNAMICS
FIGURE 8 FINAL CAGR PROJECTIONS (2021−2026)
2.4 INSIGHTS FROM PRIMARIES
FIGURE 9 MARKET VALIDATION FROM PRIMARY EXPERTS
2.5 RESEARCH ASSUMPTIONS
2.6 RISK ASSESSMENT
TABLE 1 RISK ASSESSMENT
3 EXECUTIVE SUMMARY (Page No. - 39)
FIGURE 10 STEM CELL THERAPY MARKET SHARE, BY TYPE, 2020
FIGURE 11 STEM CELL THERAPY MARKET SHARE, BY CELL SOURCE, 2020
FIGURE 12 STEM CELL THERAPY MARKET, BY THERAPEUTIC APPLICATIONS, 2021 VS. 2026 (USD MILLION)
FIGURE 13 GEOGRAPHICAL SNAPSHOT OF THE STEM CELL THERAPY MARKET
4 PREMIUM INSIGHTS (Page No. - 42)
4.1 STEM CELL THERAPY MARKET OVERVIEW
FIGURE 14 INCREASING INVESTMENTS & FUNDING FOR STEM CELL RESEARCH IS A KEY FACTOR DRIVING MARKET GROWTH
4.2 NORTH AMERICA: STEM CELL THERAPY MARKET
FIGURE 15 ALLOGENEIC STEM CELL THERAPY TO COMMAND THE LARGEST SHARE OF THE NORTH AMERICAN STEM CELL THERAPY MARKET
4.3 STEM CELL THERAPY MARKET, BY CELL SOURCE
FIGURE 16 BONE MARROW-DERIVED MSCS TO GROW AT THE HIGHEST CAGR DURING THE FORECAST PERIOD
4.4 STEM CELL THERAPY MARKET: GEOGRAPHIC GROWTH OPPORTUNITIES
FIGURE 17 DEVELOPING MARKETS TO REGISTER HIGHER GROWTH RATES DURING THE FORECAST PERIOD
5 MARKET OVERVIEW (Page No. - 45)
5.1 INTRODUCTION
5.2 MARKET DYNAMICS
FIGURE 18 STEM CELL THERAPY MARKET: DRIVERS, OPPORTUNITIES, RESTRAINTS, CHALLENGES
5.2.1 DRIVERS
5.2.1.1 Availability of funding for stem cell research
FIGURE 19 STEM CELL RESEARCH FUNDING IN THE LAST 10 YEARS
TABLE 2 NIH FUNDING FOR CELL-BASED RESEARCH, 20162021 (USD MILLION)
5.2.1.2 Increasing GMP-certification approvals for cell therapy production facilities
TABLE 3 RECENT DEVELOPMENTS
5.2.1.3 Increasing clinical trials for stem cell based-therapies
FIGURE 20 NUMBER OF CLINICAL TRIALS (2015-2020)
FIGURE 21 CLINICAL TRIALS, BY PHASE
5.2.2 RESTRAINTS
5.2.2.1 Ethical concerns related to embryonic stem cells
5.2.2.2 High cost of cell-based research
5.2.3 OPPORTUNITIES
5.2.3.1 The emergence of iPSCs as an alternative to ESCs
5.2.3.2 Growing demand for cell & gene therapies
5.2.4 CHALLENGES
5.2.4.1 Technical limitations
5.3 COVID-19 IMPACT ANALYSIS
FIGURE 22 NUMBER OF CLINICAL TRIALS FOR COVID-19
FIGURE 23 CLINICAL TRIALS FOR COVID-19, BY COUNTRY
5.4 TECHNOLOGY ANALYSIS
TABLE 4 STEM CELL THERAPIES AND GENE THERAPIES
5.5 VALUE CHAIN ANALYSIS
FIGURE 24 VALUE CHAIN ANALYSIS OF THE STEM CELL THERAPY MARKET
5.6 ECOSYSTEM MARKET MAP
FIGURE 25 ECOSYSTEM OF THE STEM CELL THERAPY MARKET
5.7 SUPPLY CHAIN
FIGURE 26 SUPPLY CHAIN OF STEM CELL THERAPY MARKET
5.8 PORTERS FIVE FORCES ANALYSIS
5.8.1 THREAT OF NEW ENTRANTS
5.8.2 THREAT OF SUBSTITUTES
5.8.3 BARGAINING POWER OF SUPPLIERS
5.8.4 BARGAINING POWER OF BUYERS
5.8.5 INTENSITY OF COMPETITION RIVALRY
5.9 REGULATORY LANDSCAPE
5.9.1 NORTH AMERICA
TABLE 5 NORTH AMERICA: REGULATORY LANDSCAPE FOR STEM CELL THERAPIES
5.9.2 EUROPE
TABLE 6 EUROPE: REGULATORY LANDSCAPE FOR STEM CELL THERAPIES
5.9.3 ASIA PACIFIC
TABLE 7 ASIA PACIFIC: REGULATORY LANDSCAPE FOR STEM CELL THERAPIES
5.9.4 ROW
TABLE 8 ROW: REGULATORY LANDSCAPE FOR STEM CELL THERAPIES
5.10 PRICING ANALYSIS
TABLE 9 PRICING ANALYSIS OF CELL THERAPY PRODUCTS
5.11 PATENT ANALYSIS
FIGURE 27 PATENT ANALYSIS OF STEM CELL THERAPY IN THE LAST 10 YEARS (2011-2020)
6 STEM CELL THERAPY MARKET, BY TYPE (Page No. - 66)
6.1 INTRODUCTION
TABLE 10 STEM CELL THERAPY MARKET, BY TYPE, 20192026 (USD MILLION)
6.2 ALLOGENEIC STEM CELL THERAPY
6.2.1 EASE IN PRODUCTION PROCESSES TO DRIVE MARKET GROWTH
TABLE 11 ALLOGENEIC STEM CELL THERAPY MARKET, BY REGION, 20192026 (USD MILLION)
TABLE 12 NORTH AMERICA: ALLOGENEIC STEM CELL THERAPY MARKET, BY COUNTRY, 20192026 (USD MILLION)
TABLE 13 EUROPE: ALLOGENEIC STEM CELL THERAPY MARKET, BY COUNTRY, 20192026 (USD MILLION)
TABLE 14 APAC: ALLOGENEIC STEM CELL THERAPY MARKET, BY COUNTRY, 20192026 (USD MILLION)
6.3 AUTOLOGOUS STEM CELL THERAPY
6.3.1 LOW RISK OF POST-TREATMENT COMPLICATIONS TO DRIVE THE MARKET GROWTH
TABLE 15 AUTOLOGOUS STEM CELL THERAPY MARKET, BY REGION, 20192026 (USD MILLION)
TABLE 16 NORTH AMERICA: AUTOLOGOUS STEM CELL THERAPY MARKET, BY COUNTRY, 20192026 (USD MILLION)
TABLE 17 EUROPE: AUTOLOGOUS STEM CELL THERAPY MARKET, BY COUNTRY, 20192026 (USD MILLION)
TABLE 18 APAC: AUTOLOGOUS STEM CELL THERAPY MARKET, BY COUNTRY, 20192026 (USD MILLION)
7 STEM CELL THERAPY MARKET, BY CELL SOURCE (Page No. - 71)
7.1 INTRODUCTION
TABLE 19 STEM CELL THERAPY MARKET, BY CELL SOURCE, 20192026 (USD MILLION)
7.2 ADIPOSE TISSUE-DERIVED MSCS
7.2.1 ADVANTAGES OF BEING EASY TO ISOLATE AND HARVEST DRIVES THE MARKET GROWTH OF THIS SEGMENT
TABLE 20 STEM CELL THERAPY MARKET FOR ADIPOSE TISSUE-DERIVED MSCS, BY REGION, 20192026 (USD MILLION)
TABLE 21 NORTH AMERICA: STEM CELL THERAPY MARKET FOR ADIPOSE TISSUE-DERIVED MSCS, BY COUNTRY, 20192026 (USD MILLION)
TABLE 22 EUROPE: STEM CELL THERAPY MARKET FOR ADIPOSE-TISSUE DERIVED MSCS, BY COUNTRY, 20192026 (USD MILLION)
TABLE 23 APAC: STEM CELL THERAPY MARKET FOR ADIPOSE-TISSUE DERIVED MSCS, BY COUNTRY, 20192026 (USD MILLION)
7.3 BONE MARROW-DERIVED MSCS
7.3.1 INCREASING CASES OF METABOLIC DISORDERS TO SUPPORT MARKET GROWTH OF THIS SEGMENT
TABLE 24 STEM CELL THERAPY MARKET FOR BONE MARROW-DERIVED MSCS, BY REGION, 20192026 (USD MILLION)
TABLE 25 NORTH AMERICA: STEM CELL THERAPY MARKET FOR BONE MARROW-DERIVED MSCS, BY COUNTRY, 20192026 (USD MILLION)
TABLE 26 EUROPE: STEM CELL THERAPY MARKET FOR BONE MARROW-DERIVED MSCS, BY COUNTRY, 20192026 (USD MILLION)
TABLE 27 APAC: STEM CELL THERAPY MARKET FOR BONE MARROW-DERIVED MSCS, BY COUNTRY, 20192026 (USD MILLION)
7.4 PLACENTA/UMBILICAL CORD-DERIVED MSCS
7.4.1 LOW CHANCES OF REJECTION FROM THE IMMUNE SYSTEM IS LIKELY TO SUPPORT MARKET GROWTH OF THIS SEGMENT
TABLE 28 STEM CELL THERAPY MARKET FOR PLACENTA/UMBILICAL CORD-DERIVED MSCS, BY REGION, 20192026 (USD MILLION)
TABLE 29 NORTH AMERICA: STEM CELL THERAPY MARKET FOR PLACENTA/UMBILICAL CORD-DERIVED MSCS, BY COUNTRY, 20192026 (USD MILLION)
TABLE 30 EUROPE: STEM CELL THERAPY MARKET FOR PLACENTA/UMBILICAL CORD-DERIVED MSCS, BY COUNTRY, 20192026 (USD MILLION)
TABLE 31 APAC: STEM CELL THERAPY MARKET FOR PLACENTA/UMBILICAL CORD-DERIVED MSCS, BY COUNTRY, 20192026 (USD MILLION)
7.5 OTHER CELL SOURCES
TABLE 32 STEM CELL THERAPY MARKET FOR OTHER CELL SOURCES, BY REGION, 20192026 (USD MILLION)
TABLE 33 NORTH AMERICA: STEM CELL THERAPY MARKET FOR OTHER CELL SOURCES, BY COUNTRY, 20192026 (USD MILLION)
8 STEM CELL THERAPY MARKET, BY THERAPEUTIC APPLICATION (Page No. - 80)
8.1 INTRODUCTION
TABLE 34 STEM CELL THERAPY MARKET, BY THERAPEUTIC APPLICATION, 20192026 (USD MILLION)
8.2 MUSCULOSKELETAL DISORDERS
8.2.1 INCREASING CASES OF OSTEOARTHRITIS TO DRIVE THE MARKET GROWTH OF THIS SEGMENT
TABLE 35 MUSCULOSKELETAL DISORDERS MARKET, BY REGION, 20192026 (USD MILLION)
TABLE 36 NORTH AMERICA: MUSCULOSKELETAL DISORDERS MARKET, BY COUNTRY, 20192026 (USD MILLION)
TABLE 37 EUROPE: MUSCULOSKELETAL DISORDERS MARKET, BY COUNTRY, 20192026 (USD MILLION)
TABLE 38 APAC: MUSCULOSKELETAL DISORDERS MARKET, BY COUNTRY, 20192026 (USD MILLION)
8.3 WOUNDS & INJURIES
8.3.1 INCREASING BENEFITS OF ALLOGENEIC-BASED THERAPIES TO SUPPORT THE MARKET GROWTH
TABLE 39 WOUNDS & INJURIES MARKET, BY REGION, 20192026 (USD MILLION)
TABLE 40 NORTH AMERICA: WOUNDS & INJURIES MARKET, BY COUNTRY, 20192026 (USD MILLION)
TABLE 41 EUROPE: WOUNDS & INJURIES MARKET, BY COUNTRY, 20192026 (USD MILLION)
TABLE 42 APAC: WOUNDS & INJURIES MARKET, BY COUNTRY, 20192026 (USD MILLION)
8.4 INFLAMMATORY & AUTOIMMUNE DISEASES
8.4.1 INCREASING CLINICAL TRIALS FOR THIS SEGMENT IS LIKELY TO SUPPORT MARKET GROWTH
TABLE 43 INFLAMMATORY & AUTOIMMUNE DISEASES MARKET, BY REGION, 20192026, (USD MILLION)
TABLE 44 NORTH AMERICA: INFLAMMATORY & AUTOIMMUNE DISEASES MARKET, BY COUNTRY, 20192026 (USD MILLION)
TABLE 45 EUROPE: INFLAMMATORY & AUTOIMMUNE DISEASES MARKET, BY COUNTRY, 20192026 (USD MILLION)
TABLE 46 APAC: INFLAMMATORY & INFLAMMATORY DISEASES MARKET, BY COUNTRY, 20192026 (USD MILLION)
8.5 SURGERIES
8.5.1 INCREASING CLINICAL RESEARCH FOR SURGICAL APPLICATIONS TO SUPPORT MARKET GROWTH
TABLE 47 SURGERIES MARKET, BY REGION, 20192026 (USD MILLION)
TABLE 48 NORTH AMERICA: SURGERIES MARKET, BY COUNTRY, 20192026 (USD MILLION)
TABLE 49 EUROPE: SURGERIES MARKET, BY COUNTRY, 20192026 (USD MILLION)
TABLE 50 APAC: SURGERIES MARKET, BY COUNTRY, 20192026 (USD MILLION)
8.6 CARDIOVASCULAR DISEASES
8.6.1 INCREASING PUBLIC & PRIVATE FUNDING FOR CVD RESEARCH IS LIKELY TO SUPPORT MARKET GROWTH
TABLE 51 CARDIOVASCULAR DISEASES MARKET, BY REGION, 20192026 (USD MILLION)
TABLE 52 NORTH AMERICA: CARDIOVASCULAR DISEASES MARKET, BY COUNTRY, 20192026 (USD MILLION)
TABLE 53 EUROPE: CARDIOVASCULAR DISEASES MARKET, BY COUNTRY, 20192026 (USD MILLION)
TABLE 54 APAC: CARDIOVASCULAR DISEASES MARKET, BY COUNTRY, 20192026 (USD MILLION)
8.7 NEUROLOGICAL DISORDERS
8.7.1 RISING PREVALENCE OF NEUROGENERATIVE DISORDERS SUPPORTS MARKET GROWTH OF THIS SEGMENT
TABLE 55 NEUROLOGICAL DISORDERS MARKET, BY REGION, 20192026 (USD MILLION)
TABLE 56 NORTH AMERICA: NEUROLOGICAL DISORDERS MARKET, BY COUNTRY, 20192026 (USD MILLION)
TABLE 57 EUROPE: NEUROLOGICAL DISORDERS MARKET, BY COUNTRY, 20192026 (USD MILLION)
TABLE 58 APAC: NEUROLOGICAL DISORDERS MARKET, BY COUNTRY, 20192026 (USD MILLION)
8.8 OTHER THERAPEUTIC APPLICATIONS
TABLE 59 OTHER THERAPEUTIC APPLICATIONS MARKET, BY REGION, 20192026 (USD MILLION)
TABLE 60 NORTH AMERICA: OTHER THERAPEUTIC APPLICATIONS MARKET, BY COUNTRY, 20192026 (USD MILLION)
9 STEM CELL THERAPY MARKET, BY REGION (Page No. - 93)
9.1 INTRODUCTION
FIGURE 28 STEM CELL THERAPY MARKET SNAPSHOT
TABLE 61 STEM CELL THERAPY MARKET, BY REGION, 20192026 (USD MILLION)
9.2 NORTH AMERICA
FIGURE 29 NORTH AMERICA: STEM CELL THERAPY MARKET SNAPSHOT
TABLE 62 NORTH AMERICA: STEM CELL THERAPY MARKET, BY COUNTRY, 20192026 (USD MILLION)
TABLE 63 NORTH AMERICA: STEM CELL THERAPY MARKET, BY CELL SOURCE, 20192026 (USD MILLION)
TABLE 64 NORTH AMERICA: STEM CELL THERAPY MARKET, BY TYPE, 20192026 (USD MILLION)
TABLE 65 NORTH AMERICA: STEM CELL THERAPY MARKET, BY THERAPEUTIC APPLICATION, 20192026 (USD MILLION)
9.2.1 US
9.2.1.1 Increasing investments and funding for stem cell research drive the market growth in the UK
FIGURE 30 NIH FUNDING IN THE LAST 10 YEARS (2011─2021)
TABLE 66 US: STEM CELL THERAPY MARKET, BY CELL SOURCE, 20192026 (USD MILLION)
TABLE 67 US: STEM CELL THERAPY MARKET, BY TYPE, 20192026 (USD MILLION)
TABLE 68 US: STEM CELL THERAPY MARKET, BY THERAPEUTIC APPLICATION, 20192026 (USD MILLION)
9.2.2 CANADA
9.2.2.1 Rising approvals of stem cell therapies in Canada are likely to boost the market
TABLE 69 CANADA: STEM CELL THERAPY MARKET, BY CELL SOURCE, 20192026 (USD MILLION)
TABLE 70 CANADA: STEM CELL THERAPY MARKET, BY TYPE, 20192026 (USD MILLION)
TABLE 71 CANADA: STEM CELL THERAPY MARKET, BY THERAPEUTIC APPLICATION, 20192026 (USD MILLION)
9.3 EUROPE
TABLE 72 EUROPE: STEM CELL THERAPY MARKET, BY COUNTRY, 20192026 (USD MILLION)
TABLE 73 EUROPE: STEM CELL THERAPY MARKET, BY CELL SOURCE, 20192026 (USD MILLION)
TABLE 74 EUROPE: STEM CELL THERAPY MARKET, BY TYPE, 20192026 (USD MILLION)
TABLE 75 EUROPE: STEM CELL THERAPY MARKET, BY THERAPEUTIC APPLICATION, 20192026 (USD MILLION)
9.3.1 GERMANY
9.3.1.1 Strong R&D base and focus on minimally invasive surgeries to drive market growth in Germany
TABLE 76 GERMANY: STEM CELL THERAPY MARKET, BY CELL SOURCE, 20192026 (USD MILLION)
TABLE 77 GERMANY: STEM CELL THERAPY MARKET, BY TYPE, 20192026 (USD MILLION)
TABLE 78 GERMANY: STEM CELL THERAPY MARKET, BY THERAPEUTIC APPLICATION, 20192026 (USD MILLION)
9.3.2 UK
9.3.2.1 The rising adoption of cell-based therapies in the UK drives the market growth
TABLE 79 UK: STEM CELL THERAPY MARKET, BY CELL SOURCE, 20192026 (USD MILLION)
TABLE 80 UK: STEM CELL THERAPY MARKET, BY TYPE, 20192026 (USD MILLION)
TABLE 81 UK: STEM CELL THERAPY MARKET, BY THERAPEUTIC APPLICATION, 20192026 (USD MILLION)
9.3.3 FRANCE
9.3.3.1 Rising healthcare expenditure is likely to drive market growth in France for stem cell therapy
TABLE 82 FRANCE: STEM CELL THERAPY MARKET, BY CELL SOURCE, 20192026 (USD MILLION)
TABLE 83 FRANCE: STEM CELL THERAPY MARKET, BY TYPE, 20192026 (USD MILLION)
TABLE 84 FRANCE: STEM CELL THERAPY MARKET, BY THERAPEUTIC APPLICATION, 20192026 (USD MILLION)
9.3.4 REST OF EUROPE
TABLE 85 ROE: STEM CELL THERAPY MARKET, BY CELL SOURCE, 20192026 (USD MILLION)
TABLE 86 ROE: STEM CELL THERAPY MARKET, BY TYPE, 20192026 (USD MILLION)
TABLE 87 ROE: STEM CELL THERAPY MARKET, BY THERAPEUTIC APPLICATION, 20192026 (USD MILLION)
9.4 ASIA PACIFIC
FIGURE 31 ASIA PACIFIC: STEM CELL THERAPY MARKET SNAPSHOT
TABLE 88 APAC: STEM CELL THERAPY MARKET, BY COUNTRY, 20192026 (USD MILLION)
TABLE 89 APAC: STEM CELL THERAPY MARKET, BY CELL SOURCE, 20192026 (USD MILLION)
TABLE 90 APAC: STEM CELL THERAPY MARKET, BY TYPE, 20192026 (USD MILLION)
TABLE 91 APAC: STEM CELL THERAPY MARKET, BY THERAPEUTIC APPLICATION, 20192026 (USD MILLION)
9.4.1 JAPAN
9.4.1.1 Growing geriatric population and faster regulatory approval process is expected to augment market growth in Japan
TABLE 92 JAPAN: STEM CELL THERAPY MARKET, BY CELL SOURCE 20192026 (USD MILLION)
TABLE 93 JAPAN: STEM CELL THERAPY MARKET, BY TYPE, 20192026 (USD MILLION)
TABLE 94 JAPAN: STEM CELL THERAPY MARKET, BY THERAPEUTIC APPLICATION, 20192026 (USD MILLION)
9.4.2 SOUTH KOREA
9.4.2.1 The presence of major players supports market growth in South Korea
TABLE 95 SOUTH KOREA: STEM CELL THERAPY MARKET, BY CELL SOURCE, 20192026 (USD MILLION)
TABLE 96 SOUTH KOREA: STEM CELL THERAPY MARKET, BY TYPE, 20192026 (USD MILLION)
TABLE 97 SOUTH KOREA: STEM CELL THERAPY MARKET, BY THERAPEUTIC APPLICATION, 20192026 (USD MILLION)
9.4.3 INDIA
9.4.3.1 Rising number of neurodegenerative disorders to drive market growth in India
TABLE 98 INDIA: STEM CELL THERAPY MARKET, BY CELL SOURCE, 20192026 (USD MILLION)
TABLE 99 INDIA: STEM CELL THERAPY MARKET, BY TYPE, 20192026 (USD MILLION)
TABLE 100 INDIA: STEM CELL THERAPY MARKET, BY THERAPEUTIC APPLICATION, 20192026 (USD MILLION)
9.4.4 REST OF ASIA PACIFIC
TABLE 101 ROAPAC: STEM CELL THERAPY MARKET, BY CELL SOURCE, 20192026 (USD MILLION)
TABLE 102 ROAPAC: STEM CELL THERAPY MARKET, BY TYPE, 20192026 (USD MILLION)
TABLE 103 ROAPAC: STEM CELL THERAPY MARKET, BY THERAPEUTIC APPLICATION, 20192026 (USD MILLION)
9.5 REST OF THE WORLD
TABLE 104 ROW: STEM CELL THERAPY MARKET, BY CELL SOURCE, 20192026 (USD MILLION)
TABLE 105 ROW: STEM CELL THERAPY MARKET, BY TYPE, 20192026 (USD MILLION)
TABLE 106 ROW: STEM CELL THERAPY MARKET, BY THERAPEUTIC APPLICATION, 20192026 (USD MILLION)
10 COMPETITIVE LANDSCAPE (Page No. - 117)
10.1 OVERVIEW
10.2 REVENUE SHARE ANALYSIS OF TOP MARKET PLAYERS
FIGURE 32 TOP MARKET PLAYERS DOMINATE THE STEM CELL THERAPY MARKET
10.3 MARKET SHARE ANALYSIS
FIGURE 33 STEM CELL THERAPY MARKET RANK, BY KEY PLAYER (2020)
TABLE 107 STEM CELL THERAPY MARKET: DEGREE OF COMPETITION
10.4 COMPETITIVE LEADERSHIP MAPPING
10.4.1 STARS
10.4.2 EMERGING LEADERS
10.4.3 PERVASIVE PLAYERS
10.4.4 PARTICIPANTS
FIGURE 34 STEM CELL THERAPY MARKET: COMPANY EVALUATION QUADRANT (2020)- APPROVED PRODUCTS
10.5 STEM CELL THERAPY MARKET: SME EVALUATION MATRIX, 2020 (UNDER PIPELINE)
10.5.1 PROGRESSIVE COMPANIES
10.5.2 STARTING BLOCKS
10.5.3 RESPONSIVE COMPANIES
10.5.4 DYNAMIC COMPANIES
FIGURE 35 STEM CELL THERAPY MARKET: SME EVALUATION MATRIX, 2020 (UNDER PIPELINE)
10.6 COMPANY PRODUCT FOOTPRINT
FIGURE 36 PRODUCT PORTFOLIO ANALYSIS BY APPLICATION: STEM CELL THERAPY MARKET
10.7 COMPANY GEOGRAPHIC FOOTPRINT OF MAJOR PLAYERS IN THE STEM CELL THERAPY MARKET
FIGURE 37 GEOGRAPHIC REVENUE MIX: STEM CELL THERAPY MARKET (2020)
10.8 COMPETITIVE SCENARIO
10.8.1 PRODUCT LAUNCHES
10.8.2 DEALS
TABLE 109 STEM CELL THERAPY MARKET: DEALS, MARCH 2019JANUARY 2021
10.8.3 OTHER DEVELOPMENTS
TABLE 110 STEM CELL THERAPY MARKET: OTHER DEVELOPMENTS (MAY 2019NOVEMBER 2020)
11 COMPANY PROFILES (Page No. - 128)
11.1 MAJOR PLAYERS
11.1.1 SMITH & NEPHEW
11.1.1.1 Business overview
TABLE 111 SMITH & NEPHEW: BUSINESS OVERVIEW
FIGURE 38 SMITH & NEPHEW: COMPANY SNAPSHOT (2020)
11.1.1.2 Products offered
TABLE 112 SMITH & NEPHEW : PRODUCTS OFFERED
11.1.1.3 Recent developments
11.1.1.4 Right to win
11.1.2 MEDIPOST
11.1.2.1 Business overview
TABLE 113 MEDIPOST : BUSINESS OVERVIEW
FIGURE 39 MEDIPOST: COMPANY SNAPSHOT (2019)
11.1.2.2 Products offered
TABLE 114 MEDIPOST : PRODUCTS OFFERED
11.1.2.3 Recent developments
11.1.2.4 Right to win
11.1.3 ANTEROGEN
11.1.3.1 Business overview
TABLE 115 ANTEROGEN: BUSINESS OVERVIEW
TABLE 116 ANTEROGEN: PRODUCTS OFFERED
11.1.4 CORESTEM
11.1.4.1 Business overview
TABLE 117 CORESTEM : BUSINESS OVERVIEW
11.1.4.2 Products offered
TABLE 118 CORESTEM: PRODUCTS OFFERED
11.1.4.3 Recent developments
11.1.5 PHARMICELL
11.1.5.1 Business overview
TABLE 119 PHARMICELL : BUSINESS OVERVIEW
11.1.5.2 Products offered
TABLE 120 PHARMICELL: PRODUCTS OFFERED
11.1.5.3 Recent developments
11.1.6 NUVASIVE
11.1.6.1 Business overview
TABLE 121 NUVASIVE: BUSINESS OVERVIEW
FIGURE 40 NUVASIVE: COMPANY SNAPSHOT (2020)
11.1.6.2 Products offered
TABLE 122 NUVASIVE: PRODUCTS OFFERED
11.1.7 RTI SURGICAL
11.1.7.1 Business overview
TABLE 123 RTI SURGICAL : BUSINESS OVERVIEW
11.1.7.2 Products offered
TABLE 124 RTI SURGICAL: PRODUCTS OFFERED
11.1.8 ALLOSOURCE
11.1.8.1 Business overview
TABLE 125 ALLOSOURCE: BUSINESS OVERVIEW
11.1.8.2 Products offered
TABLE 126 ALLOSOURCE: PRODUCTS OFFERED
11.1.9 JCR PHARMACEUTICALS
11.1.9.1 Business overview
TABLE 127 JCR PHARMACEUTICALS: BUSINESS OVERVIEW
FIGURE 41 JCR PHARMACEUTICALS: COMPANY SNAPSHOT (2019)
11.1.9.2 Products offered
TABLE 128 JCR PHARMACEUTICALS: PRODUCTS OFFERED
11.1.10 TAKEDA PHARMACEUTICAL COMPANY
11.1.10.1 Business overview
TABLE 129 TAKEDA PHARMACEUTICAL COMPANY: BUSINESS OVERVIEW
FIGURE 42 TAKEDA PHARMACEUTICAL COMPANY: COMPANY SNAPSHOT (2019)
11.1.10.2 Products offered
TABLE 130 TAKEDA PHARMACEUTICAL COMPANY: PRODUCTS OFFERED
11.1.10.3 Recent developments
11.1.11 HOLOSTEM TERAPIE AVANZATE
11.1.11.1 Business overview
TABLE 131 HOLOSTEM TERAPIE AVANZATE : BUSINESS OVERVIEW
11.1.11.2 Products offered
TABLE 132 HOLOSTEM TERAPIE AVANZATE : PRODUCTS OFFERED
11.1.12 ORTHOFIX
11.1.12.1 Business overview
TABLE 133 ORTHOFIX : BUSINESS OVERVIEW
FIGURE 43 ORTHOFIX: COMPANY SNAPSHOT (2019)
11.1.12.2 Products offered
TABLE 134 ORTHOFIX: PRODUCTS OFFERED
11.1.13 STEMPEUTICS RESEARCH
11.1.14 REGROW BIOSCIENCES
11.2 OTHER PLAYERS (UNDER PIPELINE)
11.2.1 ATHERSYS
11.2.1.1 Business overview
TABLE 135 ATHERSYS: BUSINESS OVERVIEW
FIGURE 44 ATHERSYS: COMPANY SNAPSHOT (2019)
11.2.1.2 Products offered
TABLE 136 ATHERSYS: PRODUCTS OFFERED
11.2.2 MESOBLAST
11.2.2.1 Business overview
TABLE 137 MESOBLAST: BUSINESS OVERVIEW
FIGURE 45 MESOBLAST: COMPANY SNAPSHOT (2020)
11.2.2.2 Products offered
TABLE 138 MESOBLAST: PRODUCTS OFFERED
11.2.3 BIORESTORATIVE THERAPIES
11.2.3.1 Business overview
TABLE 139 BIORESTORATIVE THERAPIES : BUSINESS OVERVIEW
11.2.3.2 Products offered
TABLE 140 BIORESTORATIVE THERAPIES: PRODUCTS OFFERED
11.2.4 PLURISTEM THERAPUTICS
11.2.4.1 Business overview
TABLE 141 PLURISTEM THERAPIES: BUSINESS OVERVIEW
11.2.4.2 Products offered
TABLE 142 PLURISTEM THERAPIES: PRODUCTS OFFERED
11.2.4.3 Recent Development
11.2.5 BRAINSTORM CELL THERAPEUTICS
11.2.6 GAMIDA CELL
11.2.7 VIACYTE
11.2.8 KANGSTEM BIOTECH
11.2.9 HOPE BIOSCIENCES
11.2.10 CELLULAR BIOMEDICINE GROUP
11.2.11 PERSONALIZED STEM CELLS
12 APPENDIX (Page No. - 156)
12.1 DISCUSSION GUIDE
12.2 KNOWLEDGE STORE: MARKETSANDMARKETS SUBSCRIPTION PORTAL
12.3 AVAILABLE CUSTOMIZATIONS
12.4 RELATED REPORTS
12.5 AUTHOR DETAILS
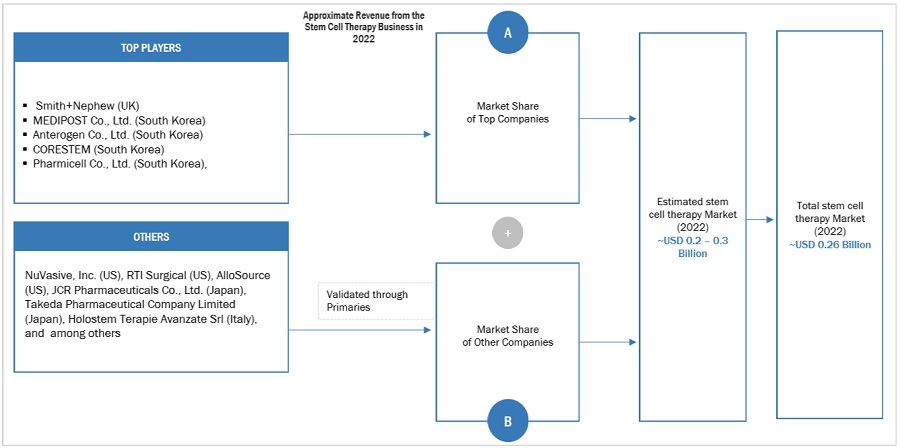
This study involved four major activities in estimating the current size of the stem cell therapy market. Exhaustive secondary research was carried out to collect information on the market, its peer markets, and its parent market. The next step was to validate these findings, assumptions, and sizing with industry experts across the value chain through primary research. Both top-down and bottom-up approaches were employed to estimate the complete market size. After that, market breakdown and data triangulation procedures were used to estimate the market size of segments and subsegments.
Secondary research was used mainly to identify and collect information for the extensive, technical, market-oriented, and commercial study of the stem cell therapy market. The secondary sources used for this study include Some of the key secondary sources referred to for this study include publications from government sources World Health Organization, Organisation for Economic Co-operation and Development, The World Bank, US Census Bureau, International Society for Stem Cell Research (US), National Stem Cell Foundation (US), International Society for Cellular Therapy (ISCT), EuroStemCell, European Society of Gene and Cell Therapy, German Stem Cell Network, Japan Human Cell Society, Chinese Stem Cell Foundation, Brazilian Association of Cell Therapy, Alliance for Regenerative Medicine (ARM)]. These sources were also used to obtain key information about major players, market classification, and segmentation according to industry trends, regional/country-level markets, market developments, and technology perspectives.
In-depth interviews were conducted with various primary respondents, including key industry participants, subject-matter experts (SMEs), C-level executives of key market players, and industry consultants, among other experts, to obtain and verify the critical qualitative and quantitative information as well as assess future prospects of the market. Various primary sources from both the supply and demand sides of the market were interviewed to obtain qualitative and quantitative information. The following is a breakdown of the primary respondents:
To know about the assumptions considered for the study, download the pdf brochure
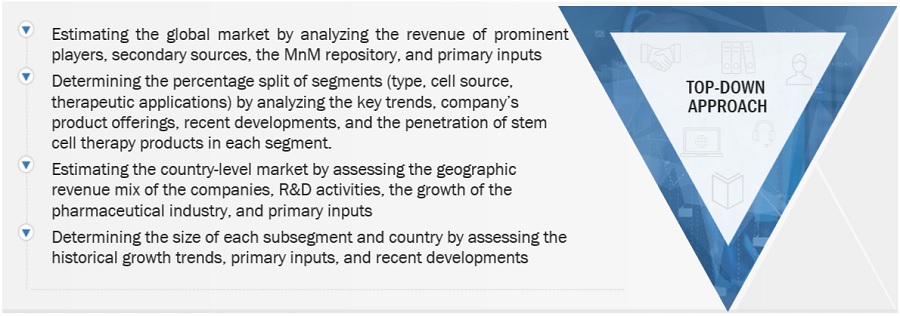
Both top-down and bottom-up approaches were used to estimate and validate the total size of the stem cell therapy market. These methods were also used extensively to estimate the size of various subsegments in the market. The research methodology used to estimate the market size includes the following:
After arriving at the overall market size from the market size estimation process, the total market was split into several segments and subsegments. To complete the overall market engineering process and arrive at the exact statistics for all segments and subsegments, data triangulation and market breakdown procedures were employed, wherever applicable. The data was triangulated by studying various factors and trends from both the demand and supply sides.
With the given market data, MarketsandMarkets offers customizations as per the companys specific needs. The following customization options are available for this report:
Company Information
Growth opportunities and latent adjacency in Stem Cell Therapy Market