Student Information System Market

Student Information System Market by Component (Solutions (Enrollment, Academics, Financial Aid, and Billing) and Professional Services), End User (K-12 and Higher Education), Deployment Mode and Region - Global Forecast to 2027

Report Code: TC 7018 May, 2022, by marketsandmarkets.com

The global student information system market size was valued at USD 10.2 billion in 2022 and is expected to expand at a CAGR of 14.9% during the forecast period, reaching revenue forecast $20.5 billion by 2027.

The Student Information System Market growth is driven by the primary factors such as growth in access to higher education and compelling need to streamline administration processes. Moreover, rising adoption of cloud-based systems drive the demand of these solutions in the near future. The student information system market is expected to gain more traction due to increased opportunities with the advancement in data gathering and analysis techniques. Vendors offer SIS empowered with AI and ML to track student behavior and performance. This would help institutions understand students’ needs and design the curriculum accordingly. It also helps with marketing prospective students, estimating class size, planning curricula, and allocating resources such as financial aid and facilities.

Student Information System Market

To know about the assumptions considered for the study, Request for Free Sample Report

Student Information System Market Growth Dynamics

Driver: Need to streamline administration processes

There is an increasing demand among educational institutions to improve the internal business processes and minimize the laborious manual tasks. Academic institutions require improved management of student information to ensure proper retrieval of information across different departments. Student information systems help academic institutions to manage their business processes, such as enrolments, academics, financial aid, and billing effectively. They help manage student information in an organized, holistic and cost-effective way. Students and teachers had to collaborate with administrators for managing courses and delivering student information through manual processes. Thus, SIS solutions help to minimize the time required to maintain organized records and help institutions to streamline their academic processes. It also ensures proper communication across departments. SIS solutions have turned out to be quite effective as they are able to integrate activities effectively, thereby allowing educators to integrate varied business processes for students, teachers, and faculties.

Restraint: Risk of data loss and security breaches

Records in educational institutions are vulnerable to security breaches. This makes schools and higher education institutions a common target for identity theft and fraud. If proper precautions are not taken, when files and documents are shared on websites, smartphones and tablets via internet networks, the information contained on them might get exposed to risks. Hackers and fraudsters use viruses, malware, spyware, spam, and phishing to gain access to sensitive personal information and commit financial crimes. There is also a risk of that sensitive academic data will be leaked by staff. Moreover, institutions tend to use their credentials for accessing 3rd party APIs, exposing the institution and its data to risk.

Opportunity: Advancements in eLearning technologies

Owing to the increasing adoption of SIS solutions, vendors are constantly trying to implement new technologies to improve their offerings. Artificial Intelligence (AI) can be implemented to track and analyze student behavior which could help the faculty understand the student’s needs and weak points. This helps to analyze students’ thought processes and learning styles from their daily interactions, which helps to provide tailored courses to provide a personalized learning experience. This helps learners acquire knowledge in the way that best suits them. Other technologies such as IoT help automate the attendance process to deliver a more efficient and accurate system.

Challenge: Need for technical training for teachers and instructors

In most educational institutions, there is a lack of expertise among the educational institutions about digital technologies, which leads to the improper implementation of any digital solution. Because of the lack of expertise among educators, they select the wrong vendor for the implementation of the SIS, which ultimately leads to increased expenses. The factor is not limited to any particular country or region and is a challenge faced by educational institutes and faculties worldwide. According to the Educase Horizon report 2019, technological adoption was one of the major challenges faced by educational institutions.

Student Information System Market Supply Chain

Student Information System Market Supply Chain

To know about the assumptions considered for the study, download the pdf brochure

By Component, the Professional Services segment to have the higher growth during the forecast period

The Professional Services segment is expected to have the highest growth rate during the forecast period. Professional services are categorized into three types: training & consulting services, deployment & integration, and support & maintenance. Professional services include designing, planning, upgradation, and a host of consulting services offered to clients. The growth of the professional services segment is majorly governed by the complexity of operations and the increasing deployment of advanced technological solutions, such as AI, IoT, and ML.

By Deployment Mode, the On-premises segment to have the highest market size during the forecast period

The On-premises segment to have the highest share in the market. On-premises solutions offer institutions the power to manage risks, business processes, and industry policies and enables compliance management. Security and compliance are major concerns for institutions to manage the ever-increasing demand for customer experience. The adoption of on-premises SIS solutions reduces security risks and helps in boosting customer experience.

By Region, Asia Pacific to record the highest growth during the forecast period

Asia Pacific is one of the fastest-developing regions globally, making the region highly profitable for the Student Information System market. It is expected to be the fastest-growing market owing to the rapid economic developments, globalization, digitalization, and the increased internet penetration. Japan and China, being two of the most technologically advanced countries in the region, are the undisputed leaders in the Student Information System market. Government initiatives to promote the digital infrastructure are responsible for driving the adoption of SIS solutions in the region. As education institutions in Asia Pacific have begun to embrace digital solutions to improve operational efficiency, Asia Pacific is likely to create lucrative opportunities for SIS providers.

Asia Pacific: Student Information System Market Snapshot

Student Information System Market by Region

Key Market Players

The report includes the study of key players offering Student Information System solutions and services. The major vendors in the Student Information System market Oracle (US), Workday (US), Ellucian (US), PowerSchool (US), Jenzabar (US), Skyward (US), Tribal Group (UK), Illuminate Education (US), Arth Infosoft (India), and Focus School Software (US).

The study includes an in-depth competitive analysis of these key players in the Student Information System market with their company profiles, recent developments, and key market strategies.

Get online access to the report on the World's First Market Intelligence Cloud

  • Easy to Download Historical Data & Forecast Numbers
  • Company Analysis Dashboard for high growth potential opportunities
  • Research Analyst Access for customization & queries
  • Competitor Analysis with Interactive dashboard
  • Latest News, Updates & Trend analysis
Request Sample

Scope of the Report

Report Metrics

Details

Market size value in 2022

$10.2 Billion

Revenue forecast Size in 2027

$20.5 Billion

Growth Rate

14.9% CAGR from 2022 to 2027

Key Market Growth Drivers

Need to streamline administration processes

Key Market Opportunities

Advancements in eLearning technologies

Base year considered

2021

Forecast period

2022-2027

Forecast units

Value (USD Billion)

Segments covered

By Component, Deployment Mode, End User, and Region

Regions covered

North America, Europe, Asia Pacific, Middle East & Africa, and Latin America

Fastest Growing Region

APAC

Companies covered

Major vendors include Oracle (US), Workday (US), Ellucian (US), PowerSchool (US), and Jenzabar (US) (Total 30 companies)

This research report categorizes the Student information system market to forecast revenues and analyze trends in each of the following subsegments:

By Component:
  • Solutions
    • Enrollment
    • Academics
    • Billing
    • Financial Aid
  • Professional Services
    • Training & Consulting
    • Deployment & Integration
    • Support & Maintenance
By Deployment Mode:
  • Cloud
  • On-premises
By End User:
  • K-12
  • Higher Education
By Region:
  • North America
    • United States
    • Canada
  • Europe
    • United Kingdom
    • Germany
    • France
    • Rest of Europe
  • Asia Pacific
    • China
    • Japan
    • India
    • Australia
    • Rest of Asia Pacific
  • Middle East & Africa
    • United Arab Emirates
    • Kingdom of Saudi Arabia
    • Rest of Middle East & Africa
  • Latin America
    • Brazil
    • Mexico
    • Rest of Latin America

Recent Developments:

  • In February 2022, PowerSchool introduced enhancements to Its Naviance solution to help educators and students make informed college, career, and life readiness decisions.
  • In December 2021, Workday acquired VNDLY, an industry leader in cloud-based external workforce and vendor management technology.
  • In October 2021, Ellucian partnered with D2L, a global learning innovation technology leader. Through this partnership, more colleges and universities easily integrate their LMS and ERP/SIS platforms, thereby ensuring a streamlined experience beginning with the sales process through to implementation and support.
  • In July 2021, Ellucian launched Ellucian Experience, a SaaS-based, fully extensible user experience platform. This solution is now available in Europe, the Middle East, Africa and Asia Pacific. Ellucian Experience simplified everyday tasks and access to essential information through a single application framework and personalized dashboard for all higher education constituents.
  • In January 2020, Jenzabar partnered with Softdocs, the education-focused ECM provider. Through this partnership, a Jenzabar-integrated version of the Softdocs Etrieve platform will be available to all higher education institutions leveraging Jenzabar solutions.

Frequently Asked Questions (FAQ):


To speak to our analyst for a discussion on the above findings, click Speak to Analyst

TABLE OF CONTENTS

1 INTRODUCTION (Page No. - 26)
    1.1 OBJECTIVES OF THE STUDY
    1.2 MARKET DEFINITION
    1.3 MARKET SCOPE
           1.3.1 MARKET SEGMENTATION
                    FIGURE 1 STUDENT INFORMATION SYSTEM MARKET: SEGMENTATION
           1.3.2 REGIONS COVERED
                    FIGURE 2 MARKET: REGIONS COVERED
           1.3.3 INCLUSIONS AND EXCLUSIONS
           1.3.4 YEARS CONSIDERED FOR THE STUDY
    1.4 CURRENCY
           TABLE 1 UNITED STATES DOLLAR EXCHANGE RATE, 2017–2019
    1.5 STAKEHOLDERS
    1.6 SUMMARY OF CHANGES

2 RESEARCH METHODOLOGY (Page No. - 31)
    2.1 RESEARCH APPROACH
           FIGURE 3 STUDENT INFORMATION SYSTEM MARKET: RESEARCH DESIGN
           2.1.1 SECONDARY DATA
                    2.1.1.1 Secondary sources
           2.1.2 PRIMARY DATA
                    TABLE 2 LIST OF KEY PRIMARY INTERVIEW PARTICIPANTS
                    2.1.2.1 Breakup of primary profiles
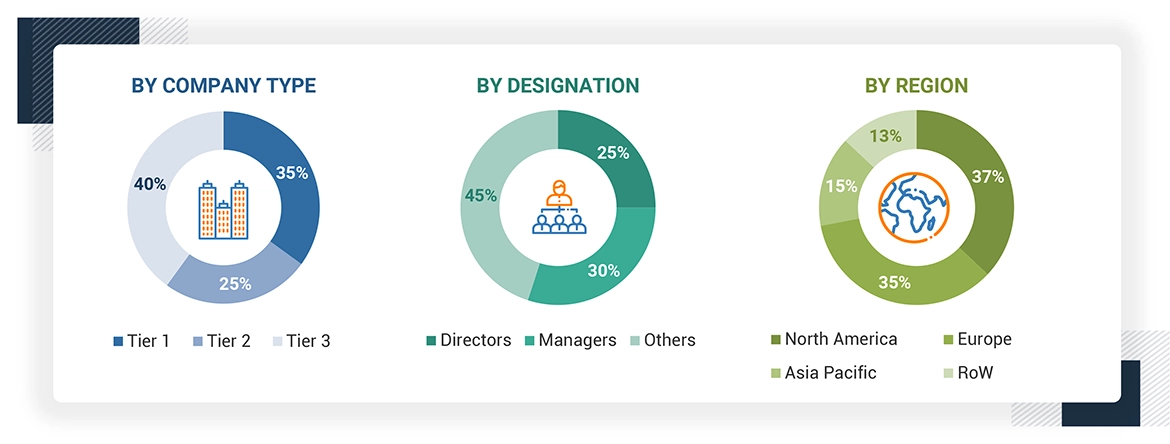
                               FIGURE 4 BREAKUP OF PRIMARY INTERVIEWS: BY COMPANY TYPE, DESIGNATION, AND REGION
                    2.1.2.2 Key industry insights
    2.2 DATA TRIANGULATION
           FIGURE 5 DATA TRIANGULATION
    2.3 MARKET SIZE ESTIMATION
           FIGURE 6 STUDENT INFORMATION SYSTEM MARKET: TOP-DOWN AND BOTTOM-UP APPROACHES
           FIGURE 7 MARKET SIZE ESTIMATION METHODOLOGY – APPROACH 1 (SUPPLY SIDE): REVENUE OF SERVICES FROM VENDORS
           FIGURE 8 MARKET SIZE ESTIMATION METHODOLOGY: BOTTOM-UP APPROACH FROM THE SUPPLY SIDE: COLLECTIVE REVENUE OF VENDORS
           FIGURE 9 MARKET SIZE ESTIMATION METHODOLOGY: CAGR PROJECTIONS FROM SUPPLY SIDE
           FIGURE 10 MARKET SIZE ESTIMATION METHODOLOGY - APPROACH 2 (BOTTOM-UP): REVENUE GENERATED BY VENDORS FROM EACH APPLICATION
           FIGURE 11 MARKET SIZE ESTIMATION METHODOLOGY - APPROACH 2 FROM THE DEMAND SIDE: REVENUE GENERATED FROM DIFFERENT VERTICALS (2/2)
    2.4 MARKET FORECAST
           TABLE 3 FACTOR ANALYSIS
    2.5 RESEARCH ASSUMPTIONS
    2.6 LIMITATIONS OF THE STUDY

3 EXECUTIVE SUMMARY (Page No. - 45)
    FIGURE 12 STUDENT INFORMATION SYSTEM MARKET, 2019–2027 (USD MILLION)
    FIGURE 13 FASTEST-GROWING SEGMENTS IN THE MARKET, 2022–2027
    FIGURE 14 SOLUTIONS TO BE THE LARGER SEGMENT DURING THE FORECAST PERIOD
    FIGURE 15 ENROLLMENT TO BE THE LARGEST SOLUTION MARKET DURING THE FORECAST PERIOD
    FIGURE 16 DEPLOYMENT & INTEGRATION SUBSEGMENT TO BE THE LARGEST PROFESSIONAL SERVICES MARKET DURING THE FORECAST PERIOD
    FIGURE 17 ON-PREMISES DEPLOYMENT SEGMENT TO BE A LARGER MARKET SIZE DURING THE FORECAST PERIOD
    FIGURE 18 TOP END USERS IN THE MARKET, 2020–2027
    FIGURE 19 MARKET: REGIONAL SNAPSHOT

4 PREMIUM INSIGHTS (Page No. - 51)
    4.1 OVERVIEW OF THE STUDENT INFORMATION SYSTEM MARKET
           FIGURE 20 NEED TO STREAMLINE ADMINISTRATION PROCESSES TO DRIVE MARKET GROWTH
    4.2 MARKET, BY COMPONENT
           FIGURE 21 SOLUTIONS TO ACCOUNT FOR A LARGER MARKET SHARE DURING THE FORECAST PERIOD
    4.3 STUDENT INFORMATION SOLUTIONS MARKET, BY TYPE
           FIGURE 22 ENROLLMENT SOLUTIONS TO ACCOUNT FOR THE LARGEST MARKET SHARE DURING THE FORECAST PERIOD
    4.4 STUDENT INFORMATION PROFESSIONAL SERVICES MARKET, BY TYPE
           FIGURE 23 DEPLOYMENT & INTEGRATION SERVICES TO ACCOUNT FOR THE LARGEST MARKET SHARE DURING THE FORECAST PERIOD
    4.5 MARKET, BY DEPLOYMENT MODE
           FIGURE 24 ON-PREMISE DEPLOYMENT MODE TO ACCOUNT FOR A LARGER SHARE DURING THE FORECAST PERIOD
    4.6 MARKET, BY END USER
           FIGURE 25 HIGHER EDUCATION STAKEHOLDERS TO BE THE LARGER END USERS DURING THE FORECAST PERIOD
    4.7 MARKET: REGIONAL SCENARIO
           FIGURE 26 ASIA PACIFIC TO EMERGE AS THE BEST MARKET FOR INVESTMENTS IN THE NEXT FIVE YEARS

5 MARKET OVERVIEW AND INDUSTRY TRENDS (Page No. - 55)
    5.1 INTRODUCTION
    5.2 MARKET DYNAMICS
           FIGURE 27 DRIVERS, RESTRAINTS, OPPORTUNITIES, AND CHALLENGES: STUDENT INFORMATION SYSTEM MARKET
           5.2.1 DRIVERS
                    5.2.1.1 Need to streamline administration processes
                    5.2.1.2 Growth in access to higher education
                               FIGURE 28 EVOLUTION OF HIGHER EDUCATION, 2000–2018
                    5.2.1.3 Rise in adoption of cloud-based solutions
                    5.2.1.4 Higher demand for tailored solutions
           5.2.2 RESTRAINTS
                    5.2.2.1 Lack of appropriate infrastructure in developing and underdeveloped economies
                               FIGURE 29 STATE OF MOBILE INTERNET CONNECTIVITY, BY REGION, 2020
                    5.2.2.2 Risk of data loss and security breaches
           5.2.3 OPPORTUNITIES
                    5.2.3.1 Emergence of potential markets in the academic sector
                    5.2.3.2 Advancements in eLearning technologies
                    5.2.3.3 Wide-scale adoption of online education due to the pandemic
           5.2.4 CHALLENGES
                    5.2.4.1 Need for technical training for teachers and instructors
    5.3 CASE STUDY ANALYSIS
           5.3.1 CASE STUDY 1: UPPER IOWA UNIVERSITY IMPLEMENTED JENZABAR RECRUITMENT SOLUTION TO CENTRALIZE ADMISSIONS, ENROLLMENT, AND OPERATIONS
           5.3.2 CASE STUDY 2: WORKDAY ENABLED POINT LOMA NAZARENE UNIVERSITY TO GAIN INSIGHTS INTO FINANCE, HR, AND STUDENT DATA
           5.3.3 CASE STUDY 3: BULLIS SCHOOL LEVERAGED VERACROSS TO REINVENT CRITICAL ADMISSIONS WORKFLOWS DURING THE PANDEMIC
    5.4 PORTER’S FIVE FORCES ANALYSIS
           TABLE 4 PORTER’S FIVE FORCES ANALYSIS: STUDENT INFORMATION SYSTEM MARKET
           FIGURE 30 PORTER’S FIVE FORCES ANALYSIS: MARKET
           5.4.1 THREAT OF NEW ENTRANTS
           5.4.2 THREAT OF SUBSTITUTES
           5.4.3 BARGAINING POWER OF SUPPLIERS
           5.4.4 BARGAINING POWER OF BUYERS
           5.4.5 COMPETITIVE RIVALRY WITHIN THE INDUSTRY
    5.5 COVID-19-DRIVEN MARKET DYNAMICS
           5.5.1 DRIVERS AND OPPORTUNITIES
           5.5.2 RESTRAINTS AND CHALLENGES
    5.6 TECHNOLOGY ANALYSIS
           5.6.1 ARTIFICIAL INTELLIGENCE AND MACHINE LEARNING
           5.6.2 DATA ANALYTICS
           5.6.3 CLOUD COMPUTING
           5.6.4 INTERNET OF THINGS (IOT)
    5.7 PRICING ANALYSIS
           TABLE 5 STUDENT INFORMATION SYSTEM MARKET: PRICING LEVELS
    5.8 SUPPLY CHAIN ANALYSIS
           FIGURE 31 MARKET: SUPPLY CHAIN
    5.9 ECOSYSTEM
           FIGURE 32 MARKET: ECOSYSTEM
    5.10 TARIFF AND REGULATORY LANDSCAPE
           5.10.1 REGULATORY BODIES, GOVERNMENT AGENCIES, AND OTHER ORGANIZATIONS
                    TABLE 6 NORTH AMERICA: LIST OF REGULATORY BODIES AND REGULATIONS
                    TABLE 7 EUROPE: LIST OF REGULATORY BODIES AND REGULATIONS
                    TABLE 8 ASIA PACIFIC: LIST OF REGULATORY BODIES AND REGULATIONS
                    TABLE 9 MIDDLE EAST & AFRICA: LIST OF REGULATORY BODIES AND REGULATIONS
                    TABLE 10 LATIN AMERICA: LIST OF REGULATORY BODIES AND REGULATIONS
    5.11 PATENT ANALYSIS
                    TABLE 11 MARKET: PATENTS
                    TABLE 12 TOP 10 PATENT OWNERS (US)
                    FIGURE 33 TOP TEN COMPANIES WITH THE HIGHEST NUMBER OF PATENTS
                    FIGURE 34 NUMBER OF PATENTS GRANTED IN A YEAR OVER THE LAST 10 YEARS
    5.12 KEY CONFERENCES & EVENTS
                    TABLE 13 MARKET: DETAILED LIST OF CONFERENCES & EVENTS, 2022–2023
    5.13 TRENDS/DISRUPTIONS IMPACTING BUYERS
                    FIGURE 35 MARKET: TRENDS/DISRUPTIONS IMPACTING BUYERS
    5.14 KEY STAKEHOLDERS & BUYING CRITERIA
           5.14.1 KEY STAKEHOLDERS IN BUYING PROCESS
                    FIGURE 36 INFLUENCE OF STAKEHOLDERS IN BUYING PROCESS FOR END USERS
                    TABLE 14 INFLUENCE OF STAKEHOLDERS IN BUYING PROCESS FOR END USERS
           5.14.2 BUYING CRITERIA
                    FIGURE 37 KEY BUYING CRITERIA FOR END USERS
                    TABLE 15 KEY BUYING CRITERIA FOR END USERS

6 STUDENT INFORMATION SYSTEM MARKET, BY COMPONENT (Page No. - 82)
    6.1 INTRODUCTION
           6.1.1 COMPONENT: MARKET DRIVERS
           6.1.2 COMPONENT: COVID-19 IMPACT
                    FIGURE 38 PROFESSIONAL SERVICES TO GROW AT A HIGHER CAGR DURING THE FORECAST PERIOD
                    TABLE 16 MARKET, BY COMPONENT, 2018–2021 (USD MILLION)
                    TABLE 17 MARKET, BY COMPONENT,  2022–2027 (USD MILLION)
    6.2 SOLUTIONS
           FIGURE 39 BILLING SOLUTIONS TO GROW AT THE HIGHEST CAGR DURING THE FORECAST PERIOD
           TABLE 18 STUDENT INFORMATION SOLUTIONS MARKET, BY TYPE, 2018–2021 (USD MILLION)
           TABLE 19 STUDENT INFORMATION SOLUTIONS MARKET, BY TYPE, 2022–2027 (USD MILLION)
           TABLE 20 STUDENT INFORMATION SYSTEM MARKET, BY REGION, 2018–2021 (USD MILLION)
           TABLE 21 STUDENT INFORMATION SOLUTIONS MARKET, BY REGION, 2022–2027 (USD MILLION)
           6.2.1 ENROLLMENT
                    6.2.1.1 SIS helps in real-time enrollment status updates to help identify potential barriers
                               TABLE 22 STUDENT ENROLLMENT INFORMATION SYSTEM MARKET, BY REGION, 2018–2021 (USD MILLION)
                               TABLE 23 STUDENT ENROLLMENT INFORMATION SYSTEM MARKET, BY REGION, 2022–2027 (USD MILLION)
           6.2.2 ACADEMICS
                    6.2.2.1 SIS helps teachers administer tests and share grades at ease
                               TABLE 24 STUDENT ACADEMIC INFORMATION SYSTEM MARKET, BY REGION, 2018–2021 (USD MILLION)
                               TABLE 25 STUDENT ACADEMIC INFORMATION SYSTEM MARKET, BY REGION, 2022–2027 (USD MILLION)
           6.2.3 FINANCIAL AID
                    6.2.3.1 SIS helps manage financial aid, scholarships, and grants quickly and efficiently
                               TABLE 26 STUDENT FINANCIAL AID INFORMATION SYSTEM MARKET, BY REGION, 2018–2021 (USD MILLION)
                               TABLE 27 STUDENT FINANCIAL AID INFORMATION SYSTEM MARKET, BY REGION, 2022–2027 (USD MILLION)
           6.2.4 BILLING
                    6.2.4.1 SIS helps in managing student billing—from invoicing and online bill payments to tuition plans and record-keeping
                               TABLE 28 STUDENT BILLING INFORMATION SYSTEM MARKET, BY REGION, 2018–2021 (USD MILLION)
                               TABLE 29 STUDENT BILLING INFORMATION SYSTEM MARKET, BY REGION, 2022–2027 (USD MILLION)
    6.3 PROFESSIONAL SERVICES
           FIGURE 40 TRAINING & CONSULTING SERVICES TO GROW AT THE HIGHEST CAGR DURING THE FORECAST PERIOD
           TABLE 30 STUDENT INFORMATION SYSTEM PROFESSIONAL SERVICES MARKET, BY TYPE, 2018–2021 (USD MILLION)
           TABLE 31 STUDENT INFORMATION PROFESSIONAL SERVICES MARKET, BY TYPE, 2022–2027 (USD MILLION)
           TABLE 32 STUDENT INFORMATION PROFESSIONAL SERVICES MARKET, BY REGION, 2018–2021 (USD MILLION)
           TABLE 33 STUDENT INFORMATION PROFESSIONAL SERVICES MARKET, BY REGION, 2022–2027 (USD MILLION)
           6.3.1 DEPLOYMENT & INTEGRATION
                    6.3.1.1 SIS helps ensure a satisfactory user experience, adhere to IT standards and manage budgetary guidelines
                               TABLE 34 STUDENT INFORMATION DEPLOYMENT & INTEGRATION SERVICES MARKET, BY REGION, 2018–2021 (USD MILLION)
                               TABLE 35 STUDENT INFORMATION DEPLOYMENT & INTEGRATION SERVICES MARKET, BY REGION, 2022–2027 (USD MILLION)
           6.3.2 TRAINING & CONSULTING
                    6.3.2.1 SIS solutions and associated services help educational institutes understand the competencies for training
                               TABLE 36 STUDENT INFORMATION TRAINING & CONSULTING SERVICES MARKET, BY REGION, 2018–2021 (USD MILLION)
                               TABLE 37 STUDENT INFORMATION TRAINING & CONSULTING SERVICES MARKET, BY REGION, 2022–2027 (USD MILLION)
           6.3.3 SUPPORT & MAINTENANCE
                    6.3.3.1 SIS support helps understand market trends, the changing business conditions and deal with service inconveniences
                               TABLE 38 STUDENT INFORMATION SUPPORT & MAINTENACE SERVICES MARKET, BY REGION, 2018–2021 (USD MILLION)
                               TABLE 39 STUDENT INFORMATION SUPPORT & MAINTENACE SERVICES MARKET, BY REGION, 2022–2027 (USD MILLION)

7 STUDENT INFORMATION SYSTEM MARKET, BY DEPLOYMENT MODE (Page No. - 97)
    7.1 INTRODUCTION
           7.1.1 DEPLOYMENT MODE: MARKET DRIVERS
           7.1.2 DEPLOYMENT MODE: COVID-19 IMPACT
                    FIGURE 41 CLOUD DEPLOYMENT TO GROW AT A HIGHER CAGR DURING THE FORECAST PERIOD
                    TABLE 40 STUDENT INFORMATION SYSTEM MARKET, BY DEPLOYMENT MODE, 2018–2021 (USD MILLION)
                    TABLE 41 MARKET, BY DEPLOYMENT MODE, 2022–2027 (USD MILLION)
    7.2 ON-PREMISES
           7.2.1 INSTITUTIONS WITH LARGE BUDGETS DRIVE ON-PREMISE SOFTWARE DEPLOYMENT TO OVERCOME SECURITY CONCERNS OVER SENSITIVE DATA
                    TABLE 42 ON-PREMISE MARKET, BY REGION, 2018–2021 (USD MILLION)
                    TABLE 43 ON-PREMISE MARKET, BY REGION, 2022–2027 (USD MILLION)
    7.3 CLOUD
           7.3.1 COST-EFFECTIVENESS, EASY ACCESS, AND SCALABILITY TO BOOST THE ADOPTION OF CLOUD-BASED SIS SOLUTIONS
                    TABLE 44 CLOUD-BASED MARKET, BY REGION, 2018–2021 (USD MILLION)
                    TABLE 45 CLOUD-BASED MARKET, BY REGION, 2022–2027 (USD MILLION)

8 STUDENT INFORMATION SYSTEM MARKET, BY END USER (Page No. - 103)
    8.1 INTRODUCTION
           8.1.1 END USER: STUDENT INFORMATION SYSTEM MARKET DRIVERS
           8.1.2 END USER: COVID-19 IMPACT
                    FIGURE 42 K-12 END USER SEGMENT TO GROW AT A HIGHER CAGR DURING THE FORECAST PERIOD
                    TABLE 46 MARKET, BY END USER, 2018–2021 (USD MILLION)
                    TABLE 47 MARKET, BY END USER, 2022–2027 (USD MILLION)
    8.2 K-12
           8.2.1 USE OF K-12 STUDENT INFORMATION SYSTEM HELPS ACCESS ALL RELEVANT STUDENT SCHOOLING INFORMATION
                    TABLE 48 MARKET IN K-12 EDUCATION, BY REGION, 2018–2021 (USD MILLION)
                    TABLE 49 MARKET IN K-12 EDUCATION, BY REGION, 2022–2027 (USD MILLION)
    8.3 HIGHER EDUCATION
           8.3.1 NEED TO TRACK INFORMATION REGARDING GRADES, ATTENDANCE RECORDS, AND ADMISSION TO DRIVE SIS IN HIGHER EDUCATION INSTITUTES
                    TABLE 50 MARKET IN HIGHER EDUCATION, BY REGION, 2018–2021 (USD MILLION)
                    TABLE 51 MARKET IN HIGHER EDUCATION, BY REGION, 2022–2027 (USD MILLION)

9 STUDENT INFORMATION SYSTEM MARKET, BY REGION (Page No. - 108)
    9.1 INTRODUCTION
           9.1.1 MARKET: COVID-19 IMPACT
                    FIGURE 43 NORTH AMERICA TO LEAD THE MARKET FROM 2022 TO 2027
                    FIGURE 44 ASIA PACIFIC TO GROW AT THE HIGHEST CAGR DURING THE FORECAST PERIOD
                    TABLE 52 STUDENT INFORMATION SYSTEM MARKET, BY REGION, 2018–2021 (USD MILLION)
                    TABLE 53 MARKET, BY REGION, 2022–2027 (USD MILLION)
    9.2 NORTH AMERICA
           9.2.1 NORTH AMERICA: MARKET DRIVERS
                    FIGURE 45 NORTH AMERICA: MARKET SNAPSHOT
                    TABLE 54 NORTH AMERICA: MARKET, BY COMPONENT, 2018–2021 (USD MILLION)
                    TABLE 55 NORTH AMERICA: MARKET, BY COMPONENT, 2022–2027 (USD MILLION)
                    TABLE 56 NORTH AMERICA: STUDENT INFORMATION SOLUTIONS MARKET, BY TYPE, 2018–2021 (USD MILLION)
                    TABLE 57 NORTH AMERICA: STUDENT INFORMATION SOLUTIONS MARKET, BY TYPE, 2022–2027 (USD MILLION)
                    TABLE 58 NORTH AMERICA: STUDENT INFORMATION PROFESSIONAL SERVICES MARKET, BY TYPE, 2018–2021 (USD MILLION)
                    TABLE 59 NORTH AMERICA: STUDENT INFORMATION PROFESSIONAL SERVICES MARKET, BY TYPE, 2022–2027 (USD MILLION)
                    TABLE 60 NORTH AMERICA: MARKET,  BY DEPLOYMENT MODE, 2018–2021 (USD MILLION)
                    TABLE 61 NORTH AMERICA: MARKET, BY DEPLOYMENT MODE, 2022–2027 (USD MILLION)
                    TABLE 62 NORTH AMERICA: MARKET, BY END USER, 2018–2021 (USD MILLION)
                    TABLE 63 NORTH AMERICA: STUDENT INFORMATION SYSTEM MARKET, BY END USER, 2022–2027 (USD MILLION)
                    TABLE 64 NORTH AMERICA: MARKET, BY COUNTRY, 2018–2021 (USD MILLION)
                    TABLE 65 NORTH AMERICA: MARKET, BY COUNTRY, 2022–2027 (USD MILLION)
           9.2.2 UNITED STATES
                    9.2.2.1 Rise in competitive environment to drive the growth of the market in the United States
                               TABLE 66 UNITED STATES: STUDENT INFORMATION SYSTEM MARKET, BY COMPONENT, 2018–2021 (USD MILLION)
                               TABLE 67 UNITED STATES: MARKET, BY COMPONENT, 2022–2027 (USD MILLION)
                               TABLE 68 UNITED STATES: MARKET, BY DEPLOYMENT MODE, 2018–2021 (USD MILLION)
                               TABLE 69 UNITED STATES: MARKET, BY DEPLOYMENT MODE, 2022–2027 (USD MILLION)
                               TABLE 70 UNITED STATES: MARKET, BY END USER, 2018–2021 (USD MILLION)
                               TABLE 71 UNITED STATES: MARKET, BY END USER, 2022–2027 (USD MILLION)
           9.2.3 CANADA
                    9.2.3.1 Abundant opportunities due to huge presence of educational institutions to increase the adoption of SIS in Canada
                               TABLE 72 CANADA: MARKET, BY COMPONENT, 2018–2021 (USD MILLION)
                               TABLE 73 CANADA: MARKET, BY COMPONENT, 2022–2027 (USD MILLION)
                               TABLE 74 CANADA: MARKET, BY DEPLOYMENT MODE, 2018–2021 (USD MILLION)
                               TABLE 75 CANADA: MARKET, BY DEPLOYMENT MODE, 2022–2027 (USD MILLION)
                               TABLE 76 CANADA: MARKET, BY END USER, 2018–2021 (USD MILLION)
                               TABLE 77 CANADA: MARKET, BY END USER, 2022–2027 (USD MILLION)
    9.3 EUROPE
           9.3.1 EUROPE: STUDENT INFORMATION SYSTEM MARKET DRIVERS
                    TABLE 78 EUROPE: MARKET, BY COMPONENT, 2018–2021 (USD MILLION)
                    TABLE 79 EUROPE: MARKET, BY COMPONENT, 2022–2027 (USD MILLION)
                    TABLE 80 EUROPE: STUDENT INFORMATION SOLUTIONS MARKET, BY TYPE, 2018–2021 (USD MILLION)
                    TABLE 81 EUROPE: STUDENT INFORMATION SOLUTIONS MARKET, BY TYPE,  2022–2027 (USD MILLION)
                    TABLE 82 EUROPE: STUDENT INFORMATION PROFESSIONAL SERVICES MARKET, BY TYPE, 2018–2021 (USD MILLION)
                    TABLE 83 EUROPE: STUDENT INFORMATION PROFESSIONAL SERVICES MARKET, BY TYPE, 2022–2027 (USD MILLION)
                    TABLE 84 EUROPE: MARKET, BY DEPLOYMENT MODE, 2018–2021 (USD MILLION)
                    TABLE 85 EUROPE: STUDENT INFORMATION SYSTEM MARKET, BY DEPLOYMENT MODE, 2022–2027 (USD MILLION)
                    TABLE 86 EUROPE: MARKET, BY END USER, 2018–2021 (USD MILLION)
                    TABLE 87 EUROPE: STUDENT INFORMATION SYSTEM MARKET, BY END USER, 2022–2027 (USD MILLION)
                    TABLE 88 EUROPE: MARKET, BY COUNTRY, 2018–2021 (USD MILLION)
                    TABLE 89 EUROPE: MARKET, BY COUNTRY, 2022–2027 (USD MILLION)
           9.3.2 UNITED KINGDOM
                    9.3.2.1 Increase in investments by educational institutions to drive the adoption of SIS solutions in the UK
                               TABLE 90 UNITED KINGDOM: STUDENT INFORMATION SYSTEM MARKET, BY COMPONENT, 2018–2021 (USD MILLION)
                               TABLE 91 UNITED KINGDOM: MARKET, BY COMPONENT, 2022–2027 (USD MILLION)
                               TABLE 92 UNITED KINGDOM: MARKET, BY DEPLOYMENT MODE, 2018–2021 (USD MILLION)
                               TABLE 93 UNITED KINGDOM: MARKET, BY DEPLOYMENT MODE, 2022–2027 (USD MILLION)
                               TABLE 94 UNITED KINGDOM: MARKET, BY END USER, 2018–2021 (USD MILLION)
                               TABLE 95 UNITED KINGDOM: MARKET, BY END USER, 2022–2027 (USD MILLION)
           9.3.3 GERMANY
                    9.3.3.1 Focus on smaller institutions to provide enhanced student experience to drive the adoption of SIS solutions in Germany
                               TABLE 96 GERMANY: MARKET, BY COMPONENT, 2018–2021 (USD MILLION)
                               TABLE 97 GERMANY: MARKET, BY COMPONENT, 2022–2027 (USD MILLION)
                               TABLE 98 GERMANY: MARKET, BY DEPLOYMENT MODE, 2018–2021 (USD MILLION)
                               TABLE 99 GERMANY: MARKET, BY DEPLOYMENT MODE, 2022–2027 (USD MILLION)
                               TABLE 100 GERMANY: MARKET, BY END USER, 2018–2021 (USD MILLION)
                               TABLE 101 GERMANY: MARKET, BY END USER, 2022–2027 (USD MILLION)
           9.3.4 FRANCE
                    9.3.4.1 Greater need among institutions to improve operational efficiency to drive the growth in France
                               TABLE 102 FRANCE: STUDENT INFORMATION SYSTEM MARKET, BY COMPONENT, 2018–2021 (USD MILLION)
                               TABLE 103 FRANCE: MARKET, BY COMPONENT,  2022–2027 (USD MILLION)
                               TABLE 104 FRANCE: MARKET, BY DEPLOYMENT MODE, 2018–2021 (USD MILLION)
                               TABLE 105 FRANCE: MARKET, BY DEPLOYMENT MODE, 2022–2027 (USD MILLION)
                               TABLE 106 FRANCE: MARKET, BY END USER, 2018–2021 (USD MILLION)
                               TABLE 107 FRANCE: MARKET, BY END USER, 2022–2027 (USD MILLION)
           9.3.5 REST OF EUROPE
                    TABLE 108 REST OF EUROPE: MARKET, BY COMPONENT, 2018–2021 (USD MILLION)
                    TABLE 109 REST OF EUROPE: MARKET, BY COMPONENT, 2022–2027 (USD MILLION)
                    TABLE 110 REST OF EUROPE: MARKET, BY DEPLOYMENT MODE, 2018–2021 (USD MILLION)
                    TABLE 111 REST OF EUROPE: MARKET, BY DEPLOYMENT MODE, 2022–2027 (USD MILLION)
                    TABLE 112 REST OF EUROPE: MARKET, BY END USER, 2018–2021 (USD MILLION)
                    TABLE 113 REST OF EUROPE: MARKET, BY END USER, 2022–2027 (USD MILLION)
    9.4 ASIA PACIFIC
           9.4.1 ASIA PACIFIC: STUDENT INFORMATION SYSTEM MARKET DRIVERS
                    FIGURE 46 ASIA PACIFIC: MARKET SNAPSHOT
                    TABLE 114 ASIA PACIFIC: MARKET, BY COMPONENT, 2018–2021 (USD MILLION)
                    TABLE 115 ASIA PACIFIC: MARKET, BY COMPONENT, 2022–2027 (USD MILLION)
                    TABLE 116 ASIA PACIFIC: STUDENT INFORMATION SOLUTIONS MARKET, BY TYPE, 2018–2021 (USD MILLION)
                    TABLE 117 ASIA PACIFIC: STUDENT INFORMATION SOLUTIONS MARKET, BY TYPE, 2022–2027 (USD MILLION)
                    TABLE 118 ASIA PACIFIC: STUDENT INFORMATION PROFESSIONAL SERVICES MARKET, BY TYPE, 2018–2021 (USD MILLION)
                    TABLE 119 ASIA PACIFIC: STUDENT INFORMATION PROFESSIONAL SERVICES MARKET, BY TYPE, 2022–2027 (USD MILLION)
                    TABLE 120 ASIA PACIFIC: MARKET, BY DEPLOYMENT MODE, 2018–2021 (USD MILLION)
                    TABLE 121 ASIA PACIFIC: STUDENT INFORMATION SYSTEM MARKET, BY DEPLOYMENT MODE, 2022–2027 (USD MILLION)
                    TABLE 122 ASIA PACIFIC: MARKET, BY END USER, 2018–2021 (USD MILLION)
                    TABLE 123 ASIA PACIFIC: STUDENT INFORMATION SYSTEM MARKET, BY END USER, 2022–2027 (USD MILLION)
                    TABLE 124 ASIA PACIFIC: MARKET, BY COUNTRY, 2018–2021 (USD MILLION)
                    TABLE 125 ASIA PACIFIC: MARKET, BY COUNTRY, 2022–2027 (USD MILLION)
           9.4.2 JAPAN
                    9.4.2.1 Higher investment in new technologies across Japan to maintain its position in the global market
                               TABLE 126 JAPAN: MARKET, BY COMPONENT, 2018–2021 (USD MILLION)
                               TABLE 127 JAPAN: MARKET, BY COMPONENT, 2022–2027 (USD MILLION)
                               TABLE 128 JAPAN: MARKET, BY DEPLOYMENT MODE, 2018–2021 (USD MILLION)
                               TABLE 129 JAPAN: MARKET, BY DEPLOYMENT MODE, 2022–2027 (USD MILLION)
                               TABLE 130 JAPAN: MARKET, BY END USER, 2018–2021 (USD MILLION)
                               TABLE 131 JAPAN: MARKET, BY END USER, 2022–2027 (USD MILLION)
           9.4.3 CHINA
                    9.4.3.1 Increase in annual enrollments to drive educational institutions to adopt SIS solutions in China
                               TABLE 132 CHINA: STUDENT INFORMATION SYSTEM MARKET, BY COMPONENT,  2018–2021 (USD MILLION)
                               TABLE 133 CHINA: MARKET, BY COMPONENT, 2022–2027 (USD MILLION)
                               TABLE 134 CHINA: MARKET, BY DEPLOYMENT MODE, 2018–2021 (USD MILLION)
                               TABLE 135 CHINA: MARKET, BY DEPLOYMENT MODE, 2022–2027 (USD MILLION)
                               TABLE 136 CHINA: MARKET, BY END USER, 2018–2021 (USD MILLION)
                               TABLE 137 CHINA: MARKET, BY END USER, 2022–2027 (USD MILLION)
           9.4.4 INDIA
                    9.4.4.1 Focus on education with the required skills set to drive the adoption of SIS solutions in India
                               TABLE 138 INDIA: STUDENT INFORMATION SYSTEM MARKET, BY COMPONENT, 2018–2021 (USD MILLION)
                               TABLE 139 INDIA: MARKET, BY COMPONENT, 2022–2027 (USD MILLION)
                               TABLE 140 INDIA: MARKET, BY DEPLOYMENT MODE, 2018–2021 (USD MILLION)
                               TABLE 141 INDIA: MARKET, BY DEPLOYMENT MODE, 2022–2027 (USD MILLION)
                               TABLE 142 INDIA: MARKET, BY END USER, 2018–2021 (USD MILLION)
                               TABLE 143 INDIA: MARKET, BY END USER, 2022–2027 (USD MILLION)
           9.4.5 AUSTRALIA
                    9.4.5.1 New technological advancements in the education industry to drive the market in Australia
                               TABLE 144 AUSTRALIA: MARKET, BY COMPONENT, 2018–2021 (USD MILLION)
                               TABLE 145 AUSTRALIA: MARKET, BY COMPONENT, 2022–2027 (USD MILLION)
                               TABLE 146 AUSTRALIA: MARKET, BY DEPLOYMENT MODE, 2018–2021 (USD MILLION)
                               TABLE 147 AUSTRALIA: MARKET, BY DEPLOYMENT MODE, 2022–2027 (USD MILLION)
                               TABLE 148 AUSTRALIA: MARKET, BY END USER, 2018–2021 (USD MILLION)
                               TABLE 149 AUSTRALIA: MARKET, BY END USER, 2022–2027 (USD MILLION)
           9.4.6 REST OF ASIA PACIFIC
                    TABLE 150 REST OF ASIA PACIFIC: STUDENT INFORMATION SYSTEM MARKET, BY COMPONENT, 2018–2021 (USD MILLION)
                    TABLE 151 REST OF ASIA PACIFIC: MARKET, BY COMPONENT, 2022–2027 (USD MILLION)
                    TABLE 152 REST OF ASIA PACIFIC: MARKET, BY DEPLOYMENT MODE, 2018–2021 (USD MILLION)
                    TABLE 153 REST OF ASIA PACIFIC: MARKET, BY DEPLOYMENT MODE, 2022–2027 (USD MILLION)
                    TABLE 154 REST OF ASIA PACIFIC: MARKET, BY END USER, 2018–2021 (USD MILLION)
                    TABLE 155 REST OF ASIA PACIFIC: MARKET, BY END USER, 2022–2027 (USD MILLION)
    9.5 MIDDLE EAST & AFRICA
           9.5.1 MIDDLE EAST & AFRICA: STUDENT INFORMATION SYSTEM MARKET DRIVERS
                    TABLE 156 MIDDLE EAST & AFRICA: MARKET, BY COMPONENT, 2018–2021 (USD MILLION)
                    TABLE 157 MIDDLE EAST & AFRICA: MARKET, BY COMPONENT, 2022–2027 (USD MILLION)
                    TABLE 158 MIDDLE EAST & AFRICA: STUDENT INFORMATION SOLUTIONS MARKET, BY TYPE, 2018–2021 (USD MILLION)
                    TABLE 159 MIDDLE EAST & AFRICA: STUDENT INFORMATION SOLUTIONS MARKET, BY TYPE, 2022–2027 (USD MILLION)
                    TABLE 160 MIDDLE EAST & AFRICA: STUDENT INFORMATION PROFESSIONAL SERVICES MARKET, BY TYPE, 2018–2021 (USD MILLION)
                    TABLE 161 MIDDLE EAST & AFRICA: STUDENT INFORMATION PROFESSIONAL SERVICES MARKET, BY TYPE, 2022–2027 (USD MILLION)
                    TABLE 162 MIDDLE EAST & AFRICA: MARKET, BY DEPLOYMENT MODE, 2018–2021 (USD MILLION)
                    TABLE 163 MIDDLE EAST & AFRICA: MARKET, BY DEPLOYMENT MODE, 2022–2027 (USD MILLION)
                    TABLE 164 MIDDLE EAST & AFRICA: MARKET, BY END USER, 2018–2021 (USD MILLION)
                    TABLE 165 MIDDLE EAST & AFRICA: MARKET, BY END USER, 2022–2027 (USD MILLION)
                    TABLE 166 MIDDLE EAST & AFRICA: MARKET, BY COUNTRY, 2018–2021 (USD MILLION)
                    TABLE 167 MIDDLE EAST & AFRICA: MARKET, BY COUNTRY, 2022–2027 (USD MILLION)
           9.5.2 KINGDOM OF SAUDI ARABIA
                    9.5.2.1 Rapid adoption of cloud-based SIS solutions to drive the demand for SIS in the KSA
                               TABLE 168 KINGDOM OF SAUDI ARABIA: STUDENT INFORMATION SYSTEM MARKET, BY COMPONENT, 2018–2021 (USD MILLION)
                               TABLE 169 KINGDOM OF SAUDI ARABIA: MARKET,  BY COMPONENT, 2022–2027 (USD MILLION)
                               TABLE 170 KINGDOM OF SAUDI ARABIA: MARKET, BY DEPLOYMENT MODE, 2018–2021 (USD MILLION)
                               TABLE 171 KINGDOM OF SAUDI ARABIA: MARKET, BY DEPLOYMENT MODE, 2022–2027 (USD MILLION)
                               TABLE 172 KINGDOM OF SAUDI ARABIA: MARKET, BY END USER, 2018–2021 (USD MILLION)
                               TABLE 173 KINGDOM OF SAUDI ARABIA: MARKET, BY END USER, 2022–2027 (USD MILLION)
           9.5.3 UNITED ARAB EMIRATES
                    9.5.3.1 Government initiatives to enhance education sector across UAE to drive the adoption of SIS solutions
                               TABLE 174 UNITED ARAB EMIRATES: STUDENT INFORMATION SYSTEM MARKET, BY COMPONENT, 2018–2021 (USD MILLION)
                               TABLE 175 UNITED ARAB EMIRATES: MARKET, BY COMPONENT, 2022–2027 (USD MILLION)
                               TABLE 176 UNITED ARAB EMIRATES: MARKET, BY DEPLOYMENT MODE, 2018–2021 (USD MILLION)
                               TABLE 177 UNITED ARAB EMIRATES: MARKET, BY DEPLOYMENT MODE, 2022–2027 (USD MILLION)
                               TABLE 178 UNITED ARAB EMIRATES: MARKET,  BY END USER, 2018–2021 (USD MILLION)
                               TABLE 179 UNITED ARAB EMIRATES: MARKET, BY END USER, 2022–2027 (USD MILLION)
           9.5.4 REST OF THE MIDDLE EAST & AFRICA
                    TABLE 180 REST OF THE MIDDLE EAST & AFRICA: MARKET, BY COMPONENT, 2018–2021 (USD MILLION)
                    TABLE 181 REST OF THE MIDDLE EAST & AFRICA: MARKET, BY COMPONENT, 2022–2027 (USD MILLION)
                    TABLE 182 REST OF THE MIDDLE EAST & AFRICA: MARKET, BY DEPLOYMENT MODE, 2018–2021 (USD MILLION)
                    TABLE 183 REST OF THE MIDDLE EAST & AFRICA: MARKET, BY DEPLOYMENT MODE, 2022–2027 (USD MILLION)
                    TABLE 184 REST OF THE MIDDLE EAST & AFRICA: MARKET, BY END USER, 2018–2021 (USD MILLION)
                    TABLE 185 REST OF THE MIDDLE EAST & AFRICA: MARKET, BY END USER, 2022–2027 (USD MILLION)
    9.6 LATIN AMERICA
           9.6.1 LATIN AMERICA: STUDENT INFORMATION SYSTEM MARKET DRIVERS
                    TABLE 186 LATIN AMERICA: MARKET, BY COMPONENT, 2018–2021 (USD MILLION)
                    TABLE 187 LATIN AMERICA: MARKET, BY COMPONENT, 2022–2027 (USD MILLION)
                    TABLE 188 LATIN AMERICA: STUDENT INFORMATION SOLUTIONS MARKET, BY TYPE, 2018–2021 (USD MILLION)
                    TABLE 189 LATIN AMERICA: STUDENT INFORMATION SOLUTIONS MARKET, BY TYPE, 2022–2027 (USD MILLION)
                    TABLE 190 LATIN AMERICA: STUDENT INFORMATION PROFESSIONAL SERVICES MARKET, BY TYPE, 2018–2021 (USD MILLION)
                    TABLE 191 LATIN AMERICA: STUDENT INFORMATION PROFESSIONAL SERVICES MARKET, BY TYPE, 2022–2027 (USD MILLION)
                    TABLE 192 LATIN AMERICA: MARKET, BY DEPLOYMENT MODE, 2018–2021 (USD MILLION)
                    TABLE 193 LATIN AMERICA: MARKET, BY DEPLOYMENT MODE, 2022–2027 (USD MILLION)
                    TABLE 194 LATIN AMERICA: MARKET, BY END USER, 2018–2021 (USD MILLION)
                    TABLE 195 LATIN AMERICA: STUDENT INFORMATION SYSTEM MARKET, BY END USER, 2022–2027 (USD MILLION)
                    TABLE 196 LATIN AMERICA: MARKET, BY COUNTRY, 2018–2021 (USD MILLION)
                    TABLE 197 LATIN AMERICA: MARKET, BY COUNTRY, 2022–2027 (USD MILLION)
           9.6.2 BRAZIL
                    9.6.2.1 Huge investments in promoting enhanced student experience to drive the adoption of SIS solutions in Brazil
                               TABLE 198 BRAZIL: STUDENT INFORMATION SYSTEM MARKET, BY COMPONENT, 2018–2021 (USD MILLION)
                               TABLE 199 BRAZIL: MARKET, BY COMPONENT, 2022–2027 (USD MILLION)
                               TABLE 200 BRAZIL: MARKET, BY DEPLOYMENT MODE, 2018–2021 (USD MILLION)
                               TABLE 201 BRAZIL: MARKET, BY DEPLOYMENT MODE, 2022–2027 (USD MILLION)
                               TABLE 202 BRAZIL: MARKET, BY END USER, 2018–2021 (USD MILLION)
                               TABLE 203 BRAZIL: MARKET, BY END USER, 2022–2027 (USD MILLION)
           9.6.3 MEXICO
                    9.6.3.1 Growing need to gain real-time visibility into key student management operations regarding academics, enrollment, billing, and financial aid to drive the adoption of SIS solutions in Mexico
                               TABLE 204 MEXICO: STUDENT INFORMATION SYSTEM MARKET, BY COMPONENT, 2018–2021 (USD MILLION)
                               TABLE 205 MEXICO: MARKET, BY COMPONENT, 2022–2027 (USD MILLION)
                               TABLE 206 MEXICO: MARKET, BY DEPLOYMENT MODE, 2018–2021 (USD MILLION)
                               TABLE 207 MEXICO: MARKET, BY DEPLOYMENT MODE, 2022–2027 (USD MILLION)
                               TABLE 208 MEXICO: MARKET, BY END USER, 2018–2021 (USD MILLION)
                               TABLE 209 MEXICO: MARKET, BY END USER, 2022–2027 (USD MILLION)
           9.6.4 REST OF LATIN AMERICA
                    TABLE 210 REST OF LATIN AMERICA: STUDENT INFORMATION SYSTEM MARKET, BY COMPONENT, 2018–2021 (USD MILLION)
                    TABLE 211 REST OF LATIN AMERICA: MARKET, BY COMPONENT, 2022–2027 (USD MILLION)
                    TABLE 212 REST OF LATIN AMERICA: MARKET, BY DEPLOYMENT MODE, 2018–2021 (USD MILLION)
                    TABLE 213 REST OF LATIN AMERICA: MARKET, BY DEPLOYMENT MODE, 2022–2027 (USD MILLION)
                    TABLE 214 REST OF LATIN AMERICA: MARKET, BY END USER, 2018–2021 (USD MILLION)
                    TABLE 215 REST OF LATIN AMERICA: MARKET, BY END USER, 2022–2027 (USD MILLION)

10 COMPETITIVE LANDSCAPE (Page No. - 167)
     10.1 OVERVIEW
     10.2 MARKET EVALUATION FRAMEWORK
               FIGURE 47 MARKET EVALUATION FRAMEWORK, 2019–2021
     10.3 KEY PLAYER STRATEGIES/RIGHT TO WIN
               TABLE 216 OVERVIEW OF STRATEGIES ADOPTED BY KEY STUDENT INFORMATION SYSTEM VENDORS
     10.4 REVENUE ANALYSIS
               FIGURE 48 HISTORICAL THREE-YEAR REVENUE ANALYSIS OF LEADING PLAYERS, 2019–2021 (USD BILLION)
     10.5 MARKET SHARE ANALYSIS
               FIGURE 49 STUDENT INFORMATION SYSTEM MARKET: MARKET SHARE ANALYSIS, 2021
               TABLE 217 MARKET: DEGREE OF COMPETITION
     10.6 COMPANY EVALUATION QUADRANT
               TABLE 218 COMPANY EVALUATION QUADRANT: CRITERIA
             10.6.1 STARS
             10.6.2 EMERGING LEADERS
             10.6.3 PERVASIVE PLAYERS
             10.6.4 PARTICIPANTS
                       FIGURE 50 MARKET, KEY COMPANY EVALUATION MATRIX, 2021
             10.6.5 COMPANY PRODUCT FOOTPRINT ANALYSIS
                       TABLE 219 COMPANY PRODUCT FOOTPRINT
                       TABLE 220 COMPANY APPLICATION FOOTPRINT
                       TABLE 221 COMPANY INDUSTRY FOOTPRINT
                       TABLE 222 COMPANY REGION FOOTPRINT
     10.7 RANKING OF KEY PLAYERS
               FIGURE 51 RANKING OF KEY PLAYERS IN THE STUDENT INFORMATION SYSTEM MARKET, 2021
     10.8 STARTUP/SME EVALUATION MATRIX
               FIGURE 52 STARTUP/SME EVALUATION MATRIX: CRITERIA WEIGHTAGE
             10.8.1 PROGRESSIVE COMPANIES
             10.8.2 RESPONSIVE COMPANIES
             10.8.3 DYNAMIC COMPANIES
             10.8.4 STARTING BLOCKS
                       FIGURE 53 MARKET, STARTUP/SME COMPANY EVALUATION MATRIX, 2021
             10.8.5 COMPETITIVE BENCHMARKING
                       TABLE 223 MARKET: DETAILED LIST OF KEY STARTUP/SMES
                       TABLE 224 MARKET: COMPETITIVE BENCHMARKING OF KEY PLAYERS (STARTUPS/SMES)
     10.9 KEY MARKET DEVELOPMENTS
             10.9.1 PRODUCT LAUNCHES & ENHANCEMENTS
                       TABLE 225 PRODUCT LAUNCHES & ENHANCEMENTS, 2019–2022
             10.9.2 DEALS
                       TABLE 226 DEALS, 2019–2022

11 COMPANY PROFILES (Page No. - 191)
     11.1 MAJOR PLAYERS
(Business Overview, Products, Solutions & Services, Key Insights, Recent Developments, MnM View)*
             11.1.1 ORACLE
                       TABLE 227 ORACLE: BUSINESS OVERVIEW
                       FIGURE 54 ORACLE: COMPANY SNAPSHOT
                       TABLE 228 ORACLE: PRODUCTS/SOLUTIONS/SERVICES OFFERED
                       TABLE 229 ORACLE: STUDENT INFORMATION SYSTEM MARKET: NEW LAUNCHES
                       TABLE 230 ORACLE: MARKET: DEALS
             11.1.2 WORKDAY
                       TABLE 231 WORKDAY: BUSINESS OVERVIEW
                       FIGURE 55 WORKDAY: COMPANY SNAPSHOT
                       TABLE 232 WORKDAY: PRODUCTS/SOLUTIONS/SERVICES OFFERED
                       TABLE 233 WORKDAY: MARKET: NEW LAUNCHES
                       TABLE 234 WORKDAY: MARKET: DEALS
             11.1.3 ELLUCIAN
                       TABLE 235 ELLUCIAN: BUSINESS OVERVIEW
                       TABLE 236 ELLUCIAN: PRODUCTS/SOLUTIONS/SERVICES OFFERED
                       TABLE 237 ELLUCIAN: MARKET: NEW LAUNCHES
                       TABLE 238 ELLUCIAN: MARKET: DEALS
             11.1.4 POWERSCHOOL
                       TABLE 239 POWERSCHOOL: BUSINESS OVERVIEW
                       FIGURE 56 POWERSCHOOL: COMPANY SNAPSHOT
                       TABLE 240 POWERSCHOOL: PRODUCTS/SOLUTIONS/SERVICES OFFERED
                       TABLE 241 POWERSCHOOL: STUDENT INFORMATION SYSTEM MARKET: NEW LAUNCHES
                       TABLE 242 POWERSCHOOL: MARKET: DEALS
             11.1.5 JENZABAR
                       TABLE 243 JENZABAR: BUSINESS OVERVIEW
                       TABLE 244 JENZABAR: PRODUCT/SOLUTIONS/SERVICES OFFERED
                       TABLE 245 JENZABAR: MARKET: NEW LAUNCHES
                       TABLE 246 JENZABAR: MARKET: DEALS
             11.1.6 SKYWARD
                       TABLE 247 SKYWARD: BUSINESS OVERVIEW
                       TABLE 248 SKYWARD: PRODUCT/SOLUTIONS/SERVICES OFFERED
                       TABLE 249 SKYWARD: MARKET: NEW LAUNCHES
                       TABLE 250 SKYWARD: MARKET: DEALS
             11.1.7 TRIBAL GROUP
                       TABLE 251 TRIBAL GROUP: BUSINESS OVERVIEW
                       FIGURE 57 TRIBAL GROUP: COMPANY SNAPSHOT
                       TABLE 252 TRIBAL GROUP: PRODUCT/SOLUTIONS/SERVICES OFFERED
                       TABLE 253 TRIBAL GROUP: STUDENT INFORMATION SYSTEM MARKET: NEW LAUNCHES
                       TABLE 254 TRIBAL GROUP: MARKET: DEALS
             11.1.8 ILLUMINATE EDUCATION
                       TABLE 255 ILLUMINATE EDUCATION: BUSINESS OVERVIEW
                       TABLE 256 ILLUMINATE EDUCATION: PRODUCT/SOLUTIONS/SERVICES OFFERED
                       TABLE 257 ILLUMINATE EDUCATION: MARKET: NEW LAUNCHES
                       TABLE 258 ILLUMINATE EDUCATION: MARKET: DEALS
             11.1.9 ARTH INFOSOFT
                       TABLE 259 ARTH INFOSOFT: BUSINESS OVERVIEW
                       TABLE 260 ARTH INFOSOFT: PRODUCT/SOLUTIONS/SERVICES OFFERED
             11.1.10 FOCUS SCHOOL SOFTWARE
                       TABLE 261 FOCUS SCHOOL SOFTWARE: BUSINESS OVERVIEW
                       TABLE 262 FOCUS SCHOOL SOFTWARE: PRODUCT/SOLUTIONS/SERVICES OFFERED
                       TABLE 263 FOCUS SCHOOL SOFTWARE: STUDENT INFORMATION SYSTEM MARKET: DEALS
*Details on Business Overview, Products, Solutions & Services, Key Insights, Recent Developments, MnM View might not be captured in case of unlisted companies.
     11.2 OTHER VENDORS
             11.2.1 SAP
             11.2.2 FORADIAN TECHNOLOGIES
             11.2.3 COMSPEC INTERNATIONAL
             11.2.4 BEEHIVELY
             11.2.5 FOLLETT
             11.2.6 FACTS
             11.2.7 REDIKER SOFTWARE
             11.2.8 VERACROSS
             11.2.9 QUICKSCHOOLS
             11.2.10 GRADELINK
     11.3 SME/STARTUPS
             11.3.1 THESIS
             11.3.2 ANTHOLOGY
             11.3.3 ALMA
             11.3.4 MYCLASSCAMPUS
             11.3.5 DREAMCLASS
             11.3.6 MYSCHOOL
             11.3.7 IGRADEPLUS
             11.3.8 SMARTCLASS
             11.3.9 BLUEBIC
             11.3.10 BIGSIS

12 ADJACENT MARKETS (Page No. - 238)
     12.1 INTRODUCTION TO ADJACENT MARKETS
               TABLE 264 ADJACENT MARKETS AND FORECASTS
     12.2 LIMITATIONS
     12.3 STUDENT INFORMATION SYSTEM MARKET ECOSYSTEM AND ADJACENT MARKETS
     12.4 LEARNING MANAGEMENT SYSTEM MARKET
             12.4.1 LEARNING MANAGEMENT SYSTEM MARKET, BY COMPONENT
                       TABLE 265 LEARNING MANAGEMENT SYSTEM MARKET SIZE, BY COMPONENT, 2015–2020 (USD MILLION)
                       TABLE 266 LEARNING MANAGEMENT SYSTEM MARKET SIZE, BY COMPONENT, 2021–2026 (USD MILLION)
             12.4.2 LEARNING MANAGEMENT SYSTEM MARKET, BY DELIVERY MODE
                       TABLE 267 LEARNING MANAGEMENT SYSTEM MARKET, BY DELIVERY MODE, 2015–2020 (USD MILLION)
                       TABLE 268 LEARNING MANAGEMENT SYSTEM MARKET, BY DELIVERY MODE,  2021–2026 (USD MILLION)
             12.4.3 LEARNING MANAGEMENT SYSTEM MARKET, BY USER TYPE
                       TABLE 269 LEARNING MANAGEMENT SYSTEM MARKET, BY USER TYPE, 2015–2020 (USD MILLION)
                       TABLE 270 LEARNING MANAGEMENT SYSTEM MARKET, BY USER TYPE, 2021–2026 (USD MILLION)
             12.4.4 LEARNING MANAGEMENT SYSTEM MARKET, BY DEPLOYMENT TYPE
                       TABLE 271 LEARNING MANAGEMENT SYSTEM MARKET, BY DEPLOYMENT TYPE, 2015–2020 (USD MILLION)
                       TABLE 272 LEARNING MANAGEMENT SYSTEM MARKET, BY DEPLOYMENT TYPE, 2021–2026 (USD MILLION)
             12.4.5 LEARNING MANAGEMENT SYSTEM MARKET, BY REGION
                       TABLE 273 LEARNING MANAGEMENT SYSTEM MARKET, BY REGION, 2015–2020 (USD MILLION)
                       TABLE 274 LEARNING MANAGEMENT SYSTEM MARKET, BY REGION, 2021–2026 (USD MILLION)
     12.5 EDUCATION ERP MARKET
             12.5.1 EDUCATION ERP MARKET, BY COMPONENT
                       TABLE 275 EDUCATION ERP MARKET SIZE, BY COMPONENT, 2017–2020 (USD MILLION)
                       TABLE 276 EDUCATION ERP MARKET SIZE, BY COMPONENT, 2021–2026 (USD MILLION)
             12.5.2 EDUCATION ERP MARKET, BY APPLICATION
                       TABLE 277 EDUCATION ERP MARKET SIZE, BY APPLICATION, 2017–2020 (USD MILLION)
                       TABLE 278 EDUCATION ERP MARKET SIZE, BY APPLICATION, 2021–2026 (USD MILLION)
             12.5.3 EDUCATION ERP MARKET, BY DEPLOYMENT TYPE
                       TABLE 279 EDUCATION ERP MARKET SIZE, BY DEPLOYMENT TYPE, 2017–2020 (USD MILLION)
                       TABLE 280 EDUCATION ERP MARKET SIZE, BY DEPLOYMENT TYPE, 2021–2026 (USD MILLION)
             12.5.4 EDUCATION ERP MARKET, BY END USER
                       TABLE 281 EDUCATION ERP MARKET SIZE, BY END USER, 2017–2020 (USD MILLION)
                       TABLE 282 EDUCATION ERP MARKET SIZE, BY END USER, 2021–2026 (USD MILLION)
             12.5.5 EDUCATION ERP MARKET, BY REGION

13 APPENDIX (Page No. - 247)
     13.1 DISCUSSION GUIDE
     13.2 KNOWLEDGE STORE: MARKETSANDMARKETS’ SUBSCRIPTION PORTAL
     13.3 AVAILABLE CUSTOMIZATIONS
     13.4 RELATED REPORTS
     13.5 AUTHOR DETAILS

The study involves four major activities in estimating the current size of the Student information system market. Exhaustive secondary research was done to collect information on the market, peer market, and parent market. The next step was to validate these findings, assumptions, and sizing with industry experts across the value chain using primary research. Both top-down and bottom-up approaches were employed to estimate the total market size. After that, the market breakdown and data triangulation procedures were used to estimate the market size of the segments and sub segments of the Student Information System market.

Secondary Research

The market size of the companies offering student information system solutions and services was arrived at based on the secondary data. Various secondary sources were used to identify and collect the information required for the study. These include corporate filings such as annual reports, investor presentations, and financial statements; trade data, press releases, white papers, journals, certified publications, articles by recognized authors, websites, directories, and databases. This secondary data was collected to arrive at the overall market size and was further validated by primary research.

Primary Research

In the primary research process, various primary sources from both supply and demand sides were interviewed to obtain qualitative and quantitative information on the market. The primary sources from the supply side included various industry experts, such as chief experience officers (CXOs), vice presidents (VPs), directors from business development, marketing, and product development/innovation teams, and related key executives from student information system vendors, managed student information system providers, industry associations, independent consultants, and key opinion leaders.

Primary interviews have been conducted to gather insights, such as market statistics, latest trends disrupting the market, new use cases implemented, data of revenue collected from the products and services, market breakups, market size estimations, market forecasting, and data triangulation. Primary research also helped understand various trends related to the technology, application, deployment model, and region. Stakeholders from the demand side, such as Chief Information Officers (CIOs), Chief Technology Officers (CTOs), and Chief Security Officers (CSOs), and installation teams, of governments/end users using student information system solutions, project teams were interviewed to understand the buyer’s perspective on the suppliers, products, service providers, and their current use of solutions, which would affect the overall student information system market.

Student Information System  Market Size, and Share

To know about the assumptions considered for the study, download the pdf brochure

Market Size Estimation

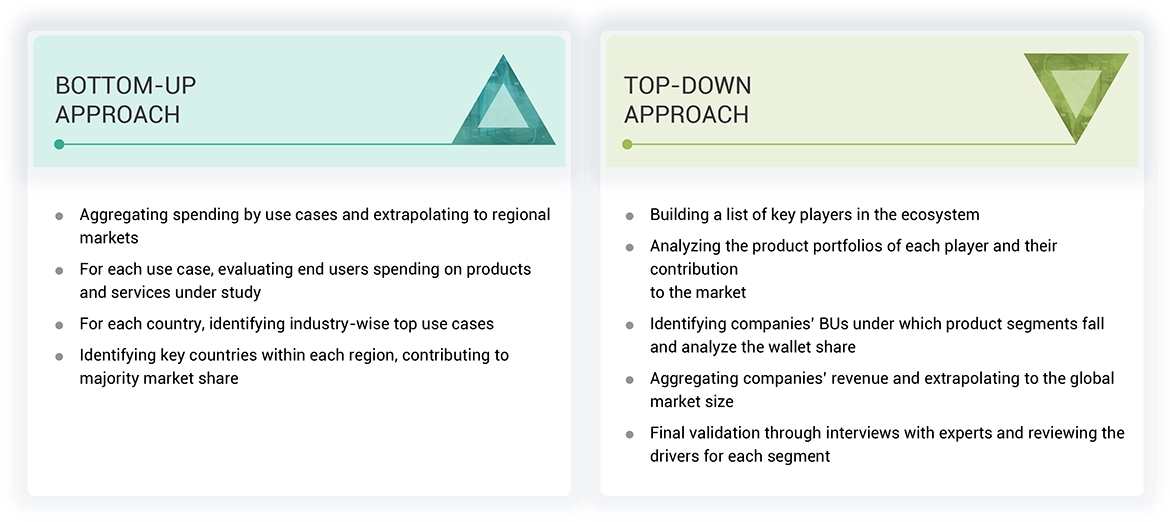
Top-down and bottom-up approaches were used to estimate and validate the size of the student information system market and various other dependent subsegments. The research methodology used to estimate the market size included the following details: the key players in the market were identified through secondary research, and their revenue contributions in the respective countries were determined through primary and secondary research. This entire procedure included the study of the annual and financial reports of top market players and extensive interviews for key insights from industry leaders, such as Chief Executive Officers (CEOs), VPs, directors, and marketing executives. All percentage splits and breakups were determined using secondary sources and verified through primary sources.

In the top-down approach, an exhaustive list of all vendors offering solutions and services in the student information system market was prepared. The revenue contribution of all vendors in the market was estimated through annual reports, press releases, funding, investor presentations, paid databases, and primary interviews. Both types of vendors that offer student information systems as a standalone solution, as well as an integrated solution in student information system offerings, were considered for the evaluation of the market size. Each vendor was evaluated based on its product/solution offerings, services, functions, deployment modes, organization sizes, and verticals. The aggregate of all companies’ revenue was extrapolated to reach the overall market size. Each subsegment was studied and analyzed for its market size and regional penetration. The markets were triangulated through both primary and secondary research. The primary procedure included extensive interviews for key insights from industry leaders, such as CEOs, VPs, directors, and marketing executives. These market numbers were further triangulated with the existing MarketsandMarkets repository for validation.

In the bottom-up approach, the adoption trend of student information system solutions and services among different verticals in key countries with respect to the regions that contribute to most of the market share was identified. For cross-validation, the adoption trend of solutions, along with different use cases, with respect to their business segments, has been identified and extrapolated. Weightage has been given to use cases identified in the different application areas for the calculation.

Data Triangulation

After arriving at the overall market size using the market size estimation processes as explained above, the market was split into several segments and subsegments. The data triangulation and market breakup procedures were employed, wherever applicable, to complete the overall market engineering process and arrive at the exact statistics of each market segment and subsegment. The data was triangulated by studying various factors and trends from both the demand and supply sides.

Report Objectives

  • To define, describe, segment, and forecast the size of the student information system market by component (solutions and professional services), deployment mode, end user, and region in terms of value
  • To forecast the market size for various segments with respect to five main regions, namely, North America, Europe, Asia Pacific, the Middle East & Africa, and Latin America, in terms of value
  • To provide detailed information regarding the drivers, restraints, opportunities, and challenges influencing the growth of the market
  • To study the complete value chain and related industry segments and perform a value chain analysis of the market landscape
  • To strategically analyze macro and micromarkets1 with respect to growth trends, prospects, and their contributions to the overall market
  • To analyze industry trends, patents & innovations, and pricing data related to the market
  • To analyze opportunities for stakeholders and provide a detailed competitive landscape of the market
  • To profile key players in the market and comprehensively analyze their market share/ranking and core competencies2
  • To analyze competitive developments such as product launches/developments, partnerships, collaborations, and acquisitions carried out by players in the student information system market
  • To track and analyze competitive developments, such as mergers and acquisitions, new product developments, and partnerships and collaborations, in the market.

1. Micromarkets are defined as the further segments and subsegments of the student information system market included in the report.
2. Core competencies of the companies are captured in terms of their key developments and key strategies adopted by them to sustain their position in the market.

COVID-19 Impact

COVID-19 has impacted the student information system market globally across various verticals. The major impacts include:

  • With the recent outbreak of COVID-19, businesses have adopted work-from-home policies; hence, the demand for remote learning and development systems is rising.
  • During COVID-19 stay-at-home restrictions, SIS became invaluable because stakeholders could access student data, including admissions, academics, financial aid, account and billing, graduation, and career placement. While the pandemic forced institutions to shift to a remote teaching and learning model, schools that had an SIS in place allowed remote accessibility.
  • The strict lockdown enforced the faculties and trainers to adopt online teaching and learning solutions, increasing the demand for online learning platforms. It helped the student information system market to expand. SIS solution allows faculty to monitor and measure student success throughout and helps maintain a personal touch.
  • Amid the pandemic, institutions quickly adopt cloud-based SIS solutions and services that let their users access data from anywhere.
  • Owing to the adoption of remote working and online education by most organizations and institutions in Europe, the focus on network security, cloud network types, and business continuity has increased in the last few months.
  • The COVID-19 pandemic has created challenges for higher education, including shifting how institutions engage with students as well as budget uncertainties due to reduced enrollment and in-person learning. As a result, many institutions are accelerating their business and technology transformation efforts to better respond to the dynamics of the changing world.

Available Customizations

Along with the market data, MarketsandMarkets offers customizations as per the company’s specific needs. The following customization options are available for the report:

Geographic Analysis

  • Further breakup of the Asia Pacific market into countries contributing 75% to the regional market size
  • Further breakup of the North American market into countries contributing 75% to the regional market size
  • Further breakup of the Latin American market into countries contributing 75% to the regional market size
  • Further breakup of the Middle Eastern & African market into countries contributing 75% to the regional market size
  • Further breakup of the European market into countries contributing 75% to the regional market size

Company Information

  • Detailed analysis and profiling of additional market players (up to 5)
Custom Market Research Services

We will customize the research for you, in case the report listed above does not meet with your exact requirements. Our custom research will comprehensively cover the business information you require to help you arrive at strategic and profitable business decisions.

Request Customization

Instant Answers with GPT - Ask Now!

Ask real questions. Get complete answers !
Report Code
TC 7018
Published ON
May, 2022
Choose License Type
BUY NOW
  • SHARE
X
Request Customization
Speak to Analyst
Speak to Analyst
OR FACE-TO-FACE MEETING
PERSONALIZE THIS RESEARCH
  • Triangulate with your Own Data
  • Get Data as per your Format and Definition
  • Gain a Deeper Dive on a Specific Application, Geography, Customer or Competitor
  • Any level of Personalization
REQUEST A FREE CUSTOMIZATION
LET US HELP YOU!
  • What are the Known and Unknown Adjacencies Impacting the Student Information System Market
  • What will your New Revenue Sources be?
  • Who will be your Top Customer; what will make them switch?
  • Defend your Market Share or Win Competitors
  • Get a Scorecard for Target Partners
CUSTOMIZED WORKSHOP REQUEST
+1-888-600-6441
  • Call Us
  • +1-888-600-6441 (Corporate office hours)
  • +1-888-600-6441 (US/Can toll free)
  • +44-800-368-9399 (UK office hours)
CONNECT WITH US
ABOUT TRUST ONLINE
©2024 MarketsandMarkets Research Private Ltd. All rights reserved
DMCA.com Protection Status Website Feedback