Subsea Well Access System Market by Type (Rig-Based and Vessel-Based), and Region - Global Forecasts to 2022


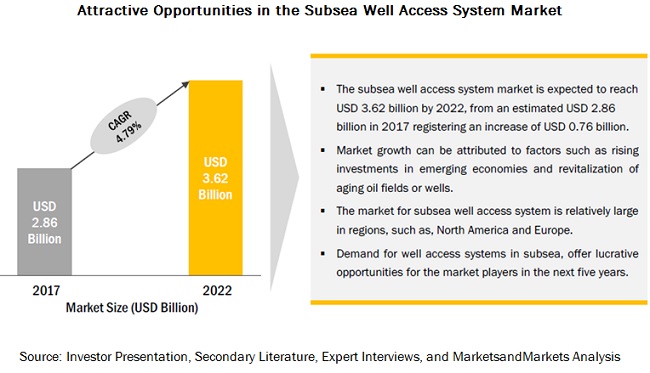
[164 Pages Report] MarketsandMarkets forecasts the Subsea well access system market to grow from USD 2.86 billion in 2017 to USD 3.62 billion by 2022, at a Compound Annual Growth Rate (CAGR) of 4.79% during the forecast period. New offshore discoveries, increasing demand for well access system in subsea, would drive the subsea well access system market.
The rig-based well access system segment is expected to grow at the highest CAGR from 2017 to 2022
Based on type, the rig-based well access system segment is estimated to be the fastest growing market from 2017 to 2022. The increase in production activities in the offshore segment led to increase in development of the rig-based well access system. Factors such as the increase in demand from deep offshore oil & gas fields is expected to drive the growth of the rig-based well access system segment of the subsea well access system market.
The annular BOP segment is expected to grow at the highest CAGR during the forecast period
Based on type, the annular BOP segment is estimated to be the fastest growing market from 2017 to 2022. Due to wide usage and increased drilling activity across regions, the demand for drilling equipment is expected to grow over the forecast period. This would drive the growth of the annular BOP segment of the BOP market.
The onshore segment is expected to grow at the highest CAGR from 2017 to 2022
Based on application, the drilling equipment segment is estimated to be the fastest growing market from 2017 to 2022. Due to increase in demand for onshore wells and drilling activities, the demand for the onshore segment is expected to grow over the forecast period. This would drive the growth for the onshore segment of the BOP market.
North America: The largest market for subsea well access system and BOP
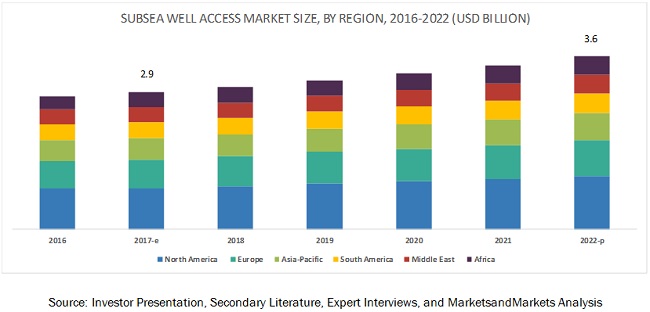
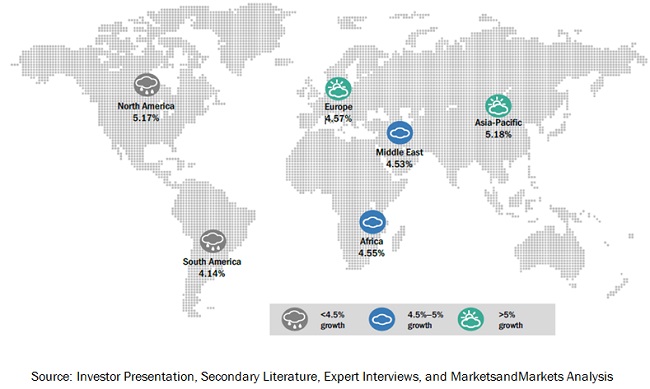
The market in North America is currently the largest market for subsea well access system and BOP, followed by the Middle East and Asia-Pacific. Increasing oil & gas production activities in the U.S., are driving the subsea well access system & BOP market. The market in the U.S. is estimated to be the fastest growing market in the region, followed by the market in Canada, during the forecast period.
Market Dynamics
Driver: Revitalization of aging oil fields/wells
With the decline in oil reserves and prices, major oil & gas companies have shifted their attention towards technological advancements in inventing tools and techniques. Companies are currently focused on increasing the recovery and extending the life of mature wells, exceeding natural production levels. Increased water cut with constrained topside facilities, increasing flow assurance challenges, growing operating costs, and integrity challenges, due to aging facilities are major factors that led to mature wells. These factors are also becoming operational and economically unviable with time. This has led to a growing demand for the well access system. Apart from this, wireline-based services also help oil & gas operators to lower measurement devices into the wells, such as those used in well logging. Hence, a global increase in number of maturing wells, has resulted in the increase in demand for well access systems & BOP market.
Restraint: Oil price volatility
A major concern for the subsea oil production industry is the market price of oil. Prices of oil are many a times affected by factors beyond the control of production companies, which can disrupt the economics of the production and development of oilfields. As subsea production involves comparatively more costs for exploration, drilling, production, and transport, a long-term downturn in oil prices can hurt offshore production more than conventional onshore production. E&P activities in offshore wells are time consuming and the payback period is approximately 10 years for deep water drilling, which is twice as higher as compared to onshore activities, which includes shale operations. The financial risks for operators are higher in offshore wells.
Opportunity: New off shore discoveries
With the increasing need for oil production, operators have turned towards offshore exploration on a large scale and are constantly scouting deep seas for untapped oil reserves. Unprecedented advancements in exploration technology for deep water exploration and production activities, declining oil reserves in shallow water, and the commercial viability of projects are the major driving factors for E&P operators to explore new offshore regions. Advancements of exploration technology for deep water E&P activities are helping in new discoveries of subsea oil reserves. For example, in October 2014 Statoil Petroleum AS announced the new reserves discovery in 2014 near the Grane field in the North Sea. The reserve discovered was assessed way back in 1992 but was considered insignificant back then. With the help of new technologies and reassessment of assets, the estimated reserves were found ten times larger than what was projected. Thus, new offshore oil discoveries with the help of better technology, presents a huge opportunity for the subsea well access system and BOP market in the future. The reserves in the Artic region could create attractive opportunities for the subsea well access system and BOP market as the U.S. Geological Survey estimated that 90 billion barrels of oil, 1,669 trillion cubic feet of natural gas, and 44 billion barrels of natural gas liquids may exist in 33 Arctic provinces.
Challenge: High temperature intervention challenges
The effect of high temperature on equipment continues to be a challenge in successful High Pressure & High Temperature (HPHT) well intervention. These wells present unique challenges to oil and service companies. Drilling and completing a well at 4,000-foot to 7,500-foot water depths is the biggest challenge. The depth requires wells to flow at an increasingly higher rate without damaging the wellbore, raising the temperature of a wellhead. Some of the roughest environments in the industry, in North America, include conditions around shale wells, such as battering from wind, cold temperatures, constant moisture from storms, and mist from high winds. It also includes geophysical conditions in the Gulf of Mexico.
Scope of the Report
|
Report Metric |
Details |
|
Market size available for years |
2016�2022 |
|
Base year considered |
2017 |
|
Forecast period |
2017�2022 |
|
Forecast units |
Billion (USD) |
|
Segments covered |
Type (Rig Based, Vessel based), BOP Type (Annular BOP, RAM BOP), End-User and Region |
|
Geographies covered |
Asia Pacific, Europe, North America, South America, Middle East, and Africa |
|
Companies covered |
Aker Solutions (Norway), Baker Hughes Incorporated (U.S.), Circle T Service & Rental, Ltd. (Canada), COR International, LLC (U.A.E.), Diamond Offshore Drilling, Inc. (U.S.), Drilling Services Limited (U.K.), Dril-Quip, Inc. (U.S.), GE Oil & Gas (U.K.), Halliburton Company (U.S.), Island Offshore (Norway), Key Energy Services (U.S.), KIT Oil and Gas Equipment Industry, LLC (U.A.E.), National Oilwell Varco, Inc. (U.S.), Oceaneering International, Inc. (U.S.), Optime Subsea Services (U.S.), Parker Hannifin, Corp. (U.K.), Proserv (U.S.), Rongsheng Machinery Manufacture, Ltd. Of Huabei Oilfield Hebei (China), Schlumberger Limited (U.S.), TechnipFMC, PLC (U.S.), Tenaris (Luxembourg), UZTEL S.A. (Romania), Vallourec (France), Weatherford International Limited (U.S.), and 4Subsea (Norway) |
The research report categorizes the subsea well access market to forecast the revenues and analyze the trends in each of the following sub-segments:
Subsea Well Access Market By Type
- Vessel based
- Rig based
- Completion Workover Riser System
- Landing String System
- Others
Subsea Well Access Market By Type
- Annular BOP
- RAM BOP
Subsea Well Access Market By End-User
- Offshore
- Onshore
Subsea Well Access Market By Region
- Asia Pacific
- Europe
- North America
- Middle East
- Africa
- South America
Key Market Players
The subsea well access system and BOP market is dominated by a few global players. Key players operating in the market include Schlumberger Limited (U.S.), Halliburton Company (U.S.), GE Oil & Gas (U.K.), Baker Hughes Incorporated (U.S.), and National Oilwell Varco (U.S.), among others. Major strategies adopted by players in the subsea well access system and BOP market includes contracts & agreements and new product launches. Contracts & agreements was the most commonly adopted strategy from 2014 to May 2017. Industry players also adopted new product launches, which was the second most widely followed strategy from 2014 to May 2017.
Schlumberger Limited (U.S.) is a leading provider of products, services, technology, information solutions, and integrated project management solutions for the oil & gas industry. The company mainly offers its products under four segments namely, production, drilling, reservoir characterization, and Cameron. The company operates its business in 85 countries globally and have 80 research and engineering technology centers. New products, recently launched by the company, generated approximately 20% of the group revenue in 2016. The company recently launched AvantGuard advanced flow back services in 2016.
Halliburton Company (U.S.) is one of the leading service providers and product suppliers in the upstream sector of the oil & gas industry. The company provides Product Service Lines (PSLs) under two main divisions, namely, drilling and evaluation and completion and production. The company operates its business in 80 countries across the globe. The company has manufacturing operations in the U.S., China, Singapore, Canada, Malaysia, and the U.K. The long-term strategy of the company is to focus on three areas, namely, international business opportunities, applied technology, and integrated solutions. In March 2017, the company launched spectrum fusion service, to provide downhole data for customizing well intervention and maximizing production.
Recent Developments
- In May 2017, Baker Hughes Incorporated (U.S.) developed deep water multistage fracturing service (DEEPFRAC). The scope of the invention was to eliminate casing and cementing operations by using ball-activated, multi-position sleeves that would be installed in open-hole wellbores containing drilling mud.
- In January 2017, Schlumberger Limited (U.S.) acquired Peak Well Systems (Australia). Peak, designs and develops downhole tools for well integrity, well intervention, and flow control. This would strengthen Schlumberger�s production services.
- In January 2017, Schlumberger Limited (U.S.) was awarded a contract from Statoil ASA (Norway). The scope of the contract was to provide subsea production systems, which include subsea manifold system, two subsea wellheads, vertical monobore subsea trees, production control system, intervention, and workover tooling.
- In October 2016, Aker solutions (Norway) was awarded two contracts from DEA Norge AS (Norway). The scope of the contract was for the subsea production system and maintenance and services at the Dvalin natural gas offshore, Norway. The contract was worth USD 106.9 million.
Critical questions the report answers:
- Where will all these developments take the industry in the long term?
- What are the upcoming trends for the subsea well access market?
- Which segment provides the most opportunity for growth?
- Who are the leading manufacturers operating in this market?
- What are the opportunities for new market entrants?
To speak to our analyst for a discussion on the above findings, click Speak to Analyst
 Exclusive indicates content/data unique to MarketsandMarkets and not available with any competitors.
Table of Contents
1 Introduction (Page No. - 18)
1.1 Objectives of the Study
1.2 Market Definition
1.3 Market Scope
1.3.1 Markets Covered
1.3.2 Years Considered for the Study
1.4 Currency
1.5 Limitations
1.6 Stakeholders
2 Research Methodology (Page No. - 22)
2.1 Introduction
2.1.1 Secondary Data
2.1.1.1 Key Data From Secondary Sources
2.1.2 Primary Data
2.1.2.1 Key Data From Primary Sources
2.1.2.2 Key Industry Insights
2.1.2.3 Breakdown of Primaries
2.2 Market Size Estimation
2.2.1 Bottom-Up Approach
2.2.2 Top-Down Approach
2.3 Data Triangulation
2.4 Research Assumptions
2.4.1 Assumptions
3 Executive Summary (Page No. - 30)
4 Premium Insights (Page No. - 36)
4.1 Subsea Well Access System Market, By Type
4.2 BOP Market, By Type
4.3 BOP Market, By End-User
4.4 North America: the Largest Well Access System Market During the Forecast Period, By Region
4.5 North America: the Largest BOP Market During the Forecast Period, By Region
5 Market Overview (Page No. - 40)
5.1 Introduction
5.2 Market Dynamics
5.2.1 Drivers
5.2.1.1 Revitalization of Aging Oil Fields/Wells
5.2.1.2 Increase in Oil & Gas Production
5.2.2 Restraints
5.2.2.1 Oil Price Volatility
5.2.2.2 Strict Environment Regulations on E&P Activities
5.2.3 Opportunities
5.2.3.1 New Offshore Discoveries
5.2.4 Challenges
5.2.4.1 High Temperature Intervention Challenges
6 Subsea Well Access System Market, By Type (Page No. - 46)
6.1 Introduction
6.1.1 Subsea Well Access System Market Size, By Type, 2015�2022 (USD Million)
6.2 Vessel-Based Well Access System
6.2.1 Vessel-Based Well Access System: Market Size, By Region, 2015�2022 (USD Million)
6.3 Rig-Based Well Access System
6.3.1 Rig-Based Well Access System: Market Size, By Region, 2015�2022 (USD Million)
6.3.2 Completion Workover Riser System
6.3.3 Landing String System
6.3.4 Others (Through Tubing Rotary Drilling Technology)
7 Blowout Preventer (BOP) Market, By Type (Page No. - 51)
7.1 Introduction
7.1.1 Blowout Preventer (BOP) Market Size, By Type, 2015�2022 (USD Million)
7.2 Annular BOP
7.2.1 Annular BOP: Blowout Preventer (BOP) Market Size, By Region, 2015�2022 (USD Million)
7.3 Ram BOP
7.3.1 Ram BOP: Blowout Preventer (BOP) Market Size, By Region, 2015�2022 (USD Million)
8 Blowout Preventer (BOP) Market, By End-User (Page No. - 55)
8.1 Introduction
8.1.1 Blowout Preventer (BOP) Market Size, By End-User, 2015�2022 (USD Million)
8.2 Offshore
8.2.1 Offshore: Blowout Preventer (BOP) Market Size, By Region, 2015�2022 (USD Million)
8.3 Onshore
8.3.1 Onshore: Blowout Preventer (BOP) Market Size, By Region, 2015�2022 (USD Million)
9 Subsea Well Access System & BOP Market, By Region (Page No. - 59)
9.1 Introduction
9.1.1 Subsea Well Access System Market Size, By Region, 2015�2022 (USD Million)
9.1.2 BOP, Market Size, By Region, 2015�2022 (USD Million)
9.2 North America
9.2.1 North America: Subsea Well Access System Market Size, By Country, 2015�2022 (USD Million)
9.2.2 North America: BOP Market Size, By Country, 2015�2022 (USD Million)
9.2.3 Subsea Well Access System, By Type
9.2.3.1 North America: Market Size, By Type, 2015�2022 (USD Million)
9.2.4 BOP, By Type
9.2.4.1 North America: BOP Market Size, By Type, 2015�2022 (USD Million)
9.2.5 BOP, By End-User
9.2.5.1 North America: BOP Market Size, By End-User, 2015�2022 (USD Million)
9.2.5.2 By Country
9.2.5.2.1 U.S.
9.2.5.2.1.1 U.S.: Market Size, By Type, 2015�2022 (USD Million)
9.2.5.2.1.2 U.S.: BOP Market Size, By Type, 2015�2022 (USD Million)
9.2.5.2.2 Canada
9.2.5.2.2.1 Canada: Market Size, By Type, 2015�2022 (USD Million)
9.2.5.2.2.2 Canada: BOP Market Size, By Type, 2015�2022 (USD Million)
9.2.5.2.3 Mexico
9.2.5.2.3.1 Mexico: Market Size, By Type, 2015�2022 (USD Million)
9.2.5.2.3.2 Mexico: BOP Market Size, By Type, 2015�2022 (USD Million)
9.3 South America
9.3.1 South America: Market Size, By Country, 2015�2022 (USD Million)
9.3.2 South America: BOP Market Size, By Country, 2015�2022 (USD Million)
9.3.3 Subsea Well Access System, By Type
9.3.3.1 South America: Market Size, By Type, 2015�2022 (USD Million)
9.3.4 BOP, By Type
9.3.4.1 South America: BOP Market Size, By Type, 2015�2022 (USD Million)
9.3.5 BOP, By End-User
9.3.5.1 South America: BOP Market Size, By End-User, 2015�2022 (USD Million)
9.3.5.2 By Country
9.3.5.2.1 Brazil
9.3.5.2.1.1 Brazil: Market Size, By Type, 2015�2022 (USD Million)
9.3.5.2.1.2 Brazil: BOP Market Size, By Type, 2015�2022 (USD Million)
9.3.5.2.2 Venezuela
9.3.5.2.2.1 Venezuela: Market Size, By Type, 2015�2022 (USD Million)
9.3.5.2.2.2 Venezuela: BOP Market Size, By Type, 2015�2022 (USD Million)
9.3.5.2.3 Rest of South America
9.3.5.2.3.1 Rest of South America: Market Size, By Type, 2015�2022 (USD Million)
9.3.5.2.3.2 Rest of South America: BOP Market Size, By Type, 2015�2022 (USD Million)
9.4 Asia-Pacific
9.4.1 Asia-Pacific: Subsea Well Access System Market Size, By Country, 2015�2022 (USD Million)
9.4.2 Asia-Pacific: BOP Market Size, By Country, 2015�2022 (USD Million)
9.4.3 Subsea Well Access System, By Type
9.4.3.1 Asia-Pacific: Market Size, By Type, 2015�2022 (USD Million)
9.4.4 BOP, By Type
9.4.4.1 Asia-Pacific: BOP Market Size, By Type, 2015�2022 (USD Million)
9.4.5 BOP, By End-User
9.4.5.1 Asia-Pacific: BOP Market Size, By End-User, 2015�2022 (USD Million)
9.4.5.2 By Country
9.4.5.2.1 China
9.4.5.2.1.1 China: Subsea Well Access System Market Size, By Type, 2015�2022 (USD Million)
9.4.5.2.1.2 China: BOP Market Size, By Type, 2015�2022 (USD Million)
9.4.5.2.2 India
9.4.5.2.2.1 Inida: Market Size, By Type, 2015�2022 (USD Million)
9.4.5.2.2.2 India: BOP Market Size, By Type, 2015�2022 (USD Million)
9.4.5.2.3 Malaysia
9.4.5.2.3.1 Malaysia: Subsea Well Access System Market Size, By Type, 2015�2022 (USD Million)
9.4.5.2.3.2 Malaysia: BOP Market Size, By Type, 2015�2022 (USD Million)
9.4.5.2.4 Indonesia
9.4.5.2.4.1 Indonesia: Market Size, By Type, 2015�2022 (USD Million)
9.4.5.2.4.2 Indonesia: BOP Market Size, By Type, 2015�2022 (USD Million)
9.4.5.2.5 Australia
9.4.5.2.5.1 Australia: Subsea Well Access System Market Size, By Type, 2015�2022 (USD Million)
9.4.5.2.5.2 Australia: BOP Market Size, By Type, 2015�2022 (USD Million)
9.4.5.2.6 Rest of Asia-Pacific
9.4.5.2.6.1 Rest of Asia-Pacific: Market Size, By Type, 2015�2022 (USD Million)
9.4.5.2.6.2 Rest of Asia-Pacific: BOP Market Size, By Type, 2015�2022 (USD Million)
9.5 Europe
9.5.1 Europe: Subsea Well Access System Market Size, By Country, 2015�2022 (USD Million)
9.5.2 Europe: BOP Market Size, By Country, 2015�2022 (USD Million)
9.5.3 Subsea Well Access System By Type
9.5.3.1 Europe: Market Size, By Type, 2015�2022 (USD Million)
9.5.4 BOP, By Type
9.5.4.1 Europe: BOP Market Size, By Type, 2015�2022 (USD Million)
9.5.5 BOP, By End-User
9.5.5.1 Europe: BOP Market Size, By End-User, 2015�2022 (USD Million)
9.5.5.2 By Country
9.5.5.2.1 Norway
9.5.5.2.1.1 Norway: Subsea Well Access System Market Size, By Type, 2015�2022 (USD Million)
9.5.5.2.1.2 Norway: BOP Market Size, By Type, 2015�2022 (USD Million)
9.5.5.2.2 Denmark
9.5.5.2.2.1 Denmark: Subsea Well Access System Market Size, By Type, 2015�2022 (USD Million)
9.5.5.2.2.2 Denmark: BOP Market Size, By Type, 2015�2022 (USD Million)
9.5.5.2.3 U.K.
9.5.5.2.3.1 U.K.: Market Size, By Type, 2015�2022 (USD Million)
9.5.5.2.3.2 U.K.: BOP Market Size, By Type, 2015�2022 (USD Million)
9.5.5.2.4 Russia
9.5.5.2.4.1 Russia: Subsea Well Access System Market Size, By Type, 2015�2022 (USD Million)
9.5.5.2.4.2 Russia: BOP Market Size, By Type, 2015�2022 (USD Million)
9.5.5.2.5 Rest of Europe
9.5.5.2.5.1 Rest of Europe: Market Size, By Type, 2015�2022 (USD Million)
9.5.5.2.5.2 Rest of Europe: BOP Market Size, By Type, 2015�2022 (USD Million)
9.6 Middle East
9.6.1 Middle East: Subsea Well Access System Market Size, By Country, 2015�2022 (USD Million)
9.6.2 Middle East: BOP Market Size, By Country, 2015�2022 (USD Million)
9.6.3 Subsea Well Access System, By Type
9.6.3.1 Middle East: Subsea Well Access System Market Size, By Type, 2015�2022 (USD Million)
9.6.4 BOP, By Type
9.6.4.1 Middle East: BOP Market Size, By Type, 2015�2022 (USD Million)
9.6.5 BOP, By End-User
9.6.5.1 Middle East: BOP Market Size, By End-User, 2015�2022 (USD Million)
9.6.5.2 By Country
9.6.5.2.1 Saudi Arabia
9.6.5.2.1.1 Saudi Arabia: Market Size, By Type, 2015�2022 (USD Million)
9.6.5.2.1.2 Saudi Arabia: BOP Market Size, By Type, 2015�2022 (USD Million)
9.6.5.2.2 U.A.E.
9.6.5.2.2.1 U.A.E.: Subsea Well Access System Market Size, By Type, 2015�2022 (USD Million)
9.6.5.2.2.2 U.A.E.: BOP Market Size, By Type, 2015�2022 (USD Million)
9.6.5.2.3 Iran
9.6.5.2.3.1 Iran: Market Size, By Type, 2015�2022 (USD Million)
9.6.5.2.3.2 Iran: BOP Market Size, By Type, 2015�2022 (USD Million)
9.6.5.2.4 Qatar
9.6.5.2.4.1 Qatar: Subsea Well Access System Market Size, By Type, 2015�2022 (USD Million)
9.6.5.2.4.2 Qatar: BOP Market Size, By Type, 2015�2022 (USD Million)
9.6.5.2.5 Rest of the Middle East
9.6.5.2.5.1 Rest of the Middle East: Subsea Well Access System Market, By Type, 2015�2022 (USD Million)
9.6.5.2.5.2 Rest of the Middle East: BOP Market Size, By Type, 2015�2022 (USD Million)
9.7 Africa
9.7.1 Africa: Market Size, By Country, 2015�2022 (USD Million)
9.7.2 Africa: BOP Market Size, By Country, 2015�2022 (USD Million)
9.7.3 Subsea Well Access System, By Type
9.7.3.1 Africa: Subsea Well Access System Market Size, By Type, 2015�2022 (USD Million)
9.7.4 BOP, By Type
9.7.4.1 Africa: BOP Market Size, By Type, 2015�2022 (USD Million)
9.7.5 BOP, By End-User
9.7.5.1 Africa: BOP Market Size, By End-User, 2015�2022 (USD Million)
9.7.6 By Country
9.7.6.1 Nigeria
9.7.6.1.1 Nigeria: Market Size, By Type, 2015�2022 (USD Million)
9.7.6.1.2 Nigeria: BOP Market Size, By Type, 2015�2022 (USD Million)
9.7.6.2 Angola
9.7.6.2.1 Angola: Subsea Well Access System Market Size, By Type, 2015�2022 (USD Million)
9.7.6.2.2 Angola: BOP Market Size, By Type, 2015�2022 (USD Million)
9.7.6.3 Algeria
9.7.6.3.1 Algeria: Market Size, By Type, 2015�2022 (USD Million)
9.7.6.3.2 Algeria: BOP Market Size, By Type, 2015�2022 (USD Million)
9.7.6.4 Rest of Africa
9.7.6.4.1 Rest of Africa: Subsea Well Access System Market Size, By Type, 2015�2022 (USD Million)
9.7.6.4.2 Rest of Africa: BOP Market Size, By Type, 2015�2022 (USD Million)
10 Competitive Landscape (Page No. - 108)
10.1 Overview
10.2 Key Players of the Subsea Well Access System & BOP Market
10.2.1 Growth Strategies in the Subsea Well Access System & BOP Market
10.3 Market Share Analysis
10.3.1 Global Market Scenario
10.4 Competitive Situations & Trends
10.5 Subsea Well Access System & BOP Market (Global) Competitive Leadership Mapping, 2017
10.5.1 Visionary Leaders
10.5.2 Dynamic Differentiators
10.5.3 Innovators
10.5.4 Emergingcompanies
10.6 Analysis of the Product Portfolio of Major Players in the Subsea Well Access System & BOP Market (25 Companies)
10.7 Business Strategy Adopted By Major Players in the Subsea Well Access System & BOP Market (25 Companies)
11 Company Profiles (Page No. - 116)
11.1 Aker Solutions ASA
11.1.1 Business Overview
11.1.2 Product Offering Scorecard
11.1.3 Business Strategy Scorecard
11.1.4 Recent Developments
11.2 Baker Hughes Incorporated
11.2.1 Overview
11.2.2 Product Offering Scorecard
11.2.3 Business Strategy Scorecard
11.2.4 Recent Developments
11.3 Halliburton Company
11.3.1 Overview
11.3.2 Product Offering Scorecard
11.3.3 Business Strategy Scorecard
11.3.4 Recent Developments
11.4 Schlumberger Limited
11.4.1 Overview
11.4.2 Product Offering Scorecard
11.4.3 Business Strategy Scorecard
11.4.4 Recent Developments
11.5 Riverstone Holdings, LLC
11.5.1 Overview
11.5.2 Product Offering Scorecard
11.5.3 Business Strategy Scorecard
11.5.4 Recent Developments
11.6 Parker-Hannifin Corporation
11.6.1 Overview
11.6.2 Product Offering Scorecard
11.6.3 Business Strategy Scorecard
11.6.4 Recent Developments
11.7 Weatherford International Limited
11.7.1 Overview
11.7.2 Product Offering Scorecard
11.7.3 Business Strategy Scorecard
11.7.4 Recent Developments
11.8 Oceaneering International, Inc.
11.8.1 Overview
11.8.2 Product Offering Scorecard
11.8.3 Business Strategy Scorecard
11.8.4 Recent Developments
11.9 Drilling Services Limited
11.9.1 Overview
11.9.2 Product Offering Scorecard
11.9.3 Business Strategy Scorecard
11.10 National Oilwell Varco, Inc.
11.10.1 Overview
11.10.2 Product Offering Scorecard
11.10.3 Business Strategy Scorecard
11.10.4 Recent Developments
11.11 Dril-Quip, Inc.
11.11.1 Overview
11.11.2 Product Offering Scorecard
11.11.3 Business Strategy Scorecard
11.11.4 Recent Developments
11.12 Technipfmc, PLC
11.12.1 Overview
11.12.2 Product Offering Scorecard
11.12.3 Business Strategy Scorecard
11.12.4 Recent Developments
11.13 GE Oil & Gas
11.13.1 Overview
11.13.2 Product Offering Scorecard
11.13.3 Business Strategy Scorecard
11.13.4 Recent Developments
12 Appendix (Page No. - 155)
12.1 Insights of Industry Experts
12.3 Knowledge Store: Marketsandmarkets� Subscription Portal
12.4 Introducing RT: Real-Time Market Intelligence
12.5 Available Customizations
12.6 Related Reports
12.7 Author Details
List of Tables (96 Tables)
Table 1 Subsea Well Access System Market Snapshot
Table 2 BOP Market Snapshot
Table 3 Subsea Well Access System Market Size, By Type, 2015�2022 (USD Million)
Table 4 Vessel-Based Well Access System: Subsea Well Access System Market Size, By Region, 2015�2022 (USD Million)
Table 5 Rig-Based Well Access System: Subsea Well Access System Market Size, By Region, 2015�2022 (USD Million)
Table 6 Blowout Preventer (BOP) Market Size, By Type, 2015�2022 (USD Million)
Table 7 Annular BOP: Blowout Preventer (BOP) Market Size, By Region, 2015�2022 (USD Million)
Table 8 Ram BOP: Blowout Preventer (BOP) Market Size, By Region, 2015�2022 (USD Million)
Table 9 Blowout Preventer (BOP) Market Size, By End-User, 2015�2022 (USD Million)
Table 10 Offshore: Blowout Preventer (BOP) Market Size, By Region, 2015�2022 (USD Million)
Table 11 Onshore: Blowout Preventer (BOP) Market Size, By Region, 2015�2022 (USD Million)
Table 12 Subsea Well Access System Market Size, By Region, 2015�2022 (USD Million)
Table 13 BOP, Market Size, By Region, 2015�2022 (USD Million)
Table 14 North America: Subsea Well Access System Market Size, By Country, 2015�2022 (USD Million)
Table 15 North America: BOP Market Size, By Country, 2015�2022 (USD Million)
Table 16 North America: Subsea Well Access System Market Size, By Type, 2015�2022 (USD Million)
Table 17 North America: BOP Market Size, By Type, 2015�2022 (USD Million)
Table 18 North America: BOP Market Size, By End-User, 2015�2022 (USD Million)
Table 19 U.S.: Market Size, By Type, 2015�2022 (USD Million)
Table 20 U.S.: BOP Market Size, By Type, 2015�2022 (USD Million)
Table 21 Canada: Market Size, By Type, 2015�2022 (USD Million)
Table 22 Canada: BOP Market Size, By Type, 2015�2022 (USD Million)
Table 23 Mexico: Subsea Well Access System Market Size, By Type, 2015�2022 (USD Million)
Table 24 Mexico: BOP Market Size, By Type, 2015�2022 (USD Million)
Table 25 South America: Market Size, By Country, 2015�2022 (USD Million)
Table 26 South America: BOP Market Size, By Country, 2015�2022 (USD Million)
Table 27 South America: Market Size, By Type, 2015�2022 (USD Million)
Table 28 South America: BOP Market Size, By Type, 2015�2022 (USD Million)
Table 29 South America: BOP Market Size, By End-User, 2015�2022 (USD Million)
Table 30 Brazil: Subsea Well Access System Market Size, By Type, 2015�2022 (USD Million)
Table 31 Brazil: BOP Market Size, By Type, 2015�2022 (USD Million)
Table 32 Venezuela: Market Size, By Type, 2015�2022 (USD Million)
Table 33 Venezuela: BOP Market Size, By Type, 2015�2022 (USD Million)
Table 34 Rest of South America: Market Size, By Type, 2015�2022 (USD Million)
Table 35 Rest of South America: BOP Market Size, By Type, 2015�2022 (USD Million)
Table 36 Asia-Pacific: Market Size, By Country, 2015�2022 (USD Million)
Table 37 Asia-Pacific: BOP Market Size, By Country, 2015�2022 (USD Million)
Table 38 Asia-Pacific: Market Size, By Type, 2015�2022 (USD Million)
Table 39 Asia-Pacific: BOP Market Size, By Type, 2015�2022 (USD Million)
Table 40 Asia-Pacific: BOP Market Size, By End-User, 2015�2022 (USD Million)
Table 41 China: Subsea Well Access System Market Size, By Type, 2015�2022 (USD Million)
Table 42 China: BOP Market Size, By Type, 2015�2022 (USD Million)
Table 43 Inida: Market Size, By Type, 2015�2022 (USD Million)
Table 44 India: BOP Market Size, By Type, 2015�2022 (USD Million)
Table 45 Malaysia: Market Size, By Type, 2015�2022 (USD Million)
Table 46 Malaysia: BOP Market Size, By Type, 2015�2022 (USD Million)
Table 47 Indonesia: Market Size, By Type, 2015�2022 (USD Million)
Table 48 Indonesia: BOP Market Size, By Type, 2015�2022 (USD Million)
Table 49 Australia: Market Size, By Type, 2015�2022 (USD Million)
Table 50 Australia: BOP Market Size, By Type, 2015�2022 (USD Million)
Table 51 Rest of Asia-Pacific: Subsea Well Access System Market Size, By Type, 2015�2022 (USD Million)
Table 52 Rest of Asia-Pacific: BOP Market Size, By Type, 2015�2022 (USD Million)
Table 53 Europe: Market Size, By Country, 2015�2022 (USD Million)
Table 54 Europe: BOP Market Size, By Country, 2015�2022 (USD Million)
Table 55 Europe: Market Size, By Type, 2015�2022 (USD Million)
Table 56 Europe: BOP Market Size, By Type, 2015�2022 (USD Million)
Table 57 Europe: BOP Market Size, By End-User, 2015�2022 (USD Million)
Table 58 Norway: Subsea Well Access System Market Size, By Type, 2015�2022 (USD Million)
Table 59 Norway: BOP Market Size, By Type, 2015�2022 (USD Million)
Table 60 Denmark: Subsea Well Access System Market Size, By Type, 2015�2022 (USD Million)
Table 61 Denmark: BOP Market Size, By Type, 2015�2022 (USD Million)
Table 62 U.K.: Subsea Well Access System Market Size, By Type, 2015�2022 (USD Million)
Table 63 U.K.: BOP Market Size, By Type, 2015�2022 (USD Million)
Table 64 Russia: Subsea Well Access System Market Size, By Type, 2015�2022 (USD Million)
Table 65 Russia: BOP Market Size, By Type, 2015�2022 (USD Million)
Table 66 Rest of Europe: Market Size, By Type, 2015�2022 (USD Million)
Table 67 Rest of Europe: BOP Market Size, By Type, 2015�2022 (USD Million)
Table 68 Middle East: Market Size, By Country, 2015�2022 (USD Million)
Table 69 Middle East: BOP Market Size, By Country, 2015�2022 (USD Million)
Table 70 Middle East: Market Size, By Type, 2015�2022 (USD Million)
Table 71 Middle East: BOP Market Size, By Type, 2015�2022 (USD Million)
Table 72 Middle East: BOP Market Size, By End-User, 2015�2022 (USD Million)
Table 73 Saudi Arabia: Market Size, By Type, 2015�2022 (USD Million)
Table 74 Saudi Arabia: BOP Market Size, By Type, 2015�2022 (USD Million)
Table 75 U.A.E.: Market Size, By Type, 2015�2022 (USD Million)
Table 76 U.A.E.: BOP Market Size, By Type, 2015�2022 (USD Million)
Table 77 Iran: Subsea Well Access System Market Size, By Type, 2015�2022 (USD Million)
Table 78 Iran: BOP Market Size, By Type, 2015�2022 (USD Million)
Table 79 Qatar: Market Size, By Type, 2015�2022 (USD Million)
Table 80 Qatar: BOP Market Size, By Type, 2015�2022 (USD Million)
Table 81 Rest of the Middle East: Subsea Well Access System Market, By Type, 2015�2022 (USD Million)
Table 82 Rest of the Middle East: BOP Market Size, By Type, 2015�2022 (USD Million)
Table 83 Africa: Subsea Well Access System Market Size, By Country, 2015�2022 (USD Million)
Table 84 Africa: BOP Market Size, By Country, 2015�2022 (USD Million)
Table 85 Africa: Market Size, By Type, 2015�2022 (USD Million)
Table 86 Africa: BOP Market Size, By Type, 2015�2022 (USD Million)
Table 87 Africa: BOP Market Size, By End-User, 2015�2022 (USD Million)
Table 88 Nigeria: Subsea Well Access System Market Size, By Type, 2015�2022 (USD Million)
Table 89 Nigeria: BOP Market Size, By Type, 2015�2022 (USD Million)
Table 90 Angola: Market Size, By Type, 2015�2022 (USD Million)
Table 91 Angola: BOP Market Size, By Type, 2015�2022 (USD Million)
Table 92 Algeria: Subsea Well Access System Market Size, By Type, 2015�2022 (USD Million)
Table 93 Algeria: BOP Market Size, By Type, 2015�2022 (USD Million)
Table 94 Rest of Africa: Market Size, By Type, 2015�2022 (USD Million)
Table 95 Rest of Africa: BOP Market Size, By Type, 2015�2022 (USD Million)
Table 96 Market Ranking Based on Revenue, 2016
List of Figures (42 Figures)
Figure 1 Market Segmentation: Subsea Well Access System & BOP Market
Figure 2 Countries Covered
Figure 3 Subsea Well Access System & BOP Market: Research Design
Figure 4 Breakdown of Primary Interviews: By Company Type, Designation, & Region
Figure 5 Market Size Estimation Methodology: Bottom-Up Approach
Figure 6 Market Size Estimation Methodology: Top-Down Approach
Figure 7 Subsea Well Access & BOP Market: Data Triangulation Methodology
Figure 8 The Market for Rig-Based Subsea Well Access System to Register the Highest Growth Between 2017 & 2022
Figure 9 Market for Annular BOP, to Register the Highest Growth Between 2017 & 2022
Figure 10 Market for Onshore, to Register the Highest Growth Between 2017 & 2022
Figure 11 Asia-Pacific to Dominate the Subsea Well Access System Market Between 2017 & 2022
Figure 12 Asia-Pacific to Dominate the BOP, Market Between 2017 & 2022
Figure 13 Attractive Market Opportunities in the Subsea Well Access System Market
Figure 14 Attractive Market Opportunities in the BOP, Market
Figure 15 Susbea Well Access System Market Share (Value), By Type, 2017�2022
Figure 16 Annular BOP Segment is Estimated to Dominate the BOP, Market By 2022
Figure 17 Onshore Segment is Estimated to Dominate the BOP, Market By 2022
Figure 18 Asia-Pacific is Expected to Grow at the Fastest Pace During the Forecast Period
Figure 19 North America is Expected to Grow at the Fastest Pace During the Forecast Period
Figure 20 Market Dynamics: Subsea Well Access System & BOP Market
Figure 21 World Crude Oil Annual Production, 2015�2018
Figure 22 Subsea Well Access System Market Share (Value), 2022
Figure 23 Blowout Preventer (BOP) Market Share (Value), 2022
Figure 24 Blowout Preventer (BOP) Market Share (Value), 2022
Figure 25 Regional Snapshot: North America is Expected to Dominate the Subsea Well Access System Till 2022
Figure 26 Regional Snapshot: North America is Expected to Dominate the BOP, Market Till 2022
Figure 27 North America: Market Snapshot
Figure 28 Euroupe : Subsea Well Access System Market Snapshot
Figure 29 Companies Adopted Contracts & Agreements & New Product Launches as the Key Strategies to Capture the Market, 2014�2017
Figure 30 Market Evaluation Framework: Contracts & Agreements, Mergers & Acquisitions and Partnerships, and New Product Launches Fueled the Growth of the Companies, 2014�2017
Figure 31 Competitive Leadership Mapping, 2017
Figure 32 Aker Solutions ASA: Company Snapshot
Figure 33 Baker Hughes Incorporated: Company Snapshot
Figure 34 Halliburton Company: Company Snapshot
Figure 35 Schlumberger Limited: Company Snapshot
Figure 36 Parker-Hannifin Corporation: Company Snapshot
Figure 37 Weatherford International Limited: Company Snapshot
Figure 38 Oceaneering International, Inc.: Company Snapshot
Figure 39 National Oilwell Varco, Inc.: Company Snapshot
Figure 40 Dril-Quip, Inc.: Company Snapshot
Figure 41 Technipfmc PLC: Company Snapshot
Figure 42 GE Oil & Gas: Company Snapshot


Growth opportunities and latent adjacency in Subsea Well Access System Market