Well Intervention Market

Report Code EP 3333
Published in Jun, 2024, By MarketsandMarkets™
Download PDF

Choose License Type

Buy Report Now Inquire Before Buying

Well Intervention Market by Service (Logging and Bottomhole Survey, Tubing/Packer Failure and Repair, Stimulation), Intervention (Light, Medium, Heavy), Application (Onshore, Offshore) Well (Horizontal, Vertical), and Region - Global Forecast to 2029

Overview

The Well Intervention market is expected to grow from an estimated USD 9.2 billion in 2024 to USD 11.3 billion by 2029, at a CAGR of 4.2% during the forecast period. Well intervention will form the backbone of maintaining and enhancing the well's productivity throughout its operational lifetime, including various operations necessary for changing the state of a well, improving production enhancement, tackling challenges, and extending the lifecycle. Properly targeted interventions should further increase production rates, help achieve better reservoir performance, and maximize oil and gas recovery. It ensures efficient extraction at a cost-effective operation coupled with safety in operations over oil and gas resources.

Well Intervention market

Attractive Opportunities in the Well Intervention Market

North America

North America is the largest market for well intervention, driven by the rise in shell gas and tight oil production, coupled with favorable regulations and growth in unconventional resources.

Market growth can be attributed to factors such as increasing technological and energy demands, unconventional resource exploration, and investments.

Deals and agreement would offer lucrative opportunities for market players in the next five years.

Europe is estimated to be the second largest market during the forecasted period due to the rising focus on advanced energy-efficient technologies.

Market expansion and new intervention technologies are expected to offer lucrative opportunities for market players over the next 5 years.

Global Well Intervention Market Dynamics

DRIVER: Increasing demand for oil & gas in the Asia Pacific

Asia Pacific is the globe's largest oil market and, in 2022, accounted for more than 36% of all oil consumed around the globe, according to a report published in December 2023 by Geopolitical Intelligence Services AG. According to the International Energy Agency, 90% of the global oil demand increase from 2022 to 2028 will be from Asia Pacific. It means that such enormous scale and demand growth potential position the region at the very center of focus for energy exporters, especially oil & gas. In other words, success is indeed guaranteed to all exporters, and this marks a risk when investing in Asia.

Asia Pacific, excluding the OECD, will recover the fastest after the pandemic, based on demand from China, India, and other developing economies, mostly located in South Asia. Industrial growth accounts for most of the demand growth in Bangladesh, China, India, and Pakistan.

The region is experiencing high demand for oil and gas due to accelerated industrialization, population, and urbanization. Despite these developments, oil and gas remain important for the diversification of the energy portfolio in regions transport, manufacturing, and electricity generation. Middle-class sections are also experiencing rapid growth in Asia Pacific; hence, the energy demand continues to rise over time. As economies develop and modernize, oil & gas will continue to remain a constant so that this region will be one of the main drivers of energy demand globally.

Restraints: Volatility in oil prices and decline in upstream capital investments

This volatile nature of oil prices combined with lesser upstream capital investment has greatly affected the well intervention markets across regions of North America, Europe, and the Restraints: Volatility in oil prices and decline in upstream capital investments.

This volatile nature of oil prices combined with lesser upstream capital investment has greatly affected the well intervention markets across regions of North America, Europe, and the Asia Pacific (APAC). Rising and falling oil prices directly impact exploitation and production activities, and accordingly, oil and gas players look for cost-effective measures to sustain or enhance higher production levels. This leads to the requirement for more well intervention services as operators focus more on optimizing the existing wells instead of investing in new developments.

North America is one area where shale reservoirs have changed the energy landscape. Here, the need for well intervention is more pronounced. Operators are now looking to interventions to maximize recovery from existing wells as upstream capital investment is declining. In Europe and the APAC region, mature fields are prevalent, and the impact of oil price volatility and reduced investment is driving the market for well intervention services. Companies are using these services to extend the life of matured wells and reduce the rates of production decline. It is, therefore, increasing the well intervention market.


Opportunity: Increasing oil and gas well discoveries

The surge in oil and gas well discoveries led to massive opportunities for regional well intervention in all markets within North America, Europe, and Asia-Pacific. Maximized production faced operators amidst the newfound reserve when they conducted the exploration regarding the oil and gas discoveries. Some kinds of betterment in a well performance requires some kind of interventions to obtain an improvement of such productivity asset for a lengthened lifecycle along with its generalized performance reservoir.

The high concentration of shale formations in North America led to a series of well discoveries, and with that increased demand for intervention services, the only thing that this could do was maintain the level of production. Other discoveries were made through field explorations, both onshore and offshore, conducted in Europe and the APAC region, where oil and gas operators are investing in well intervention solutions to capitalize on these finds. The growth opportunity for the well intervention market is huge due to the increasing number of oil and gas well discoveries around the world, which in turn fuels technological advancements and market expansion.

Challenges: High competition and volatile crude oil prices

Oil and gas reserves are exhaustible resources, which implies that production activities have continuously depleted such reserves. This has always made upstream players keen to explore hostile terrains in the form of High-Pressure high-temperature (HPHT) wells. The reason for the increasing demand for operations in HPHT wells in the Gulf of Mexico Kvitebjørn, Kristin, and Huldra fields, North Sea, among others, is the increasing commercial feasibility of previously economically infeasible gas reserves and thermal recovery methods. Drilling HPHT exploratory wells, however, is an expensive and risky operation and may prove to be a challenge to the well intervention service providers.

Ultradeep wells can be drilled up to a depth of more than 10,700 m, and such wells generate hydrostatic pressure greater than 30,000 psi. All the drilling assemblies, LWD tools, wireline logging equipment, well testing tools, completion hardware, and well intervention tools are exposed to such extreme pressures and can lead to the failure of these components, potentially blocking the wellbore. Upstream operators apply a wide range of aerospace and nuclear power energy, sealing technologies, and metals and alloys to counteract the high pressures. However, its applications in oil & gas often are limited by the constraint of wellbore sizes, especially in deepwater wells. It has been challenging to manufacture logging, drilling tools, and other well intervention equipment that could withstand high-pressure extremes as well as being able to fit into small diameters of wellbores of ultradeep wells. Well intervention tool design may be complicated for a company when it requires electronic components that would be used exclusively for the high-temperature conditions found in HPHT wells, and equipment failure is relatively more expensive than in the case of a conventional well. Consequently, new products and services intended for application in hostile environments must be tested and qualified extensively before being applied downhole so that they are capable of tolerating more hostile conditions. Various codes and practices have been produced to be used as guide intervention operations in HPHT wells. For example, the Bureau of Safety and Environmental Enforcement, US produces a code of Federal Regulations applicable for HPHT well completion in the Gulf of Mexico. Among these requirements are Subsurface Safety Valves, and Related Equipment in an HPHT Environment as practiced under 30 CFR 250.804. In January 2012, The American Petroleum Institute published the technical report 1PER15K-1 Protocol for Verification and Validation of High-Pressure High-Temperature Equipment that defined a well as high pressure when exceeding 15,000 pounds per square inch with its pressure having a temperature higher than 350 degrees Fahrenheit, equivalent to 177 degrees Celsius.

This standard concerns equipment and acceptable materials that are usable in HPHT operations according to the design specifications. It also specifies the testing specifications for well control and completion hardware to ensure safety, suitability, and integrity. ONGC, India's national oil company, has categorized HPHT wells as specially challenged wells wherein the pressure is above 10-15 ksi and the temperature is above 350°F. Such wells have special cementing slurry to keep them isolated.

Global Well Intervention Market Ecosystem Analysis

The leading players in the well intervention market are Halliburton (US), Schlumberger (US), Baker Hughes (US), Weatherford International (US), NexTier Oilfield Solutions(US), Archer (Norway), Expro Group (UK), Trican Well Service (Canada), Pioneer Energy Services(US), Basic Energy Services (US), Nine Energy Services(US), Key Energy Services(US), Oceaneering International (US), Welltec (Denmark), and Altus Intervention (Norway).


Medium Intervention, by intervention type, is expected to be the fastest growing segment during the forecast period.

Based on end users, the Well Intervention market has been segmented into light intervention, medium intervention, and heavy intervention. The segment of medium intervention is likely to grow at a high rate as its application for improving subsea well quality is increasing. This segment caters to critical intervention needs in subsea environments wherein maintenance and optimization are imperative for efficient oil and gas extraction as the industry is focusing more on subsea operations. Demand for medium intervention services increases and hence drives the market growth. Besides, advancements in technology and methodologies tailored for subsea interventions further propel the expansion of the medium intervention sub-segment, which is the fastest-growing segment in the well intervention market.

The logging and bottomhole survey segment, by service segment, is expected to be the largest market during the forecast period.

This report segments the Well Intervention market based on services into logging and bottomhole survey, tubing/packer failure & repair, stimulation, remedial cementing, zonal isolation, sand control services, artificial lift, fishing, re-perforation, and others. The logging and bottomhole survey segment is also critical in assessing the state of well conditions to determine the optimization of productivity. As it provides input into reservoir characteristics and well integrity, its demand increases with a rise in exploration activities and the need for enhancement in recovery techniques. Also, the increasing number of active rigs globally further helps boost the importance of this sub-segment; hence, it is one of the largest within the well intervention market.

Asia Pacific: Second largest Well Intervention market during the forecast period.

The Asia Pacific ranks second in line with the well intervention market that is growing fast, mainly due to various causes. For one, an increase in the population of aging wells in this region has been the reason for enhancing interventions. In addition, oil and gas exploration is rising within the Asian-Pacific region, especially from countries like China, India, and Indonesia. Favorable regulations along with investment in the energy sector help the well intervention market experience further growth momentum. The Asia Pacific region is a big contributor to this expansion.

HIGHEST CAGR MARKET IN 2024

Recent Developments of Well Intervention Market

  • In April 2024, SLB launched two artificial lift systems: The Reda Agile compact wide-range electric submersible pump (ESP) system and the rodless Reda PowerEdge. These systems are designed to enhance performance and operating range in oil and gas production operations. The introduction of these advanced technologies demonstrates SLB's commitment to innovation and improving efficiency in the industry.
  • In February 2024, Baker Hughes secured a substantial contract from Petrobras for integrated well construction services in the Buzios field offshore Brazil. The contract involves a significant award for Baker Hughes to provide comprehensive well construction services, emphasizing its continued presence and growth in the Brazilian offshore market.
  • In January 2024, Halliburton introduced the CorrosaLock Cement System to its CCUS portfolio, enhancing CO2 storage infrastructure. The new solution provides corrosion-resistant radial cement sheaths for long-term barrier support, crucial for carbon capture, utilization, and storage initiatives. It comprises a composite of Portland-based cement and Halliburton's proprietary WellLock resin, offering superior resistance to CO2, reduced permeability, and increased elasticity compared to conventional cement systems. This innovation reinforces Halliburton's commitment to advancing sustainable energy solutions.
  • In July 2023, Weatherford secured a long-term five-year contract with Petrobras for intervention services offshore Brazil. This deal underscores Weatherford's commitment to providing essential services in the Brazilian offshore market. The agreement signifies a significant milestone in Weatherford's partnership with Petrobras, highlighting its continued involvement and contribution to the oil and gas industry in the region.

Key Market Players

Want to explore hidden markets that can drive new revenue in Well Intervention Market?

Scope of the Report

Report Metric Details
Market size available for years 2019–2029
Base year considered 2023
Forecast period 2024-2029
Forecast units Value (USD Million/Billion)
Segments Covered Service, Intervention Type, Well Type, Application and Region
Geographies covered Asia Pacific, North America, Europe, Middle East & Africa, and South America


Key Questions Addressed by the Report

What is the current size of the Well Intervention market?
The current market size of the global Well Intervention market is USD 8.93 billion in 2023.
Which is the fastest-growing region during the forecasted period in the Well Intervention market?
North America is emerging as a notably expanding market for well intervention.
Which is the second largest segment by intervention type in the well intervention market during the forecasted period?
Medium Intervention is expected to be the second largest market. Medium well intervention is carried out by using coiled tubing and snubbing units, i.e., hydraulic workover rigs. The snubbing units are used to perform well intervention services at dead or live oil & gas wells in unconventional oilfields. These units are generally preferred at wells that show a higher tendency of kicks.
Which is the largest segment, by service, during the forecasted period in the Well Intervention market?
Logging and bottomhole survey holds the largest market share. Logging is a method of capturing and analyzing a detailed record of the physical, electrical, and chemical properties of a drilled well and its surroundings. Logging tools are inserted into wells to measure the acoustic, electrical, radioactive, and electromagnetic properties of the subsurface formations.
What are the major drivers for the Well Intervention market?
The global Well Intervention market is driven by the growing need to maximize the production potential of mature oil & gas fields.


Personalize This Research

  • Triangulate with your Own Data
  • Get Data as per your Format and Definition
  • Gain a Deeper Dive on a Specific Application, Geography, Customer or Competitor
  • Any level of Personalization
Request A Free Customisation

Let Us Help You

  • What are the Known and Unknown Adjacencies Impacting the Well Intervention Market
  • What will your New Revenue Sources be?
  • Who will be your Top Customer; what will make them switch?
  • Defend your Market Share or Win Competitors
  • Get a Scorecard for Target Partners
Customized Workshop Request

Table of Contents

Exclusive indicates content/data unique to MarketsandMarkets and not available with any competitors.

TITLE
PAGE NO
INTRODUCTION
28
RESEARCH METHODOLOGY
34
EXECUTIVE SUMMARY
51
PREMIUM INSIGHTS
57
MARKET OVERVIEW
61
  • 5.1 INTRODUCTION
  • 5.2 MARKET DYNAMICS
    DRIVERS
    - Growing need to increase production potential of mature oil & gas fields
    - Development of shale reservoirs
    - Increasing demand for oil & gas in Asia Pacific
    RESTRAINTS
    - Strict government regulations pertaining to exploration and production activities
    - Declining oil demand in Europe
    - Volatility in oil prices and decline in upstream capital investments
    OPPORTUNITIES
    - Increasing oil & gas discoveries
    - Digitalization and automation of well intervention solutions
    - Growing demand for offshore and subsea well intervention
    CHALLENGES
    - Complexities associated with well intervention operations in high-pressure, high-temperature (HPHT) environmental conditions
    - Implementation of artificial lift technologies in horizontal wells
  • 5.3 TRENDS/DISRUPTIONS IMPACTING CUSTOMERS’ BUSINESSES
  • 5.4 VALUE CHAIN ANALYSIS
  • 5.5 ECOSYSTEM ANALYSIS
  • 5.6 CASE STUDY ANALYSIS
    PROJECTS IN NORTH SEA AND GULF OF MEXICO ENHANCED WELL INTERVENTION IN OIL & GAS INDUSTRY
    REPOSOL SINOPEC RESOURCES UK LTD REQUESTED EXPRO TO CONDUCT PRODUCT OPTIMIZATION STUDY
    INDEPENDENT WELL OPERATOR IN TEXAS AND OKLAHOMA RESOLVED SUSTAINED CASING PRESSURE PROBLEMS USING SLB’S CEMPRIME SCRUB SPACER AND CEMFIT HEAL SYSTEM
  • 5.7 TECHNOLOGY ANALYSIS
    KEY TECHNOLOGIES
    - Reline mechanical non-slip (MNS)
    - Well integrity management systems
    ADJACENT TECHNOLOGIES
    - Logging and data acquisition
    - Remote monitoring and control
    COMPLIMENTARY TECHNOLOGIES
    - Artificial Intelligence (AI) and Machine Learning (ML)
    - Digital twin
  • 5.8 TRADE ANALYSIS
    EXPORT SCENARIO (HS CODE 730424)
    IMPORT SCENARIO (HS CODE 730424)
    IMPORT SCENARIO (HS CODE 730423)
    EXPORT SCENARIO (HS CODE 730423)
  • 5.9 PATENT ANALYSIS
  • 5.10 KEY CONFERENCES AND EVENTS, 2024–2025
  • 5.11 PRICING ANALYSIS
    AVERAGE SELLING PRICE (ASP) TREND, BY REGION
    INDICATIVE PRICING TREND, BY APPLICATION
  • 5.12 INVESTMENT AND FUNDING SCENARIO
  • 5.13 TARIFF AND REGULATORY LANDSCAPE
    TARIFF ANALYSIS
    REGULATORY BODIES, GOVERNMENT AGENCIES, AND OTHER ORGANIZATIONS
    REGULATORY FRAMEWORK
  • 5.14 PORTER’S FIVE FORCES ANALYSIS
    THREAT OF NEW ENTRANTS
    BARGAINING POWER OF SUPPLIERS
    BARGAINING POWER OF BUYERS
    THREAT OF SUBSTITUTES
    INTENSITY OF COMPETITIVE RIVALRY
  • 5.15 KEY STAKEHOLDERS AND BUYING CRITERIA
    KEY STAKEHOLDERS IN BUYING PROCESS
    BUYING CRITERIA
WELL INTERVENTION MARKET, BY WELL TYPE
99
  • 6.1 INTRODUCTION
  • 6.2 HORIZONTAL WELL
    SHALE DEVELOPMENTS TO BOOST SEGMENTAL GROWTH
  • 6.3 VERTICAL WELL
    INCREASING COUNT OF MATURE CONVENTIONAL FIELDS TO DRIVE MARKET
WELL INTERVENTION MARKET, BY INTERVENTION TYPE
104
  • 7.1 INTRODUCTION
  • 7.2 LIGHT INTERVENTION
    INCREASING DEMAND FOR COILED TUBING SERVICES TO CONDUCT WELL INTERVENTION ACTIVITIES TO DRIVE MARKET
  • 7.3 MEDIUM INTERVENTION
    RISING DEVELOPMENTS IN UNCONVENTIONAL RESERVES WITH SUPPORT OF SNUBBING UNITS TO BOOST MARKET GROWTH
  • 7.4 HEAVY INTERVENTION
    DEVELOPMENTS IN MATURE FIELDS TO DRIVE DEMAND
WELL INTERVENTION MARKET, BY APPLICATION
110
  • 8.1 INTRODUCTION
  • 8.2 ONSHORE
    INCREASING NUMBER OF ONSHORE OIL & GAS AND MATURE FIELDS TO DRIVE DEMAND
  • 8.3 OFFSHORE
    SHALLOW WATER
    - Maturing shallow oilfields in Middle East and Europe to fuel demand
    DEEPWATER
    - Increase in deepwater exploration and production to create growth opportunities for market players
    ULTRA-DEEPWATER
    - Critical environmental conditions in ultra-deepwater locations to drive demand
WELL INTERVENTION MARKET, BY SERVICE
117
  • 9.1 INTRODUCTION
  • 9.2 LOGGING & BOTTOMHOLE SURVEY
    GROWING NEED TO ENHANCE WELL INTERVENTION EFFICIENCY THROUGH ADVANCED LOGGING & BOTTOMHOLE SURVEYS TO DRIVE MARKET
  • 9.3 TUBING/PACKER FAILURE AND REPAIR
    NEED TO MAINTAIN WELL INTEGRITY AND REDUCE DOWNTIME TO DRIVE DEMAND
  • 9.4 STIMULATION
    NEED FOR IMPROVED HYDROCARBON RECOVERY TO BOOST MARKET GROWTH
  • 9.5 REMEDIAL CEMENTING
    NEED TO RESTORE WELLBORE INTEGRITY TO DRIVE DEMAND
  • 9.6 ZONAL ISOLATION
    INCREASING OIL & GAS PRODUCTION FROM MATURE AND HORIZONTAL WELLS TO DRIVE MARKET
  • 9.7 SAND CONTROL
    REDEVELOPMENT OF AGING RESERVOIRS TO CREATE LUCRATIVE OPPORTUNITIES FOR MARKET PLAYERS
  • 9.8 ARTIFICIAL LIFT
    NEED TO ENHANCE FLOW RATES AND MAINTAIN WELL PRODUCTION TO DRIVE DEMAND
  • 9.9 FISHING
    RISING DEMAND FOR EFFICIENCY AND COST-EFFECTIVENESS IN WELL INTERVENTION SERVICES TO DRIVE MARKET
  • 9.10 RE-PERFORATION
    GROWING PRODUCTION FROM MATURE WELLS TO SUPPORT MARKET GROWTH
  • 9.11 OTHERS
WELL INTERVENTION MARKET, BY REGION
134
  • 10.1 INTRODUCTION
  • 10.2 NORTH AMERICA
    IMPACT OF RECESSION ON WELL INTERVENTION MARKET IN NORTH AMERICA
    US
    - Increasing production from mature shale and tight oil reserves to drive demand
    CANADA
    - Potential drilling of oil sands and increase in onshore oil production to boost demand
    MEXICO
    - Increasing investments in enhancing production from aging fields and developing shale resources to drive market
  • 10.3 EUROPE
    IMPACT OF RECESSION ON WELL INTERVENTION MARKET IN EUROPE
    RUSSIA
    - Increasing exploration and production activities to drive market
    NORWAY
    - Rapidly depleting mature oil & gas fields and increase in exploration activities in Norwegian Continental Shelf (NCS) to fuel demand
    UK
    - Maximizing production potential in brownfields to fuel market growth
    DENMARK
    - Redevelopment of mature offshore fields to drive market
    REST OF EUROPE
  • 10.4 ASIA PACIFIC
    IMPACT OF RECESSION ON WELL INTERVENTION MARKET IN ASIA PACIFIC
    CHINA
    - Increasing exploration and production from unconventional resources to fuel market growth
    INDIA
    - Redevelopment of legacy oilfields and government initiatives to improve exploration activities to drive market
    AUSTRALIA
    - Development of unconventional shale resources and focus on redeveloping mature fields to create growth opportunities for market players
    INDONESIA
    - Steep decline in production from mature fields to fuel demand
    MALAYSIA
    - Increasing capital expenditure on exploration and drilling activities to boost market growth
    REST OF ASIA PACIFIC
  • 10.5 AFRICA
    IMPACT OF RECESSION ON WELL INTERVENTION MARKET IN AFRICA
    NIGERIA
    - Rise in exploration activities and developments in mature oil & gas fields to boost market growth
    ALGERIA
    - Initiatives to increase exploration activities to support market growth
    ANGOLA
    - Government-led incentives and initiatives to develop oil reserves to drive demand
    REST OF AFRICA
  • 10.6 MIDDLE EAST
    IMPACT OF RECESSION ON WELL INTERVENTION MARKET IN MIDDLE EAST
    GCC
    - Saudi Arabia
    - UAE
    - Rest of GCC
    IRAQ
    - Increasing onshore well drilling activities to create growth opportunities for market players
    IRAN
    - Large oil reserves and high oil exploration to drive market
    REST OF MIDDLE EAST
  • 10.7 SOUTH & CENTRAL AMERICA
    BRAZIL
    - Increasing offshore exploration and production activities to boost market growth
    VENEZUELA
    - Government-led initiates to revitalize oil production activities to fuel demand
    ARGENTINA
    - Shale developments to create potential demand
    REST OF SOUTH & CENTRAL AMERICA
COMPETITIVE LANDSCAPE
197
  • 11.1 OVERVIEW
  • 11.2 KEY PLAYER STRATEGIES/RIGHT TO WIN, 2020–2024
  • 11.3 MARKET SHARE ANALYSIS, 2023
  • 11.4 MARKET EVALUATION FRAMEWORK
  • 11.5 REVENUE ANALYSIS, 2019–2023
  • 11.6 COMPANY VALUATION AND FINANCIAL METRICS
  • 11.7 BRAND/PRODUCT COMPARISON
  • 11.8 COMPANY EVALUATION MATRIX: KEY PLAYERS, 2023
    STARS
    PERVASIVE PLAYERS
    EMERGING LEADERS
    PARTICIPANTS
    COMPANY FOOTPRINT: KEY PLAYERS, 2023
    - Company footprint
    - Region footprint
    - Service footprint
    - Application footprint
    - Intervention type footprint
  • 11.9 COMPANY EVALUATION MATRIX: STARTUPS/SMES, 2023
    PROGRESSIVE COMPANIES
    RESPONSIVE COMPANIES
    DYNAMIC COMPANIES
    STARTING BLOCKS
    COMPETITIVE BENCHMARKING: STARTUPS/SMES, 2023
    - Detailed list of key startups/SMEs
    - Competitive benchmarking of key startups/SMEs
  • 11.10 COMPETITIVE SCENARIOS AND TRENDS
    PRODUCT LAUNCHES
    DEALS
    OTHERS
COMPANY PROFILES
221
  • 12.1 KEY PLAYERS
    SLB
    - Business overview
    - Products/Services/Solutions offered
    - Recent developments
    - MnM view
    HALLIBURTON
    - Business overview
    - Products/Services/Solutions offered
    - Recent developments
    - MnM view
    BAKER HUGHES
    - Business overview
    - Products/Services/Solutions offered
    - Recent developments
    - MnM view
    WEATHERFORD
    - Business overview
    - Products/Services/Solutions offered
    - Recent developments
    - MnM view
    ARCHER
    - Business overview
    - Products/Services/Solutions offered
    - Recent developments
    - MnM view
    EXPRO GROUP
    - Business overview
    - Products/Services/Solutions offered
    - Recent developments
    TRICAN.
    - Business overview
    - Products/Services/Solutions offered
    PATTERSON-UTI
    - Business overview
    - Products/Services/Solutions offered
    - Recent developments
    NINE ENERGY SERVICE
    - Business overview
    - Products/Services/Solutions offered
    - Recent developments
    KEY ENERGY SERVICES
    - Business overview
    - Products/Services/Solutions offered
    - Recent developments
    FORUM ENERGY TECHNOLOGIES, INC.
    - Business overview
    - Products/Services/Solutions offered
    - Recent developments
    OCEANEERING INTERNATIONAL, INC.
    - Business overview
    - Products/Services/Solutions offered
    - Recent developments
    INTERVENTEK SUBSEA ENGINEERING
    - Business overview
    - Products/Services/Solutions offered
    - Recent developments
    AJ LUCAS GROUP
    - Business overview
    - Products/Services/Solutions offered
    - Recent developments
    CHINA OILFIELD SERVICES LIMITED
    - Business overview
    - Products/Services/Solutions offered
    - Recent developments
  • 12.2 OTHER PLAYERS
    OILSERV
    AKOFS OFFSHORE
    TAQA KSA
    WELLTEC
    HUNTING PLC
    HELIX ENERGY
    NOV
    SUPERIOR ENERGY SERVICES
    STEP ENERGY SERVICES
    PROWELL ENERGY
APPENDIX
306
  • 13.1 INSIGHTS FROM INDUSTRY EXPERTS
  • 13.2 DISCUSSION GUIDE
  • 13.3 KNOWLEDGESTORE: MARKETSANDMARKETS’ SUBSCRIPTION PORTAL
  • 13.4 CUSTOMIZATION OPTIONS
  • 13.5 RELATED REPORTS
  • 13.6 AUTHOR DETAILS
LIST OF TABLES
 
  • TABLE 1 WELL INTERVENTION MARKET: INCLUSIONS AND EXCLUSIONS, BY SERVICE
  • TABLE 2 WELL INTERVENTION MARKET: INCLUSIONS AND EXCLUSIONS, BY INTERVENTION TYPE
  • TABLE 3 WELL INTERVENTION MARKET: INCLUSIONS AND EXCLUSIONS, BY WELL TYPE
  • TABLE 4 WELL INTERVENTION MARKET: INCLUSIONS AND EXCLUSIONS, BY APPLICATION
  • TABLE 5 WELL INTERVENTION MARKET: INCLUSIONS AND EXCLUSIONS, BY REGION
  • TABLE 6 DEMAND FOR WELL INTERVENTION SERVICES: NEW VS. OLD WELLS
  • TABLE 7 COST & FREQUENCY OF WELLS IN DIFFERENT REGIONS GOING FOR WELL INTERVENTION
  • TABLE 8 WELL INTERVENTION MARKET SNAPSHOT
  • TABLE 9 NATURAL GAS AND CRUDE OIL PRODUCTION, BY REGION, 2022
  • TABLE 10 ROLE OF COMPANIES IN WELL INTERVENTION ECOSYSTEM
  • TABLE 11 EXPORT DATA RELATED TO HS CODE 730424-COMPLIANT PRODUCTS, BY REGION/COUNTRY, 2020–2022 (USD THOUSAND)
  • TABLE 12 IMPORT DATA RELATED TO HS CODE 730424-COMPLIANT PRODUCTS, BY REGION/COUNTRY, 2020–2022 (USD THOUSAND)
  • TABLE 13 IMPORT DATA RELATED TO HS CODE 730423-COMPLIANT PRODUCTS, BY REGION/COUNTRY, 2020–2022 (USD THOUSAND)
  • TABLE 14 EXPORT DATA RELATED TO HS CODE 730423-COMPLIANT PRODUCTS, BY REGION/COUNTRY, 2020–2022 (USD THOUSAND)
  • TABLE 15 WELL INTERVENTION MARKET: LIST OF MAJOR PATENTS RELATED TO WELL INTERVENTION SOLUTIONS, 2020–2024
  • TABLE 16 WELL INTERVENTION MARKET: LIST OF KEY CONFERENCES AND EVENTS, 2024–2025
  • TABLE 17 AVERAGE SELLING PRICE (ASP) TREND OF WELL INTERVENTION SERVICES, BY REGION, 2021–2029 (USD THOUSAND)
  • TABLE 18 INDICATIVE PRICING TREND OF WELL INTERVENTION SERVICES, BY APPLICATION, 2023 (USD THOUSAND)
  • TABLE 19 WEATHERFORD: FUNDING DETAILS
  • TABLE 20 ARCHER: FUNDING DETAILS
  • TABLE 21 KEY ENERGY SERVICES: FUNDING DETAILS
  • TABLE 22 PIONEER ENERGY: FUNDING DETAILS
  • TABLE 23 MFN TARIFF RELATED TO HS CODE 845921-COMPLIANT PRODUCTS, BY COUNTRY, 2022
  • TABLE 24 NORTH AMERICA: REGULATORY BODIES, GOVERNMENT AGENCIES, AND OTHER ORGANIZATIONS
  • TABLE 25 EUROPE: REGULATORY BODIES, GOVERNMENT AGENCIES, AND OTHER ORGANIZATIONS
  • TABLE 26 ASIA PACIFIC: REGULATORY BODIES, GOVERNMENT AGENCIES, AND OTHER ORGANIZATIONS
  • TABLE 27 ROW: REGULATORY BODIES, GOVERNMENT AGENCIES, AND OTHER ORGANIZATIONS
  • TABLE 28 AFRICA: LIST OF REGULATORY BODIES, GOVERNMENT AGENCIES, AND OTHER ORGANIZATIONS
  • TABLE 29 SOUTH & CENTRAL AMERICA: LIST OF REGULATORY BODIES, GOVERNMENT AGENCIES, AND OTHER ORGANIZATIONS
  • TABLE 30 WELL INTERVENTION MARKET: REGULATORY FRAMEWORK
  • TABLE 31 WELL INTERVENTION MARKET: PORTER’S FIVE FORCES ANALYSIS
  • TABLE 32 INFLUENCE OF STAKEHOLDERS ON BUYING PROCESS, BY APPLICATION (%)
  • TABLE 33 KEY BUYING CRITERIA, BY APPLICATION
  • TABLE 34 WELL INTERVENTION MARKET, BY WELL TYPE, 2019–2022 (USD MILLION)
  • TABLE 35 WELL INTERVENTION MARKET, BY WELL TYPE, 2023–2029 (USD MILLION)
  • TABLE 36 HORIZONTAL WELL: WELL INTERVENTION MARKET, BY REGION, 2019–2022 (USD MILLION)
  • TABLE 37 HORIZONTAL WELL: WELL INTERVENTION MARKET, BY REGION, 2023–2029 (USD MILLION)
  • TABLE 38 VERTICAL WELL: WELL INTERVENTION MARKET, BY REGION, 2019–2022 (USD MILLION)
  • TABLE 39 VERTICAL WELL: WELL INTERVENTION MARKET, BY REGION, 2023–2029 (USD MILLION)
  • TABLE 40 WELL INTERVENTION MARKET, BY INTERVENTION TYPE, 2019–2022 (USD MILLION)
  • TABLE 41 WELL INTERVENTION MARKET, BY INTERVENTION TYPE, 2023–2029 (USD MILLION)
  • TABLE 42 LIGHT INTERVENTION: WELL INTERVENTION MARKET, BY REGION, 2019–2022 (USD MILLION)
  • TABLE 43 LIGHT INTERVENTION: WELL INTERVENTION MARKET, BY REGION, 2023–2029 (USD MILLION)
  • TABLE 44 MEDIUM INTERVENTION: WELL INTERVENTION MARKET, BY REGION, 2019–2022 (USD MILLION)
  • TABLE 45 MEDIUM INTERVENTION: WELL INTERVENTION MARKET, BY REGION, 2023–2029 (USD MILLION)
  • TABLE 46 HEAVY INTERVENTION: WELL INTERVENTION MARKET, BY REGION, 2019–2022 (USD MILLION)
  • TABLE 47 HEAVY INTERVENTION: WELL INTERVENTION MARKET, BY REGION, 2023–2029 (USD MILLION)
  • TABLE 48 WELL INTERVENTION MARKET, BY APPLICATION, 2019–2022 (USD MILLION)
  • TABLE 49 WELL INTERVENTION MARKET, BY APPLICATION, 2023–2029 (USD MILLION)
  • TABLE 50 ONSHORE: WELL INTERVENTION MARKET, BY REGION, 2019–2022 (USD MILLION)
  • TABLE 51 ONSHORE: WELL INTERVENTION MARKET, BY REGION, 2023–2029 (USD MILLION)
  • TABLE 52 OFFSHORE: WELL INTERVENTION MARKET, BY REGION, 2019–2022 (USD MILLION)
  • TABLE 53 OFFSHORE: WELL INTERVENTION MARKET, BY REGION, 2023–2029 (USD MILLION)
  • TABLE 54 OFFSHORE: WELL INTERVENTION MARKET, BY DEPTH, 2019–2022 (USD MILLION)
  • TABLE 55 OFFSHORE: WELL INTERVENTION MARKET, BY DEPTH, 2023–2029 (USD MILLION)
  • TABLE 56 WELL INTERVENTION MARKET, BY SERVICE, 2019–2022 (USD MILLION)
  • TABLE 57 WELL INTERVENTION MARKET, BY SERVICE, 2023–2029 (USD MILLION)
  • TABLE 58 LOGGING & BOTTOMHOLE SURVEY: WELL INTERVENTION MARKET, BY REGION, 2019–2022 (USD MILLION)
  • TABLE 59 LOGGING & BOTTOMHOLE SURVEY: WELL INTERVENTION MARKET, BY REGION, 2023–2029 (USD MILLION)
  • TABLE 60 TUBING/PACKER FAILURE AND REPAIR: WELL INTERVENTION MARKET, BY REGION, 2019–2022 (USD MILLION)
  • TABLE 61 TUBING/PACKER FAILURE AND REPAIR: WELL INTERVENTION MARKET, BY REGION, 2023–2029 (USD MILLION)
  • TABLE 62 STIMULATION: WELL INTERVENTION MARKET, BY REGION, 2019–2022 (USD MILLION)
  • TABLE 63 STIMULATION: WELL INTERVENTION MARKET, BY REGION, 2023–2029 (USD MILLION)
  • TABLE 64 REMEDIAL CEMENTING: WELL INTERVENTION MARKET, BY REGION, 2019–2022 (USD MILLION)
  • TABLE 65 REMEDIAL CEMENTING: WELL INTERVENTION MARKET, BY REGION, 2023–2029 (USD MILLION)
  • TABLE 66 ZONAL ISOLATION: WELL INTERVENTION MARKET, BY REGION, 2019–2022 (USD MILLION)
  • TABLE 67 ZONAL ISOLATION: WELL INTERVENTION MARKET, BY REGION, 2023–2029 (USD MILLION)
  • TABLE 68 SAND CONTROL: WELL INTERVENTION MARKET, BY REGION, 2019–2022 (USD MILLION)
  • TABLE 69 SAND CONTROL: WELL INTERVENTION MARKET, BY REGION, 2023–2029 (USD MILLION)
  • TABLE 70 ARTIFICIAL LIFT: WELL INTERVENTION MARKET, BY REGION, 2019–2022 (USD MILLION)
  • TABLE 71 ARTIFICIAL LIFT: WELL INTERVENTION MARKET, BY REGION, 2023–2029 (USD MILLION)
  • TABLE 72 FISHING: WELL INTERVENTION MARKET, BY REGION, 2019–2022 (USD MILLION)
  • TABLE 73 FISHING: WELL INTERVENTION MARKET, BY REGION, 2023–2029 (USD MILLION)
  • TABLE 74 RE-PERFORATION: WELL INTERVENTION MARKET, BY REGION, 2019–2022 (USD MILLION)
  • TABLE 75 RE-PERFORATION: WELL INTERVENTION MARKET, BY REGION, 2023–2029 (USD MILLION)
  • TABLE 76 OTHERS: WELL INTERVENTION MARKET, BY REGION, 2019–2022 (USD MILLION)
  • TABLE 77 OTHERS: WELL INTERVENTION MARKET, BY REGION, 2023–2029 (USD MILLION)
  • TABLE 78 WELL INTERVENTION MARKET, BY REGION, 2019–2022 (USD MILLION)
  • TABLE 79 WELL INTERVENTION MARKET, BY REGION, 2023–2029 (USD MILLION)
  • TABLE 80 NORTH AMERICA: WELL INTERVENTION MARKET, BY SERVICE, 2019–2022 (USD MILLION)
  • TABLE 81 NORTH AMERICA: WELL INTERVENTION MARKET, BY SERVICE, 2023–2029 (USD MILLION)
  • TABLE 82 NORTH AMERICA: WELL INTERVENTION MARKET, BY INTERVENTION TYPE, 2019–2022 (USD MILLION)
  • TABLE 83 NORTH AMERICA: WELL INTERVENTION MARKET, BY INTERVENTION TYPE, 2023–2029 (USD MILLION)
  • TABLE 84 NORTH AMERICA: WELL INTERVENTION MARKET, BY WELL TYPE, 2019–2022 (USD MILLION)
  • TABLE 85 NORTH AMERICA: WELL INTERVENTION MARKET, BY WELL TYPE, 2023–2029 (USD MILLION)
  • TABLE 86 NORTH AMERICA: WELL INTERVENTION MARKET, BY APPLICATION, 2019–2022 (USD MILLION)
  • TABLE 87 NORTH AMERICA: WELL INTERVENTION MARKET, BY APPLICATION, 2023–2029 (USD MILLION)
  • TABLE 88 NORTH AMERICA: WELL INTERVENTION MARKET, BY COUNTRY, 2019–2022 (USD MILLION)
  • TABLE 89 NORTH AMERICA: WELL INTERVENTION MARKET, BY COUNTRY, 2023–2029 (USD MILLION)
  • TABLE 90 US: WELL INTERVENTION MARKET, BY APPLICATION, 2019–2022 (USD MILLION)
  • TABLE 91 US: WELL INTERVENTION MARKET, BY APPLICATION, 2023–2029 (USD MILLION)
  • TABLE 92 CANADA: WELL INTERVENTION MARKET, BY APPLICATION, 2019–2022 (USD MILLION)
  • TABLE 93 CANADA: WELL INTERVENTION MARKET, BY APPLICATION, 2023–2029 (USD MILLION)
  • TABLE 94 MEXICO: WELL INTERVENTION MARKET, BY APPLICATION, 2019–2022 (USD MILLION)
  • TABLE 95 MEXICO: WELL INTERVENTION MARKET, BY APPLICATION, 2023–2029 (USD MILLION)
  • TABLE 96 EUROPE: WELL INTERVENTION MARKET, BY SERVICE, 2019–2022 (USD MILLION)
  • TABLE 97 EUROPE: WELL INTERVENTION MARKET, BY SERVICE, 2023–2029 (USD MILLION)
  • TABLE 98 EUROPE: WELL INTERVENTION MARKET, BY INTERVENTION TYPE, 2019–2022 (USD MILLION)
  • TABLE 99 EUROPE: WELL INTERVENTION MARKET, BY INTERVENTION TYPE, 2023–2029 (USD MILLION)
  • TABLE 100 EUROPE: WELL INTERVENTION MARKET, BY WELL TYPE, 2019–2022 (USD MILLION)
  • TABLE 101 EUROPE: WELL INTERVENTION MARKET, BY WELL TYPE, 2023–2029 (USD MILLION)
  • TABLE 102 EUROPE: WELL INTERVENTION MARKET, BY APPLICATION, 2019–2022 (USD MILLION)
  • TABLE 103 EUROPE: WELL INTERVENTION MARKET, BY APPLICATION, 2023–2029 (USD MILLION)
  • TABLE 104 EUROPE: WELL INTERVENTION MARKET, BY COUNTRY, 2019–2022 (USD MILLION)
  • TABLE 105 EUROPE WELL INTERVENTION MARKET, BY COUNTRY, 2023–2029 (USD MILLION)
  • TABLE 106 RUSSIA: WELL INTERVENTION MARKET, BY APPLICATION, 2019–2022 (USD MILLION)
  • TABLE 107 RUSSIA: WELL INTERVENTION MARKET, BY APPLICATION, 2023–2029 (USD MILLION)
  • TABLE 108 NORWAY: WELL INTERVENTION MARKET, BY APPLICATION, 2019–2022 (USD MILLION)
  • TABLE 109 NORWAY: WELL INTERVENTION MARKET, BY APPLICATION, 2023–2029 (USD MILLION)
  • TABLE 110 UK: WELL INTERVENTION MARKET, BY APPLICATION, 2019–2022 (USD MILLION)
  • TABLE 111 UK: WELL INTERVENTION MARKET, BY APPLICATION, 2023–2029 (USD MILLION)
  • TABLE 112 DENMARK: WELL INTERVENTION MARKET, BY APPLICATION, 2019–2022 (USD MILLION)
  • TABLE 113 DENMARK: WELL INTERVENTION MARKET, BY APPLICATION, 2023–2029 (USD MILLION)
  • TABLE 114 REST OF EUROPE: WELL INTERVENTION MARKET, BY APPLICATION, 2019–2022 (USD MILLION)
  • TABLE 115 REST OF EUROPE: WELL INTERVENTION MARKET, BY APPLICATION, 2023–2029 (USD MILLION)
  • TABLE 116 ASIA PACIFIC: WELL INTERVENTION MARKET, BY SERVICE, 2019–2022 (USD MILLION)
  • TABLE 117 ASIA PACIFIC: WELL INTERVENTION MARKET, BY SERVICE, 2023–2029 (USD MILLION)
  • TABLE 118 ASIA PACIFIC: WELL INTERVENTION MARKET, BY INTERVENTION TYPE, 2019–2022 (USD MILLION)
  • TABLE 119 ASIA PACIFIC: WELL INTERVENTION MARKET, BY INTERVENTION TYPE, 2023–2029 (USD MILLION)
  • TABLE 120 ASIA PACIFIC: WELL INTERVENTION MARKET, BY WELL TYPE, 2019–2022 (USD MILLION)
  • TABLE 121 ASIA PACIFIC: WELL INTERVENTION MARKET, BY WELL TYPE, 2023–2029 (USD MILLION)
  • TABLE 122 ASIA PACIFIC: WELL INTERVENTION MARKET, BY APPLICATION, 2019–2022 (USD MILLION)
  • TABLE 123 ASIA PACIFIC: WELL INTERVENTION MARKET, BY APPLICATION, 2023–2029 (USD MILLION)
  • TABLE 124 ASIA PACIFIC: WELL INTERVENTION MARKET, BY COUNTRY, 2019–2022 (USD MILLION)
  • TABLE 125 ASIA PACIFIC: WELL INTERVENTION MARKET, BY COUNTRY, 2023–2029 (USD MILLION)
  • TABLE 126 CHINA: WELL INTERVENTION MARKET, BY APPLICATION, 2019–2022 (USD MILLION)
  • TABLE 127 CHINA: WELL INTERVENTION MARKET, BY APPLICATION, 2023–2029 (USD MILLION)
  • TABLE 128 INDIA: WELL INTERVENTION MARKET, BY APPLICATION, 2019–2022 (USD MILLION)
  • TABLE 129 INDIA: WELL INTERVENTION MARKET, BY APPLICATION, 2023–2029 (USD MILLION)
  • TABLE 130 AUSTRALIA: WELL INTERVENTION MARKET, BY APPLICATION, 2019–2022 (USD MILLION)
  • TABLE 131 AUSTRALIA: WELL INTERVENTION MARKET, BY APPLICATION, 2023–2029 (USD MILLION)
  • TABLE 132 INDONESIA: WELL INTERVENTION MARKET, BY APPLICATION, 2019–2022 (USD MILLION)
  • TABLE 133 INDONESIA: WELL INTERVENTION MARKET, BY APPLICATION, 2023–2029 (USD MILLION)
  • TABLE 134 MALAYSIA: WELL INTERVENTION MARKET, BY APPLICATION, 2019–2022 (USD MILLION)
  • TABLE 135 MALAYSIA: WELL INTERVENTION MARKET, BY APPLICATION, 2023–2029 (USD MILLION)
  • TABLE 136 REST OF ASIA PACIFIC: WELL INTERVENTION MARKET, BY APPLICATION, 2019–2022 (USD MILLION)
  • TABLE 137 REST OF ASIA PACIFIC: WELL INTERVENTION MARKET, BY APPLICATION, 2023–2029 (USD MILLION)
  • TABLE 138 AFRICA: WELL INTERVENTION MARKET, BY SERVICE, 2019–2022 (USD MILLION)
  • TABLE 139 AFRICA: WELL INTERVENTION MARKET, BY SERVICE, 2023–2029 (USD MILLION)
  • TABLE 140 AFRICA: WELL INTERVENTION MARKET, BY INTERVENTION TYPE, 2019–2022 (USD MILLION)
  • TABLE 141 AFRICA: WELL INTERVENTION MARKET, BY INTERVENTION TYPE, 2023–2029 (USD MILLION)
  • TABLE 142 AFRICA: WELL INTERVENTION MARKET, BY WELL TYPE, 2019–2022 (USD MILLION)
  • TABLE 143 AFRICA: WELL INTERVENTION MARKET, BY WELL TYPE, 2023–2029 (USD MILLION)
  • TABLE 144 AFRICA: WELL INTERVENTION MARKET, BY APPLICATION, 2019–2022 (USD MILLION)
  • TABLE 145 AFRICA: WELL INTERVENTION MARKET, BY APPLICATION, 2023–2029 (USD MILLION)
  • TABLE 146 AFRICA: WELL INTERVENTION MARKET, BY COUNTRY, 2019–2022 (USD MILLION)
  • TABLE 147 AFRICA: WELL INTERVENTION MARKET, BY COUNTRY, 2023–2029 (USD MILLION)
  • TABLE 148 NIGERIA: WELL INTERVENTION MARKET, BY APPLICATION, 2019–2022 (USD MILLION)
  • TABLE 149 NIGERIA: WELL INTERVENTION MARKET, BY APPLICATION, 2023–2029 (USD MILLION)
  • TABLE 150 ALGERIA: WELL INTERVENTION MARKET, BY APPLICATION, 2019–2022 (USD MILLION)
  • TABLE 151 ALGERIA: WELL INTERVENTION MARKET, BY APPLICATION, 2023–2029 (USD MILLION)
  • TABLE 152 ANGOLA: WELL INTERVENTION MARKET, BY APPLICATION, 2019–2022 (USD MILLION)
  • TABLE 153 ANGOLA: WELL INTERVENTION MARKET, BY APPLICATION, 2023–2029 (USD MILLION)
  • TABLE 154 REST OF AFRICA: WELL INTERVENTION MARKET, BY APPLICATION, 2019–2022 (USD MILLION)
  • TABLE 155 REST OF AFRICA: WELL INTERVENTION MARKET, BY APPLICATION, 2023–2029 (USD MILLION)
  • TABLE 156 MIDDLE EAST: WELL INTERVENTION MARKET, BY SERVICE, 2019–2022 (USD MILLION)
  • TABLE 157 MIDDLE EAST: WELL INTERVENTION MARKET, BY SERVICE, 2023–2029 (USD MILLION)
  • TABLE 158 MIDDLE EAST: WELL INTERVENTION MARKET, BY INTERVENTION TYPE, 2019–2022 (USD MILLION)
  • TABLE 159 MIDDLE EAST: WELL INTERVENTION MARKET, BY INTERVENTION TYPE, 2023–2029 (USD MILLION)
  • TABLE 160 MIDDLE EAST: WELL INTERVENTION MARKET, BY WELL TYPE, 2019–2022 (USD MILLION)
  • TABLE 161 MIDDLE EAST: WELL INTERVENTION MARKET, BY WELL TYPE, 2023–2029 (USD MILLION)
  • TABLE 162 MIDDLE EAST: WELL INTERVENTION MARKET, BY APPLICATION, 2019–2022 (USD MILLION)
  • TABLE 163 MIDDLE EAST: WELL INTERVENTION MARKET, BY APPLICATION, 2023–2029 (USD MILLION)
  • TABLE 164 MIDDLE EAST: WELL INTERVENTION MARKET, BY COUNTRY, 2019–2022 (USD MILLION)
  • TABLE 165 MIDDLE EAST: WELL INTERVENTION MARKET, BY COUNTRY, 2023–2029 (USD MILLION)
  • TABLE 166 GCC: WELL INTERVENTION MARKET SIZE, BY APPLICATION, 2019–2022 (USD MILLION)
  • TABLE 167 GCC: WELL INTERVENTION MARKET, BY APPLICATION, 2023–2029 (USD MILLION)
  • TABLE 168 GCC: WELL INTERVENTION MARKET SIZE, BY COUNTRY, 2019–2022 (USD MILLION)
  • TABLE 169 GCC: WELL INTERVENTION MARKET, BY COUNTRY, 2023–2029 (USD MILLION)
  • TABLE 170 SAUDI ARABIA: WELL INTERVENTION MARKET, BY APPLICATION, 2019–2022 (USD MILLION)
  • TABLE 171 SAUDI ARABIA: WELL INTERVENTION MARKET, BY APPLICATION, 2023–2029 (USD MILLION)
  • TABLE 172 UAE: WELL INTERVENTION MARKET, BY APPLICATION, 2019–2022 (USD MILLION)
  • TABLE 173 UAE: WELL INTERVENTION MARKET, BY APPLICATION, 2023–2029 (USD MILLION)
  • TABLE 174 REST OF GCC: HIGH-VOLTAGE POWER TRANSFORMER MARKET, BY APPLICATION, 2019–2022 (USD MILLION)
  • TABLE 175 REST OF GCC: HIGH-VOLTAGE POWER TRANSFORMER MARKET, BY APPLICATION, 2023–2029 (USD MILLION)
  • TABLE 176 IRAQ: WELL INTERVENTION MARKET, BY APPLICATION, 2019–2022 (USD MILLION)
  • TABLE 177 IRAQ: WELL INTERVENTION MARKET, BY APPLICATION, 2023–2029 (USD MILLION)
  • TABLE 178 IRAN: WELL INTERVENTION MARKET, BY APPLICATION, 2019–2022 (USD MILLION)
  • TABLE 179 IRAN: WELL INTERVENTION MARKET, BY APPLICATION, 2023–2029 (USD MILLION)
  • TABLE 180 REST OF MIDDLE EAST: WELL INTERVENTION MARKET, BY APPLICATION, 2019–2022 (USD MILLION)
  • TABLE 181 REST OF MIDDLE EAST: WELL INTERVENTION MARKET, BY APPLICATION, 2023–2029 (USD MILLION)
  • TABLE 182 SOUTH & CENTRAL AMERICA: WELL INTERVENTION MARKET, BY SERVICE, 2019–2022 (USD MILLION)
  • TABLE 183 SOUTH & CENTRAL AMERICA: WELL INTERVENTION MARKET, BY SERVICE, 2023–2029 (USD MILLION)
  • TABLE 184 SOUTH & CENTRAL AMERICA: WELL INTERVENTION MARKET, BY INTERVENTION TYPE, 2019–2022 (USD MILLION)
  • TABLE 185 SOUTH & CENTRAL AMERICA: WELL INTERVENTION MARKET, BY INTERVENTION TYPE, 2023–2029 (USD MILLION)
  • TABLE 186 SOUTH & CENTRAL AMERICA: WELL INTERVENTION MARKET, BY WELL TYPE, 2019–2022 (USD MILLION)
  • TABLE 187 SOUTH & CENTRAL AMERICA: WELL INTERVENTION MARKET, BY WELL TYPE, 2023–2029 (USD MILLION)
  • TABLE 188 SOUTH & CENTRAL AMERICA: WELL INTERVENTION MARKET, BY APPLICATION, 2019–2022 (USD MILLION)
  • TABLE 189 SOUTH & CENTRAL AMERICA: WELL INTERVENTION MARKET, BY APPLICATION, 2023–2029 (USD MILLION)
  • TABLE 190 SOUTH & CENTRAL AMERICA: WELL INTERVENTION MARKET, BY COUNTRY, 2019–2022 (USD MILLION)
  • TABLE 191 SOUTH & CENTRAL AMERICA: WELL INTERVENTION MARKET, BY COUNTRY, 2023–2029 (USD MILLION)
  • TABLE 192 BRAZIL: WELL INTERVENTION MARKET, BY APPLICATION, 2019–2022 (USD MILLION)
  • TABLE 193 BRAZIL: WELL INTERVENTION MARKET, BY APPLICATION, 2023–2029 (USD MILLION)
  • TABLE 194 VENEZUELA: WELL INTERVENTION MARKET, BY APPLICATION, 2019–2022 (USD MILLION)
  • TABLE 195 VENEZUELA: WELL INTERVENTION MARKET, BY APPLICATION, 2023–2029 (USD MILLION)
  • TABLE 196 ARGENTINA: WELL INTERVENTION MARKET, BY APPLICATION, 2019–2022 (USD MILLION)
  • TABLE 197 ARGENTINA: WELL INTERVENTION MARKET, BY APPLICATION, 2023–2029 (USD MILLION)
  • TABLE 198 REST OF SOUTH & CENTRAL AMERICA: WELL INTERVENTION MARKET, BY APPLICATION, 2019–2022 (USD MILLION)
  • TABLE 199 REST OF SOUTH & CENTRAL AMERICA: WELL INTERVENTION MARKET, BY APPLICATION, 2023–2029 (USD MILLION)
  • TABLE 200 WELL INTERVENTION MARKET: OVERVIEW OF KEY STRATEGIES DEPLOYED BY TOP PLAYERS, JANUARY 2020–MAY 2024
  • TABLE 201 WELL INTERVENTION MARKET: DEGREE OF COMPETITION, 2023
  • TABLE 202 MARKET EVALUATION FRAMEWORK, 2020–2024
  • TABLE 203 WELL INTERVENTION MARKET: REGION FOOTPRINT
  • TABLE 204 WELL INTERVENTION MARKET: SERVICE FOOTPRINT
  • TABLE 205 WELL INTERVENTION MARKET: APPLICATION FOOTPRINT
  • TABLE 206 WELL INTERVENTION MARKET: INTERVENTION TYPE FOOTPRINT
  • TABLE 207 WELL INTERVENTION MARKET: LIST OF KEY STARTUPS/SMES
  • TABLE 208 WELL INTERVENTION MARKET: COMPETITIVE BENCHMARKING OF KEY STARTUPS/SMES
  • TABLE 209 WELL INTERVENTION MARKET: PRODUCT LAUNCHES, JANUARY 2020–MAY 2024
  • TABLE 210 WELL INTERVENTION MARKET: DEALS, JANUARY 2020–MAY 2024
  • TABLE 211 WELL INTERVENTION MARKET: OTHERS, JANUARY 2020–MAY 2024
  • TABLE 212 SLB: COMPANY OVERVIEW
  • TABLE 213 SLB: PRODUCTS/SERVICES/SOLUTIONS OFFERED
  • TABLE 214 SLB: PRODUCT LAUNCHES
  • TABLE 215 SLB: DEALS
  • TABLE 216 SLB: EXPANSIONS
  • TABLE 217 SLB: OTHERS
  • TABLE 218 HALLIBURTON: COMPANY OVERVIEW
  • TABLE 219 HALLIBURTON: PRODUCTS/SERVICES/SOLUTIONS OFFERED
  • TABLE 220 HALLIBURTON: PRODUCT LAUNCHES
  • TABLE 221 HALLIBURTON: DEALS
  • TABLE 222 HALLIBURTON: OTHERS
  • TABLE 223 BAKER HUGHES: COMPANY OVERVIEW
  • TABLE 224 BAKER HUGHES: PRODUCTS/SERVICES/SOLUTIONS OFFERED
  • TABLE 225 BAKER HUGHES: PRODUCT LAUNCHES
  • TABLE 226 BAKER HUGHES: DEALS
  • TABLE 227 BAKER HUGHES: OTHERS
  • TABLE 228 WEATHERFORD: COMPANY OVERVIEW
  • TABLE 229 WEATHERFORD: PRODUCTS/SERVICES/SOLUTIONS OFFERED
  • TABLE 230 WEATHERFORD: PRODUCT LAUNCHES
  • TABLE 231 WEATHERFORD: DEALS
  • TABLE 232 WEATHERFORD: OTHERS
  • TABLE 233 ARCHER: COMPANY OVERVIEW
  • TABLE 234 ARCHER: PRODUCTS/SERVICES/SOLUTIONS OFFERED
  • TABLE 235 ARCHER: DEALS
  • TABLE 236 ARCHER: OTHERS
  • TABLE 237 EXPRO GROUP: COMPANY OVERVIEW
  • TABLE 238 EXPRO GROUP: PRODUCTS/SERVICES/SOLUTIONS OFFERED
  • TABLE 239 EXPRO GROUP: DEALS
  • TABLE 240 EXPRO GROUP: OTHERS
  • TABLE 241 TRICAN.: COMPANY OVERVIEW
  • TABLE 242 TRICAN.: PRODUCTS/SERVICES/SOLUTIONS OFFERED
  • TABLE 243 PATTERSON-UTI: COMPANY OVERVIEW
  • TABLE 244 PATTERSON-UTI: PRODUCTS/SERVICES/SOLUTIONS OFFERED
  • TABLE 245 PATTERSON-UTI: DEALS
  • TABLE 246 NINE ENERGY SERVICE: COMPANY OVERVIEW
  • TABLE 247 NINE ENERGY SERVICE: PRODUCTS/SERVICES/SOLUTIONS OFFERED
  • TABLE 248 NINE ENERGY SERVICE: EXPANSIONS
  • TABLE 249 KEY ENERGY SERVICES: COMPANY OVERVIEW
  • TABLE 250 KEY ENERGY SERVICES: PRODUCTS/SERVICES/SOLUTIONS OFFERED
  • TABLE 251 KEY ENERGY SERVICES: DEALS
  • TABLE 252 FORUM ENERGY TECHNOLOGIES, INC.: COMPANY OVERVIEW
  • TABLE 253 FORUM ENERGY TECHNOLOGIES, INC.: PRODUCTS/SERVICES/ SOLUTIONS OFFERED
  • TABLE 254 FORUM ENERGY TECHNOLOGIES, INC.: OTHERS
  • TABLE 255 OCEANEERING INTERNATIONAL, INC.: COMPANY OVERVIEW
  • TABLE 256 OCEANEERING INTERNATIONAL, INC.: PRODUCTS/SERVICES/SOLUTIONS OFFERED
  • TABLE 257 OCEANEERING INTERNATIONAL, INC.: DEALS
  • TABLE 258 OCEANEERING INTERNATIONAL, INC.: OTHERS
  • TABLE 259 INTERVENTEK SUBSEA ENGINEERING: COMPANY OVERVIEW
  • TABLE 260 INTERVENTEK SUBSEA ENGINEERING: PRODUCTS/SERVICES/ SOLUTIONS OFFERED
  • TABLE 261 HALLIBURTON: PRODUCT LAUNCHES
  • TABLE 262 INTERVENTEK SUBSEA ENGINEERING: DEALS
  • TABLE 263 AJ LUCAS GROUP: COMPANY OVERVIEW
  • TABLE 264 AJ LUCAS GROUP: PRODUCTS/SERVICES/SOLUTIONS OFFERED
  • TABLE 265 AJ LUCAS GROUP: DEALS
  • TABLE 266 CHINA OILFIELD SERVICES LIMITED: COMPANY OVERVIEW
  • TABLE 267 CHINA OILFIELD SERVICES LIMITED: PRODUCTS/SERVICES/SOLUTIONS OFFERED
  • TABLE 268 CHINA OILFIELD SERVICES LIMITED: OTHERS
LIST OF FIGURES
 
  • FIGURE 1 WELL INTERVENTION MARKET SEGMENTATION
  • FIGURE 2 RESEARCH DESIGN
  • FIGURE 3 DATA TRIANGULATION
  • FIGURE 4 MARKET SIZE ESTIMATION METHODOLOGY: BOTTOM-UP APPROACH
  • FIGURE 5 MARKET SIZE ESTIMATION METHODOLOGY: TOP-DOWN APPROACH
  • FIGURE 6 CRUDE OIL PRICE VS. RIG COUNT, 2013–2023 (USD PER BARREL)
  • FIGURE 7 CRUDE OIL PRICE TREND, 2014–2023 (USD PER BARREL)
  • FIGURE 8 MAIN METRICS CONSIDERED TO ANALYZE AND ASSESS DEMAND FOR WELL INTERVENTION SOLUTIONS AND SERVICES
  • FIGURE 9 KEY STEPS CONSIDERED TO ASSESS SUPPLY OF WELL INTERVENTION SOLUTIONS AND SERVICES
  • FIGURE 10 WELL INTERVENTION MARKET: SUPPLY-SIDE ANALYSIS
  • FIGURE 11 NORTH AMERICA ACCOUNTED FOR LARGEST MARKET SHARE IN 2023
  • FIGURE 12 LOGGING & BOTTOMHOLE SURVEY SEGMENT TO ACCOUNT FOR LARGEST MARKET SHARE IN 2029
  • FIGURE 13 LIGHT INTERVENTION SEGMENT TO ACCOUNT FOR LARGEST MARKET SHARE IN 2029
  • FIGURE 14 HORIZONTAL WELL SEGMENT TO HOLD LARGER MARKET SHARE IN 2029
  • FIGURE 15 ONSHORE SEGMENT TO ACCOUNT FOR LARGER MARKET SHARE IN 2029
  • FIGURE 16 GROWING NEED TO INCREASE PRODUCTION FROM MATURE OIL & GAS FIELDS TO DRIVE DEMAND FOR WELL INTERVENTION SOLUTIONS AND SERVICES
  • FIGURE 17 NORTH AMERICA TO RECORD HIGHEST CAGR IN WELL INTERVENTION MARKET BETWEEN 2024 AND 2029
  • FIGURE 18 LIGHT INTERVENTION SEGMENT AND US HELD LARGEST SHARES OF NORTH AMERICAN WELL INTERVENTION MARKET IN 2023
  • FIGURE 19 LOGGING & BOTTOMHOLE SURVEY SEGMENT TO ACCOUNT FOR LARGEST SHARE OF WELL INTERVENTION MARKET IN 2029
  • FIGURE 20 LIGHT INTERVENTION SEGMENT TO ACCOUNT FOR LARGEST SHARE OF WELL INTERVENTION MARKET IN 2029
  • FIGURE 21 HORIZONTAL WELL SEGMENT TO ACCOUNT FOR LARGER SHARE OF WELL INTERVENTION MARKET IN 2029
  • FIGURE 22 ONSHORE SEGMENT TO ACCOUNT FOR LARGER SHARE OF WELL INTERVENTION MARKET IN 2029
  • FIGURE 23 WELL INTERVENTION MARKET: DRIVERS, RESTRAINTS, OPPORTUNITIES, AND CHALLENGES
  • FIGURE 24 OIL PRODUCTION, BY REGION, 2019–2023 (MILLION BARRELS/DAY)
  • FIGURE 25 GLOBAL OIL DEMAND, 2019–2023 (THOUSAND BARRELS/DAY)
  • FIGURE 26 TRENDS/DISRUPTIONS IMPACTING CUSTOMERS’ BUSINESSES
  • FIGURE 27 VALUE CHAIN ANALYSIS OF WELL INTERVENTION MARKET
  • FIGURE 28 PARTICIPANTS IN WELL INTERVENTION ECOSYSTEM
  • FIGURE 29 EXPORT DATA RELATED TO HS CODE 730424-COMPLIANT PRODUCTS FOR KEY REGIONS/COUNTRIES, 2020–2022 (USD THOUSAND)
  • FIGURE 30 IMPORT DATA RELATED TO HS CODE 730424-COMPLIANT PRODUCTS FOR KEY REGIONS/COUNTRIES, 2020–2022 (USD THOUSAND)
  • FIGURE 31 IMPORT DATA RELATED TO HS CODE 730423-COMPLIANT PRODUCTS FOR KEY REGIONS/COUNTRIES, 2020–2022 (USD THOUSAND)
  • FIGURE 32 EXPORT DATA RELATED TO HS CODE 730423-COMPLIANT PRODUCTS FOR KEY REGIONS/COUNTRIES, 2020–2022 (USD THOUSAND)
  • FIGURE 33 PATENTS APPLIED AND GRANTED RELATED TO WELL INTERVENTION SOLUTIONS, 2013–2023
  • FIGURE 34 AVERAGE SELLING PRICE (ASP) TREND OF WELL INTERVENTION SERVICES, BY REGION, 2021–2029 (USD THOUSAND)
  • FIGURE 35 INDICATIVE PRICING TREND OF WELL INTERVENTION SERVICES, BY APPLICATION, 2023 (USD THOUSAND)
  • FIGURE 36 INVESTMENT AND FUNDING SCENARIO OF KEY PLAYERS IN WELL INTERVENTION MARKET, 2024 (USD BILLION)
  • FIGURE 37 PORTER’S FIVE FORCES ANALYSIS RELATED TO WELL INTERVENTION MARKET
  • FIGURE 38 INFLUENCE OF KEY STAKEHOLDERS ON BUYING PROCESS, BY APPLICATION
  • FIGURE 39 KEY BUYING CRITERIA, BY APPLICATION
  • FIGURE 40 WELL INTERVENTION MARKET, BY WELL TYPE, 2023
  • FIGURE 41 WELL INTERVENTION MARKET, BY INTERVENTION TYPE, 2023
  • FIGURE 42 WELL INTERVENTION MARKET, BY APPLICATION, 2023
  • FIGURE 43 WELL INTERVENTION MARKET, BY SERVICE, 2023
  • FIGURE 44 NORTH AMERICA TO REGISTER HIGHEST CAGR IN WELL INTERVENTION MARKET FROM 2024 TO 2029
  • FIGURE 45 WELL INTERVENTION MARKET, BY REGION, 2023
  • FIGURE 46 NORTH AMERICA: WELL INTERVENTION MARKET SNAPSHOT
  • FIGURE 47 EUROPE: WELL INTERVENTION MARKET SNAPSHOT
  • FIGURE 48 WELL INTERVENTION MARKET SHARE ANALYSIS, 2023
  • FIGURE 49 WELL INTERVENTION MARKET: REVENUE ANALYSIS OF TOP FIVE PLAYERS, 2019–2023 (USD BILLION)
  • FIGURE 50 WELL INTERVENTION MARKET: COMPANY VALUATION, 2024 (USD BILLION)
  • FIGURE 51 WELL INTERVENTION MARKET: FINANCIAL METRICS, 2024
  • FIGURE 52 WELL INTERVENTION MARKET: BRAND/PRODUCT COMPARISON
  • FIGURE 53 WELL INTERVENTION MARKET: COMPANY EVALUATION MATRIX (KEY PLAYERS), 2023
  • FIGURE 54 WELL INTERVENTION MARKET: COMPANY FOOTPRINT
  • FIGURE 55 WELL INTERVENTION MARKET: COMPANY EVALUATION MATRIX (STARTUPS/SMES), 2023
  • FIGURE 56 SLB: COMPANY SNAPSHOT
  • FIGURE 57 HALLIBURTON: COMPANY SNAPSHOT
  • FIGURE 58 BAKER HUGHES: COMPANY SNAPSHOT
  • FIGURE 59 WEATHERFORD: COMPANY SNAPSHOT
  • FIGURE 60 ARCHER: COMPANY SNAPSHOT
  • FIGURE 61 EXPRO GROUP: COMPANY SNAPSHOT
  • FIGURE 62 TRICAN.: COMPANY SNAPSHOT
  • FIGURE 63 PATTERSON-UTI: COMPANY SNAPSHOT
  • FIGURE 64 NINE ENERGY SERVICE: COMPANY SNAPSHOT
  • FIGURE 65 KEY ENERGY SERVICES: COMPANY SNAPSHOT
  • FIGURE 66 FORUM ENERGY TECHNOLOGIES, INC.: COMPANY SNAPSHOT
  • FIGURE 67 OCEANEERING INTERNATIONAL, INC.: COMPANY SNAPSHOT
  • FIGURE 68 AJ LUCAS GROUP: COMPANY SNAPSHOT
  • FIGURE 69 CHINA OILFIELD SERVICES LIMITED: COMPANY SNAPSHOT

The study involved major activities in estimating the current size of the Well Intervention market. Exhaustive secondary research was done to collect information on the peer and parent markets. The next step was to validate these findings, assumptions, and sizing with industry experts across the value chain through primary research. Both top-down and bottom-up approaches were employed to estimate the complete market size. Thereafter, market breakdown and data triangulation were used to estimate the market size of the segments and subsegments.

Secondary Research

This research study on the Well Intervention market involved the use of extensive secondary sources, directories, and databases, such as the Federal Energy Regulatory Commission (FERC), Occupational Safety and Health Administration (OSHA), Bureau of Safety and Environmental Enforcement (BSEE), Canada Energy Regulator (CER), Norwegian Offshore Directorate, North Sea Transition Authority (NSTA), National Offshore Petroleum Safety and Environmental Management Authority (NOPSEMA), and Saudi Arabian Standards Organization, to identify and collect information useful for a technical, market-oriented, and commercial study of the global Well Intervention market. The other secondary sources included annual reports, press releases & investor presentations of companies, white papers, certified publications, articles by recognized authors, manufacturer associations, trade directories, and databases.
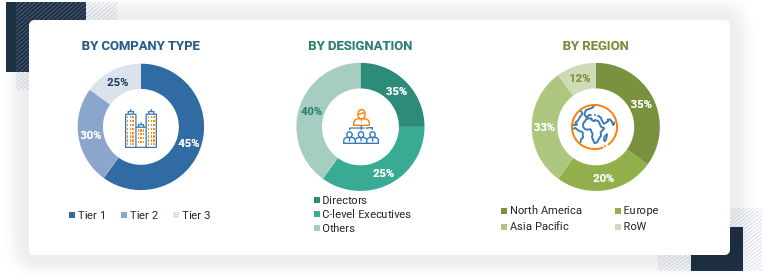
Primary Research

Well intervention encompasses various operations aimed at enhancing or restoring production in wells, addressing issues like flow restrictions, reservoir changes, sand production, or mechanical failures. Costs escalate as offshore activities expand into deeper waters and encounter more complex conditions. Techniques like wireline units for light intervention and CT or HWO units for medium intervention offer cost-effective alternatives, particularly for live wells. Platform well intervention utilizes equipment brought onto the platform, while subsea intervention, although more costly, is mitigated by specialized vessels and innovative subsea systems. The industry trend favors cost reduction through dedicated intervention vessels and advanced subsea technologies.

To know about the assumptions considered for the study, download the pdf brochure

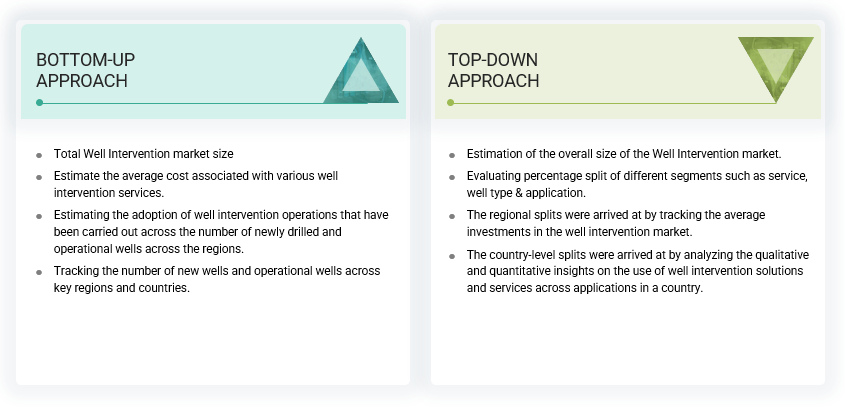
Market Size Estimation

Both top-down and bottom-up approaches were used to estimate and validate the total size of the Well Intervention market. These methods were also used extensively to estimate the size of various subsegments in the market. The research methodology used to estimate the market size includes the following:

Well Intervention Market Size: Top-Down Approach & Bottom-Up Approach

Data Triangulation

After arriving at the overall market size from the above estimation process, the total market has been split into several segments and subsegments. To complete the overall market engineering process and arrive at the exact statistics for all the segments and subsegments, data triangulation and market breakdown processes have been employed, wherever applicable. The data has been triangulated by studying various factors and trends from both the demand- and supply sides. Along with this, the market has been validated using both the top-down and bottom-up approaches.

Market Definition

At some point, oil and gas wells have to be maintained, repaired, or replaced to keep them operating as long as possible. Well intervention services achieve this. Well intervention refers to any remedial operation performed on oil or gas wells to restore or improve fluid production (oil and gas). It can be carried out during the well completion, production, or abandonment processes. It is performed due to flow restrictions in a well, changes in reservoir characteristics, sand production, mechanical failure, or to provide access to additional hydrocarbon reserves. Some common well intervention operations include slackline, coiled tubing, hydraulic workover, and wireline, but the well downhole applications may vary depending on a particular well, such as well surveillance and diagnostic, reservoir management techniques, re-entry drilling towards accessing new producing intervals, complete repair and abandonment, and well evaluation. Well intervention services might be performed onshore oil and gas fields or maybe done offshore.

Stakeholders

  • Consulting companies in the energy & power sector
  • Government & research organizations
  • Investment banks
  • National oil companies (NOCs)
  • Oil & gas field operators
  • Oilfield service companies
  • Power & energy associations
  • Drilling contractors
  • Well intervention service providers
  • Well intervention tools and equipment manufacturers
  • Drilling contractors

Report Objectives

  • To define, describe, and forecast the oil and gas pumps market based on type, pump type,  application and region in terms of value
  • To define, describe, segment, and forecast the Well Intervention market, in terms of value and volume based on service, intervention type, well type, application, and region
  • To forecast the market size for five key regions: North America, South America, Europe, Asia Pacific, and Middle East & Africa, along with their key countries
  • To provide detailed information about the key drivers, restraints, opportunities, and challenges influencing the growth of the market
  • To strategically analyze the subsegments concerning individual growth trends, prospects, and contributions of each segment to the overall market size
  • To analyze market opportunities for stakeholders and the competitive landscape of the market
  • To strategically profile the key players and comprehensively analyze their market shares and core competencies
  • To analyze competitive developments, such as deals and agreements in the market


Previous Versions of this Report

Well Intervention Market by Service (Logging and Bottomhole Survey, Tubing/Packer Failure and Repair, Stimulation), Intervention (Light, Medium, Heavy), Application (Onshore, Offshore) Well (Horizontal, Vertical) Region - Global Forecast to 2026

Report Code EP 3333
Published in Jul, 2021, By MarketsandMarkets™

Well Intervention Market by Service (Logging & Bottomhole Survey, Tubing/Packer Failure & Repair, Stimulation, Artificial Lift), Type (Light, Medium, Heavy) Application (Onshore, Offshore) Well (Horizontal, Vertical) Region - Global Forecast to 2025

Report Code EP 3333
Published in Jul, 2020, By MarketsandMarkets™

Well Intervention Market by Service (Logging & Bottomhole Survey, Tubing/Packer Failure & Repair, Stimulation, Artificial Lift), Type (Light, Medium, Heavy) Application (Onshore, Offshore) Well (Horizontal, Vertical) Region - Global Forecast to 2024

Report Code EP 3333
Published in Jul, 2019, By MarketsandMarkets™

Well Intervention Market by Services (Logging & Bottomhole Survey, Tubing/Packer Failure & Repair, Stimulation, Sand Control, Artificial Lift, Fishing, Others), Type (Light, Medium, Heavy), Application (Onshore & Offshore) & Region - Global Forecast to 2023

Report Code EP 3333
Published in Dec, 2018, By MarketsandMarkets™

Well Intervention Market by Services (Logging & Bottomhole Survey, Tubing/Packer Failure & Repair, Stimulation, Sand Control, Artificial Lift, Fishing, Others), Application (Onshore & Offshore), and Region - Global Trends & Forecast to 2022

Report Code EP 3333
Published in Apr, 2017, By MarketsandMarkets™

Well Intervention Market by Services (Logging & Bottom Hole Survey, Tubing/Packer Failure & Repair, Stimulation, Artificial Lift, Others), Application (Onshore & Offshore) & Region - Global Trends & Forecast to 2019

Report Code EP 3333
Published in Apr, 2015, By MarketsandMarkets™

Well Intervention Market by Service Types (Logging & Bottom Hole Survey, Tubing/Packer Failure & Repair, Stimulation, Artificial Lift, Others), Application Areas (Onshore & Offshore), and Geography - Global Trends & Forecast to 2019

Report Code EP 2706
Published in Sep, 2014, By MarketsandMarkets™

Well Intervention Market by Service Types (Logging & Bottom Hole Survey, Tubing/Packer Failure & Repair, Stimulation, Artificial Lift, Others), Application Areas (Onshore & Offshore), and Geography - Global Trends & Forecast to 2019

Report Code EP 2706
Published in Jan, 2011, By MarketsandMarkets™
"Our USP is "providing game-changing business opportunities reports with free customization" - so please feel free to provide us with your specific areas of interest / business challenges in much greater detail !!"

We appreciate your interest in this report. Once you fill out the form, you'll be immediately directed to an exclusive solution tailored to your needs. This high-value offering can help boost your revenue by 30% - a must-see opportunity for anyone looking to maximize growth.


By clicking the "Submit" button, you are agreeing to the Terms of Use and Privacy Policy.

Custom Market Research Services

We Will Customise The Research For You, In Case The Report Listed Above Does Not Meet With Your Requirements

Get 10% Free Customisation

Growth opportunities and latent adjacency in Well Intervention Market

Daniel

Jun, 2022

Interested in the major factors influencing the growth and policies applied by the companies of the global well intervention market for the period of 2022-2030..

DMCA.com Protection Status