Sugar Toppings Market by Type (Dry Sugar Toppings, Wet Sugar Toppings), Channel (Industrial, Grocery, Foodservice), and by Region (North America, Asia-Pacific, Europe, Rest of the World) - Global Forecasts to 2021


[158 Pages Report] The sugar toppings market is expected to grow from USD 4.88 billion in 2015 to USD 6.93 billion by 2021, at a CAGR of 6.0% from 2016 to 2021. The rising consumption of confectionaries across all the regions and growth in the consumption of low sugar topping products has been fueling the demand of sugar toppings market. Furthermore, the growth in the market is attributed to the inclination towards the branded food products in the merging countries such as India, Brazil, and the Middle East. The base year considered for the study is 2015, and the forecast has been provided for the period between 2016 and 2021.
Market Dynamics
Drivers
- Rising consumption of confectionaries across all the regions
- Growth in the consumption of low sugar topping products
Restraints
- Slow growth in the mature markets of Europe and North America
- Fluctuation in price of raw material such as sugar and chocolate
Opportunities
- Marketing of breakfast syrups and beverage sauces in the Asian market
- Rising demand of sugar toppings from emerging markets such as China, India, Brazil,and the Middle East
Challenges
- Increasing health consciousness leading to a decline in consumption of chocolates, sugars,and other similar products
- Increasing incidents of obesity and diabetes
Rising consumption of confectioneries globally drives the sugar toppings market
Sugar toppings are used in confectionaries in a variety of forms. They are used as icing on cakes and cupcakes and as sprinkles to improve the appearance of cake. The consumption of confectionaries is increasing all over the world. Confectioneries can be divided into two types, namely, sugar confectioneries and chocolate confectioneries, in which sugar is the main ingredient. Globally, sugar confectioneries account for 39% and chocolate confectioneries for 61% of the total consumption of confectioneries. This ratio can vary among countries. Confectionery consumption is increasing in countries with the growing middle class, such as Brazil and India, and in countries with traditionally low sugar consumption, such as China and Japan.
The following are the major objectives of the study.
- To identify statistics of the global sugar toppings market with detailed classifications, in terms of value and volume
- To identify emerging trends and opportunities in the global sugar toppings market
- To analyze the market with focus on high growth types and the fastest-growing market segments
- To analyze the factors that drive and restrain the growth of the global sugar toppings market
- To provide a comprehensive competitive landscape of the global sugar toppings market and to profile they key market players with respect to market size and market shares
- To provide a detailed segmentation of the global sugar toppings market on the basis of type, channel, and region
- To analyze and forecast segments of the global sugar toppings market to present an overall view of the market, along with upcoming during the forecast period.
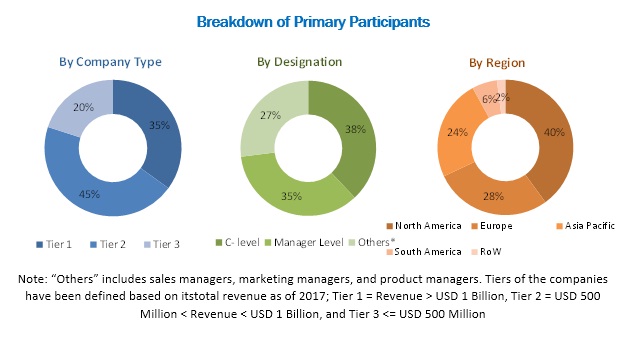
During this research study, major players operating in the sugar toppings market in various regions have been identified, and their offerings, regional presence, and distribution channels have been analyzed through in-depth discussions. Top-down and bottom-up approaches have been used to determine the overall market size. Sizes of the other individual markets have been estimated using the percentage splits obtained through secondary sources such as Hoovers, Bloomberg BusinessWeek, and Factiva, along with primary respondents. The entire procedure includes the study of the annual and financial reports of the top market players and extensive interviews with industry experts such as CEOs, VPs, directors, and marketing executives for key insights (both qualitative and quantitative) pertaining to the market. The figure below shows the breakdown of the primaries on the basis of the company type, designation, and region considered during the research study.
To know about the assumptions considered for the study, download the pdf brochure
The sugar toppings market comprises a network of players involved in the research and product development; raw material supply; component manufacturing; distribution and sale; and post-sales services. Key players considered in the analysis of the sugar toppings market are The J.M. Smucker Company (U.S.), The Hershey Company (U.S.), Pinnacle Foods, Inc. (U.S.), The Kraft Heinz Company (U.S.), Baldwin Richardson Foods Company (U.S.), Monin Incorporated (U.S.), R. Torre & Company, Inc. (U.S.), W.T. Lynch Foods Ltd. (U.S.), Ghirardelli Chocolate Company (U.S.), CK Products LLC (U.S.), Quaker Oats Company (U.S.), Regal Food Products Group Plc (U.K.)
Major Market Developments
- In April 2016, Monin incorporated introduced on-trend premium syrups such as cookie butter syrup and Hawaaiian island syrup. These are made with sugarcane and natural flavors. With this, the company intends to further strengthen its position is specialty beverages sector.
- In March 2014, R. Torre & Company introduced Torani Sweet Heat Syrup. This product includes peppers, which give a spicy flavor to beverages. It can be used in beverages such as mochas, cocktails, lemonades, and smoothies. This product launch improved the position of the company in the spiced syrups segment.
- In May 2014, Monin Incorporated introduced white peach, wild strawberry, and Morello cherry flavored syrups. These can be used with both alcoholic and non- alcoholic drinks. These products improved the company’s presence in fruit-flavored syrups market.
Target Audience
- Sugar Toppings Producers
- Sugar Toppings Traders, Distributors & Suppliers
- Manufacturers in End-Use Industries
- Government and Research Organizations
- Associations and Industry Bodies
Report Scope
By type:
-
Dry Sugar Toppings
- Dried icing sugar
- Sprinkles
- Flavored sugars
- Moisture resistant icing sugar
-
Wet
- Beverage sauces
- Breakfast syrups
By Channel:
- Industrial
- Grocery
- Food service
By Geography
- North America
- Europe
- Asia Pacific (APAC)
- Rest of the World (RoW)
Critical questions which the report answers
- What are new types of sugar toppings which the sugar topping manufacturers are exploring?
- Which are the key players in the market and how intense is the competition?
Available Customizations
Based on the given market data, MarketsandMarkets offers customizations in the reports as per the client’s specific requirements. The available customization options are as follows:
Region Analysis
- Further breakdown of Asia-Pacific & European sugar toppings markets
Company Information
- Detailed analysis and profiling of additional market players (Up to 3)
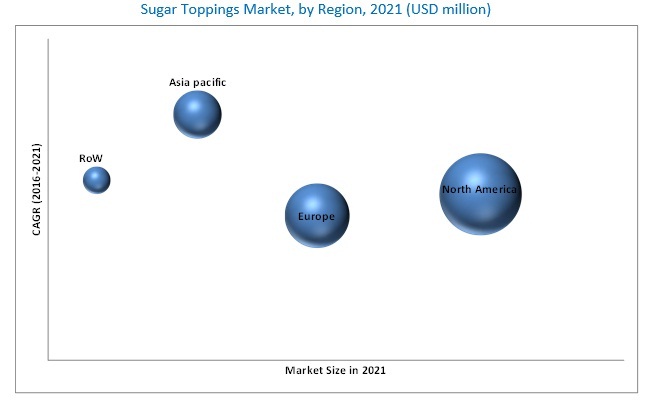
The overall sugar toppings market is expected to grow from USD 4.88 billion in 2015 to USD 6.93 billion by 2021, at a CAGR of 6.0% from 2016 to 2021. This growth is mainly attributed to the rising consumption of confectioneries, growth in the consumption of low-sugar topping products in Europe, marketing of breakfast syrups and beverage sauces in the Asian market, and rising demand of sugar toppings from emerging markets such as China, India, Brazil, and the Middle East.
The sugar toppings market has been segmented, on the basis of type into dry and wet sugar toppings. The dry sugar toppings accounted for the largest market share in 2016, owing to the rise in the demand for bakery and confectionery products. The market for fillers and packaging & handling segments are expected to grow at the highest CAGR between 2016 and 2021.
The sugar toppings market in APAC is expected to grow at the highest CAGR during the forecast period. APAC is the fastest-growing market for sugar toppings market, owing to the increased consumption of hot and cold beverages, in the region, along with the growing demand for convenience, such as cakes and cupcakes in the emerging economies such as China and India is contributing towards the growth of Asia Pacific sugar toppings market.
Dry sugar toppings
Dry sugar toppings are processed sugar-based products that are used as toppings primarily on confectioneries. Dry sugar toppings are used in bakeries to make cakes and cupcakes, among other confectioneries. Sprinkles are used for increasing the aesthetic effect of confectioneries, whereas flavored sugars are used in coffee, oatmeal, and cookies.
Wet sugar toppings
Wet sugar toppings are sweet toppings in liquid form. They are used to improve the taste of breakfast and dessert food and to enhance the taste of beverages like coffee and alcohol. Wet sugar toppings are used in various beverages and food items. Beverage syrups are used on coffee, alcohol, and milk, among liquid products, whereas, breakfast syrups are used on pancakes, desserts, and ice-creams, among other dessert items.
Critical questions the report answers:
- Where will all these developments take the industry in the mid to long term?
- What are the upcoming industry product types for sugar toppings market?
The fluctuation in the price of raw materials and slow growth in the mature markets of Europe and North America are the key restraint for the sugar toppings market.The market for sugar toppings is associated with the sale of processed foods. Static sales of fried food, candies, and prepared meals in the matured markets of developed economies in the last five years are responsible for the reduced growth of food processing industry. In developed economies such as the U.S. and Western Europe, the consumption of processed food is high and there is very limited scope for any further growth. With increasing health consciousness, the sales of sugar toppings and related products have been declining in few markets. Consumers see reluctant to buy premium-priced toppings products such as chocolate and chocolate coated confectioneries due to economic recession.
The market is also restrained by adverse economic conditions and maturity of the market in Europe. The high cost of running the processing equipment and scarcity of non-renewable energy sources are dissuading small food manufacturers from installing these processing systems. Energy efficiency is the major attribute that the food processors are looking at while choosing processing equipment. Increasing ecological requirements are expected to drive the demand for energy-efficient equipment such as FFS or grouping machines.
Key players in the market include The J.M. Smucker Company (U.S.), The Hershey Company (U.S.), Pinnacle Foods, Inc. (U.S.), The Kraft Heinz Company (U.S.), Baldwin Richardson Foods Company (U.S.), Monin Incorporated (U.S.), R. Torre & Company, Inc. (U.S.), W.T. Lynch Foods Ltd. (U.S.), Ghirardelli Chocolate Company (U.S.), CK Products LLC (U.S.), Quaker Oats Company (U.S.), Regal Food Products Group Plc (U.K.). These players are increasingly undertaking new product launches to develop and introduce new products in the market.
To speak to our analyst for a discussion on the above findings, click Speak to Analyst
 Exclusive indicates content/data unique to MarketsandMarkets and not available with any competitors.
Table of Contents
1 Introduction
1.1 Objectives of the Study
1.2 Definition
1.3 Global Sugar Toppings Market - Segmentation & Coverage
1.4 Stakeholders
2 Research Methodology
2.1 Research Methodology
2.2 Sugar Toppings Market, Research Design
2.3 Assumptions
2.4 Scope
2.5 Arriving at the Global Sugar Toppings Market
2.6 Demand Side Approach
2.7 Supply Side Approach
2.8 Key Industry Insights
2.9 Key Data From Secondary Sources
2.10 Key Data From Primary Sources
3 Executive Summary
3.1 Key Insights: Sugar Toppings Market
3.2 Sugar Toppings Market Snapshot, 2015 (Kilotons)
3.3 Asia Pacific to Witness the Highest Growth in the Sugar Toppings Market (%)
3.4 North America to Lead the Global Sugar Toppings Market in 2016 (Kilotons)
4 Premium Insights
4.1 North America to Remain the Largest Market for Dry Sugar Toppings
4.2 Asia-Pacific to Emerge as A Lucrative Market for Wet Sugar Toppings in the Global Market
4.3 Industrial Channel to Lead the Sugar Toppings Market Across All Regions
4.4 Product Life Cycle
5 Market Overview
5.1 Introduction
5.2 Market Structure & Value Chain Analysis
5.3 Global Sugar Toppings Market, By Region, 2015 (USD Million)
5.4 Global Sugar Toppings Market, By Types, 2015 (USD Million)
5.5 Global Sugar Toppings Market, By Channel, 2016 & 2021 (Kilotons)
6 Industry Trends
6.1 Drivers, Restraints, Opportunities, and Challenges
6.1.1 Drivers
6.1.2 Restraints
6.1.3 Opportunities
6.1.4 Challenges
6.2 Porter’s Five Forces Analysis
7 Global Sugar Toppings Market, By Type
7.1 Introduction
7.1.1 Key Pointers
7.2 Global Sugar Toppings Market, By Type
7.2.1 Global Sugar Toppings Market, By Type
7.3 Global Dry Sugar Toppings Market, By Type
7.3.1 Global Dry Sugar Toppings Market, By Type
7.4 Global Wet Sugar Toppings Market, By Type
7.4.1 Global Wet Sugar Toppings Market, By Type
8 Global Sugar Toppings Market, By Channel
8.1 Key Pointers
8.2 Global Sugar Toppings Market, By Channel
8.2.1 Global Sugar Toppings Market, By Channel
9 Global Sugar Toppings Market, By Region
9.1 Key Pointers
9.1.1 Global Sugar Toppings Market, By Region
9.1.2 Global Sugar Toppings Market, By Region
9.2 North America Sugar Toppings Market Snapshot
9.2.1 North America Sugar Toppings Market, By Channel
9.2.2 North America Sugar Toppings Market, By Type
9.2.3 North America Dry Sugar Toppings Market, By Type
9.2.4 North America Wet Sugar Toppings Market, By Type
9.2.5 North America Sugar Toppings Market, By Channel
9.2.6 North America Sugar Toppings Market, By Country
9.2.7 U.S. Sugar Toppings Market Snapshot
9.2.7.1 U.S. Sugar Toppings Market, By Channel
9.2.7.2 U.S. Sugar Toppings Market, By Type
9.2.7.3 U.S. Dry Sugar Toppings Market, By Type
9.2.7.4 U.S. Wet Sugar Toppings Market, By Type
9.2.7.5 U.S. Sugar Toppings Market, By Channel
9.2.8 Canada Sugar Toppings Market Snapshot
9.2.8.1 Canada Sugar Toppings Market, By Channel
9.2.8.2 Canada Sugar Toppings Market, By Type
9.2.8.3 Canada Dry Sugar Toppings Market, By Type
9.2.8.4 Canada Wet Sugar Toppings Market, By Type
9.2.8.5 Canada Sugar Toppings Market, By Channel
9.2.9 Mexico Sugar Toppings Market Snapshot
9.2.9.1 Mexico Sugar Toppings Market, By Channel
9.2.9.2 Mexico Sugar Toppings Market, By Type
9.2.9.3 Mexico Dry Sugar Toppings Market, By Type
9.2.9.4 Mexico Wet Sugar Toppings Market, By Type
9.2.9.5 Mexico Sugar Toppings Market, By Channel
9.3 Europe Sugar Toppings Market Snapshot
9.3.1 Europe Sugar Toppings Market, By Channel
9.3.2 Europe Sugar Toppings Market, By Type
9.3.3 Europe Dry Sugar Toppings Market, By Type
9.3.4 Europe Wet Sugar Toppings Market, By Type
9.3.5 Europe Sugar Toppings Market, By Channel
9.4 Asia-Pacific Sugar Toppings Market Snapshot
9.4.1 Asia-Pacific Sugar Toppings Market, By Channel
9.4.2 Asia-Pacific Sugar Toppings Market, By Type
9.4.3 Asia-Pacific Dry Sugar Toppings Market, By Type
9.4.4 Asia-Pacific Wet Sugar Toppings Market, By Type
9.4.5 Asia-Pacific Sugar Toppings Market, By Channel
9.5 RoW Sugar Toppings Market Snapshot
9.5.1 RoW Sugar Toppings Market, By Channel
9.5.2 RoW Sugar Toppings Market, By Type
9.5.3 RoW Sugar Dry Toppings Market, By Type
9.5.4 RoW Sugar Wet Toppings Market, By Type
9.5.5 RoW Sugar Toppings Market, By Channel
10 Global Sugar Toppings Market : Competitive Landscape
10.1 Companies Adopted Product Launch as the Key Growth Strategy Between 2011 and 2015
11 Global Sugar Toppings Market, By Company
11.1 The J.M. Smucker Company
11.1.1 Business Overview
11.1.2 Products Offered
11.1.3 Recent Developments
11.1.4 SWOT Analysis
11.1.5 MMM View
11.2 The Hershey Company
11.2.1 Business Overview
11.2.2 Products Offered
11.2.3 SWOT Analysis
11.2.4 MMM View
11.3 Pinnacle Foods, Inc.
11.3.1 Business Overview
11.3.2 Products Offered
11.3.3 SWOT Analysis
11.3.4 MMM View
11.4 The Kraft Heinz Company
11.4.1 Business Overview
11.4.2 Products Offered
11.4.3 SWOT Analysis
11.4.4 MMM View
11.5 Baldwin Richardson Foods Co.
11.5.1 Business Overview
11.5.2 Products Offered
11.5.3 SWOT Analysis
11.5.4 MMM View
11.6 Monin Inc.
11.6.1 Products Offered
11.6.2 Recent Developments
11.6.3 MMM View
11.7 R. Torre & Company, Inc.
11.7.1 Products Offered
11.7.2 Recent Developments
11.7.3 MMM View
11.8 W. T. Lynch Foods Ltd.
11.8.1 Products Offered
11.8.2 MMM View
List of Tables (60 Tables)
Table 1 Global Sugar Toppings Market, By Type, 2014-2021 (Kilotons)
Table 2 Global Sugar Toppings Market, By Type, 2014-2021 (USD Billion)
Table 3 Global Dry Sugar Toppings Market, By Type, 2014-2021 (Kilotons)
Table 4 Global Dry Sugar Toppings Market, By Type, 2014-2021 (USD Million)
Table 5 Global Wet Sugar Toppings Market, By Type, 2014-2021 (Kilotons)
Table 6 Global Wet Sugar Toppings Market, By Type, 2014-2021 (USD Billion)
Table 7 Global Sugar Toppings Market, By Channel, 2014-2021 (Kilotons)
Table 8 Global Sugar Toppings Market, By Region, 2014-2021 (Kilotons): Growth Analysis
Table 9 Global Sugar Toppings Market, By Region, 2014-2021 (USD Billion): Growth Analysis
Table 10 North America Sugar Toppings Market, By Type, 2014-2021 (Kilotons)
Table 11 North America Sugar Toppings Market, By Type, 2014-2021 (USD Million)
Table 12 North America Dry Sugar Toppings Market, By Type, 2014-2021 (Kilotons)
Table 13 North America Dry Sugar Toppings Market, By Type, 2014-2021 (USD Billion)
Table 14 North America Wet Sugar Toppings Market, By Type, 2014-2021 (Kilotons)
Table 15 North America Wet Sugar Toppings Market, By Type, 2014-2021 (USD Million)
Table 16 North America Sugar Toppings Market, By Channel, 2014-2021 (Kilotons)
Table 17 North America Sugar Toppings Market, By Country, 2014-2021 (Kilotons)
Table 18 North America Sugar Toppings Market, By Country, 2014-2021 USD (Million)
Table 19 U.S. Sugar Toppings Market, By Type, 2014-2021 (Kilotons)
Table 20 U.S. Sugar Toppings Market, By Type, 2014-2021 (USD Million)
Table 21 U.S. Dry Sugar Toppings Market, By Type, 2014-2021 (Kilotons)
Table 22 U.S. Dry Sugar Toppings Market, By Type, 2014-2021 (USD Million)
Table 23 U.S. Wet Sugar Toppings Market, By Type, 2014-2021 (Kilotons)
Table 24 U.S. Wet Sugar Toppings Market, By Type, 2014-2021 (USD Million)
Table 25 U.S. Sugar Toppings Market, By Channel, 2014-2021 (Kilotons)
Table 26 Canada Sugar Toppings Market, By Type, 2014-2021 (Kilotons)
Table 27 Canada Sugar Toppings Market, By Type, 2014-2021 (USD Million)
Table 28 Canada Dry Sugar Toppings Market, By Type, 2014-2021 (Kilotons)
Table 29 Canada Dry Sugar Toppings Market, By Type, 2014-2021 (USD Million)
Table 30 Canada Wet Sugar Toppings Market, By Type, 2014-2021 (Kilotons)
Table 31 Canada Wet Sugar Toppings Market, By Type, 2014-2021 (USD Million)
Table 32 Canada Sugar Toppings Market, By Channel, 2014-2021 (Kilotons)
Table 33 Mexico Sugar Toppings Market, By Type, 2014-2021 (Kilotons)
Table 34 Mexico Sugar Toppings Market, By Type, 2014-2021 (USD Million)
Table 35 Mexico Dry Sugar Toppings Market, By Type, 2014-2021 (Kilotons)
Table 36 Mexico Dry Sugar Toppings Market, By Type, 2014-2021 (USD Million)
Table 37 Mexico Wet Sugar Toppings Market, By Type, 2014-2021 (Kilotons)
Table 38 Mexico Wet Sugar Toppings Market, By Type, 2014-2021 (USD Million)
Table 39 Mexico Sugar Toppings Market, By Channel, 2014-2021 (Kilotons)
Table 40 Europe Sugar Toppings Market, By Type, 2014-2021 (Kilotons)
Table 41 Europe Sugar Toppings Market, By Type, 2014-2021 (USD Million)
Table 42 Europe Dry Sugar Toppings Market, By Type, 2014-2021 (Kilotons)
Table 43 Europe Dry Sugar Toppings Market, By Type, 2014-2021 (USD Million)
Table 44 Europe Wet Sugar Toppings Market, By Type, 2014-2021 (Kilotons)
Table 45 Europe Wet Sugar Toppings Market, By Type, 2014-2021 (USD Million)
Table 46 Europe Sugar Toppings Market, By Channel, 2014-2021 (Kilotons)
Table 47 Asia-Pacific Sugar Toppings Market, By Type, 2014-2021 (Kilotons)
Table 48 Asia-Pacific Sugar Toppings Market, By Type, 2014-2021 (USD Million)
Table 49 Asia-Pacific Dry Sugar Toppings Market, By Type, 2014-2021 (Kilotons)
Table 50 Asia-Pacific Dry Sugar Toppings Market, By Type, 2014-2021 (USD Million)
Table 51 Asia-Pacific Wet Sugar Toppings Market, By Type, 2014-2021 (Kilotons)
Table 52 Asia-Pacific Wet Sugar Toppings Market, By Type, 2014-2021 (USD Million)
Table 53 Asia-Pacific Sugar Toppings Market, By Channel, 2014-2021 (Kilotons)
Table 54 RoW Sugar Toppings Market, By Type, 2014-2021 (Kilotons)
Table 55 RoW Sugar Toppings Market, By Type, 2014-2021 (USD Million)
Table 56 RoW Dry Sugar Toppings Market, By Type, 2014-2021 (Kilotons)
Table 57 RoW Dry Sugar Toppings Market, By Type, 2014-2021 (USD Million)
Table 58 RoW Wet Sugar Toppings Market, By Type, 2014-2021 (Kilotons)
Table 59 RoW Wet Sugar Toppings Market, By Type, 2014-2021 (USD Million)
Table 60 RoW Sugar Toppings Market, By Channel, 2014-2021 (Kilotons)
List of Figures (37 Figures)
Figure 1 Global Sugar Toppings Market - Segmentation & Coverage
Figure 2 Global Sugar Toppings Market - Segmentation & Coverage
Figure 3 Arriving at the Global Sugar Toppings Market
Figure 4 Demand Side Approach
Figure 5 Supply Side Approach
Figure 6 Key Industry Insights
Figure 7 Global Sugar Toppings Market Share, By Region, 2015 (%)
Figure 8 Global Sugar Toppings Market Growth, By Region, 2016-2021 (%)
Figure 9 Global Sugar Toppings Types Market Share, 2015 (%)
Figure 10 Global Sugar Toppings Market Growth, By Types, 2016-2021 (%)
Figure 11 Global Sugar Toppings Market, By Type, 2016 & 2021 (%)
Figure 12 Global Sugar Toppings Market, By Type, 2016 & 2021 (Kilotons)
Figure 13 Global Dry Sugar Toppings Market, By Region, 2016 & 2021
Figure 14 Global Wet Sugar Toppings Market, By Region, 2016 & 2021
Figure 15 Global Sugar Toppings Market, By Channel, 2016 & 2021 (Kilotons)
Figure 16 Global Sugar Toppings Market, By Region, 2016 & 2021 (Kilotons): Growth Analysis
Figure 17 North America Sugar Toppings Market, 2016 (Value & Volume)
Figure 18 North America Sugar Toppings Market, By Channel, 2016 & 2021 (Kilotons): Growth Analysis
Figure 19 North America Sugar Toppings Market Overview, 2016 & 2021
Figure 20 U.S. Sugar Toppings Market, 2016 (Value & Volume)
Figure 21 U.S. Sugar Toppings Market, By Channel, 2016 & 2021 (Kilotons): Growth Analysis
Figure 22 U.S. Sugar Toppings Market Overview, 2016 & 2021
Figure 23 Canada Sugar Toppings Market, 2016 (Value & Volume)
Figure 24 Canada Sugar Toppings Market, By Channel, 2016 & 2021 (Kilotons): Growth Analysis
Figure 25 Canada Sugar Toppings Market Overview, 2016 & 2021
Figure 26 Mexico Sugar Toppings Market, 2016 (Value & Volume)
Figure 27 Mexico Sugar Toppings Market, By Channel, 2016 & 2021 (Kilotons): Growth Analysis
Figure 28 Mexico Sugar Toppings Market Overview, 2016 & 2021
Figure 29 Europe Sugar Toppings Market, 2016 (Value & Volume)
Figure 30 Europe Sugar Toppings Market, By Channel, 2016 & 2021 (Kilotons): Growth Analysis
Figure 31 Europe Sugar Toppings Market Overview, 2016 & 2021
Figure 32 Asia-Pacific Sugar Toppings Market, 2016 (Value & Volume)
Figure 33 Asia-Pacific Sugar Toppings Market, By Channel, 2016 & 2021 (Kilotons): Growth Analysis
Figure 34 Asia-Pacific Sugar Toppings Market Overview, 2016 & 2021
Figure 35 RoW Sugar Toppings Market, 2016 (Value & Volume)
Figure 36 RoW Sugar Toppings Market, By Channel, 2016 & 2021 (Kilotons): Growth Analysis
Figure 37 RoW Sugar Toppings Market Overview, 2016 & 2021


Growth opportunities and latent adjacency in Sugar Toppings Market