Surface Roughness Measurement Market by Component (Probes, software Cameras, Lighting Equipment), Surface Type (2D and 3D), Technique Type (Contact and noncontact), Vertical (Automotive, Energy & Power) and Geography - Global forecast to 2025-2035


The global surface roughness measurement market was valued at USD 0.96 billion in 2024 and is estimated to reach USD 1.70 billion by 2035, at a CAGR of 5.0% between 2025 and 2035.
The global surface roughness measurement market is driven by the increasing need for high-precision manufacturing across industries such as automotive, aerospace, electronics, and medical devices. Accurate surface characterization ensures better performance, durability, and efficiency of critical components like engine parts, gears, and surgical instruments. The growing adoption of automated production lines and quality control systems further fuels the demand for precise surface metrology. Additionally, advancements in 3D and non-contact measurement technologies enable faster, more accurate, and repeatable inspections, making surface roughness measurement an essential tool in modern manufacturing.

Surface roughness indicates the condition of the machine surface, that is, its finishing or asperity. Surface roughness not only impacts the appearance of the product but also generates texture or tactile differences, which may change the amount of wear to be experienced by the product or its ability to form a seal in leakage. Surface roughness measurement supports in quantifying characteristics such as form, radius, roughness, waviness, angle, height, distance, and dominant wavelength of the specimen surface.
Market by Surface Type
2D
In the surface roughness measurement market, the 2D surface type is expected to hold the largest market share during the forecast period. This dominance is attributed to the wide adoption of 2D measurement systems across industries such as automotive, metalworking, aerospace, and electronics, where profile-based measurements are sufficient for quality inspection and process control. 2D systems are cost-effective, easy to operate, and provide high-speed measurements compared to more complex 3D systems. They also integrate seamlessly with existing production lines for real-time surface monitoring. Furthermore, advancements in contact and non-contact profilometers have improved the precision and repeatability of 2D measurements, reinforcing their preference in manufacturing quality assurance applications.
3D
In the surface roughness measurement market, the 3D surface type is expected to register the highest CAGR during the forecast period. The growing preference for comprehensive surface characterization and the ability to analyze complex geometries are driving the demand for 3D measurement technologies. Unlike 2D systems, 3D surface measurement provides detailed topographical data, enabling better assessment of surface defects, textures, and wear patterns. Industries such as semiconductors, aerospace, and precision manufacturing are increasingly adopting 3D systems for advanced quality assurance and microstructure analysis. Additionally, technological advancements in optical interferometry, confocal microscopy, and laser scanning have made 3D measurement systems more accurate, automated, and faster, further fueling their adoption in high-end applications.
Market by Vertical
Automotive
In the surface roughness measurement market, the automotive industry is expected to hold the largest market share during the forecast period. This dominance is attributed to the extensive use of surface metrology in engine manufacturing, transmission systems, braking components, and exterior body finishing, where maintaining precise surface texture is critical for performance, durability, and fuel efficiency. Automotive manufacturers rely heavily on surface roughness measurement tools for quality assurance and process optimization across production lines. Additionally, the rising emphasis on lightweight materials, electrification of vehicles (EVs), and stringent emission standards has further increased the need for accurate surface characterization. The integration of automated and non-contact measurement systems in automotive manufacturing plants also enhances efficiency and consistency, reinforcing the segment’s leadership in the global market.
Energy & Power
In the surface roughness measurement market, the energy and power vertical is expected to witness the highest CAGR during the forecast period. This growth is driven by the rising demand for high-precision surface inspection in the manufacturing and maintenance of turbines, rotors, valves, and pipelines, where surface quality directly impacts efficiency, reliability, and safety. The expansion of renewable energy projects, including wind, solar, and hydro power, has also increased the need for surface metrology solutions to ensure optimal performance of critical components. Moreover, the transition toward smart grids and advanced power generation systems requires components with superior surface integrity and wear resistance, further fueling market growth. Increasing investments in energy infrastructure modernization and predictive maintenance are expected to accelerate the adoption of 3D and non-contact surface roughness measurement technologies across the sector.
Market by Geography
Geographically, the surface roughness measurement market is experiencing widespread adoption across North America, Europe, Asia Pacific, and the Middle East & Africa. Asia Pacific is expected to hold largest market size, driven by the presence of major manufacturing hubs in countries like China, Japan, South Korea, and India, which dominate sectors such as automotive, electronics, aerospace, and heavy machinery. The region is witnessing rapid industrialization, increased automotive production, and growing demand for high-precision engineering, all of which boost the adoption of surface roughness measurement systems. Furthermore, the availability of skilled labor, government support for smart manufacturing initiatives, and increasing investments in automation and quality assurance contribute to market growth. The proliferation of export-oriented industries in APAC also emphasizes stringent quality control measures, reinforcing the demand for reliable surface metrology.
Market Dynamics
Driver: Increasing Adoption of Automation and Precision Manufacturing
The growing trend toward automation in manufacturing and precision engineering is a key driver for the surface roughness measurement market. Industries such as automotive, aerospace, electronics, and medical devices are increasingly relying on automated inspection systems to ensure high-quality surface finishes. These systems help reduce human error, improve production efficiency, and maintain tight tolerances on critical components, which directly influences product performance and durability. The integration of non-contact and 3D surface measurement technologies further enables real-time quality control, making adoption of advanced metrology solutions a strategic priority for manufacturers.
Restraint: High Initial Cost of Measurement Systems
A significant restraint in this market is the high initial cost of acquiring surface roughness measurement systems, particularly 3D and high-precision non-contact devices. The installation often involves expensive hardware, calibration tools, and skilled labor, which can deter small and medium-sized manufacturers from adoption. Additionally, integrating these systems into existing production lines requires infrastructure modifications and ongoing maintenance costs. Manufacturers must therefore evaluate scalable and modular systems that offer a balance between performance and affordability to overcome this barrier.
Opportunity: Rising Demand in Energy, Power, and Advanced Industries
The surface roughness measurement market presents substantial opportunities in emerging sectors such as renewable energy, power generation, and high-tech industrial equipment. Components like turbines, rotors, valves, and pipelines demand precise surface integrity for efficiency, reliability, and durability. The expansion of wind, solar, and electric vehicle technologies has intensified the need for high-precision metrology solutions. Companies can leverage this opportunity by developing specialized measurement systems that cater to complex geometries, large components, and high-throughput requirements in these verticals.
Challenge: Rapid Technological Advancements and Skill Gap
A major challenge in the market is the rapid evolution of surface measurement technologies, including 3D imaging, laser scanning, and AI-based analysis. Keeping pace with these advancements requires continuous R&D investment and skilled personnel capable of operating sophisticated equipment. Many manufacturers face a skill gap in understanding and deploying advanced metrology systems effectively. To address this challenge, companies should focus on employee training programs, partnerships with technology providers, and modular systems that allow easy upgrades to stay competitive in a rapidly changing market landscape.
Future Outlook
Between 2025 and 2035, the surface roughness measurement market is expected to expand significantly due to the growing adoption of 3D and non-contact measurement technologies. Unlike traditional 2D contact-based systems, 3D surface measurement tools provide comprehensive topographical analysis, capturing intricate details of complex surfaces, textures, and microstructures. Non-contact methods, such as laser scanning, confocal microscopy, and optical interferometry, offer faster, highly accurate, and repeatable measurements without physically touching the component, which minimizes the risk of damage. This advancement is particularly crucial for high-value components in automotive, aerospace, semiconductor, and medical device industries, where precision and quality assurance are paramount. Additionally, the integration of these technologies with automation, AI, and real-time data analytics enables smart manufacturing and predictive maintenance, further driving demand. As manufacturers increasingly prioritize efficiency, quality, and traceability, the adoption of advanced 3D and non-contact measurement systems is expected to propel market growth and innovation over the years.
Key Market Players
Top surface roughness measurement companies Mahr GmbH (Germany), Hexagon AB (Sweden), Starrett (US), ZEISS (Germany), Mitutoyo Corporation (Japan).
Key Questions addressed in this report:
- What are the global trends in demand for the market?
- What are the upcoming technologies/product areas that will have a significant impact on the market in the future?
- What will be the revenue pockets for the market players in the next 6 years?
- What are the prime strategies followed by key players in the market?
 Exclusive indicates content/data unique to MarketsandMarkets and not available with any competitors.
Table of Contents
1 Introduction (Page No. - 17)
1.1 Study Objectives
1.2 Definition
1.3 Study Scope
1.3.1 Years Considered
1.4 Currency
1.5 Limitation
1.6 Package Size
1.7 Stakeholders
2 Research Methodology (Page No. - 21)
2.1 Research Data
2.1.1 Secondary Data
2.1.1.1 Secondary Sources
2.1.2 Primary Data
2.1.2.1 Key Data From Primary Sources
2.1.2.2 Breakdown of Primaries
2.1.3 Secondary and Primary Research
2.1.3.1 Key Industry Insights
2.2 Market Size Estimation
2.2.1 Bottom-Up Approach
2.2.2 Top-Down Approach
2.3 Market Breakdown and Data Triangulation
2.4 Research Assumptions
3 Executive Summary (Page No. - 29)
4 Premium Insights (Page No. - 33)
4.1 Attractive Market Opportunities in Surface Roughness Measurement (SRM) Market
4.2 Market, By Surface Type
4.3 Market, By Technique
4.4 Market in APAC, By Country and Vertical
4.5 Market, By Geography
5 Market Overview (Page No. - 36)
5.1 Introduction
5.2 Evolution
5.3 Market Dynamics
5.3.1 Drivers
5.3.1.1 Growing Requirement for Improving Product Quality and Manufacturing Processes
5.3.1.2 Increasing Expenditure on Research and Development Activities
5.3.2 Restraints
5.3.2.1 Dearth of Skilled Workforce and Inclination Toward Conventional Measuring Solutions
5.3.3 Opportunities
5.3.3.1 Rising Adoption of Noncontact Measurement Techniques
5.3.4 Challenges
5.3.4.1 Integration of Operations Due to Implementation of Iot
5.4 Value Chain Analysis
5.5 Industry Standards and Parameters for Measurement
5.6 Emerging Trends
5.6.1 Rapid Development of Technologically Advanced Sensors
5.6.2 Increased Use of Scanning Techniques for Inspecting Machine Components
5.6.3 Technological Advances in Surface Characterization
6 Surface Roughness Measurement Market, By Component (Page No. - 47)
6.1 Introduction
6.2 Probes
6.2.1 Probes Will Held the Largest Share of the Market By Component During Forecast Period
6.3 Frame Grabbers
6.3.1 Increasing Use of Noncontact Surface Roughness Measurement Machines to Drive the Market for Frame Grabbers
6.4 Lighting Equipment
6.4.1 Increasing Demand for Lighting Equipment to Drive the Market
6.5 Cameras
6.5.1 Frame Rates
6.5.1.1 25-125 FPS Frame Rates to Hold the Largest Share of the Market in 2018
6.5.2 Format
6.5.2.1 Area Scan Cameras
6.5.2.1.1 The Demand for Area Scan Cameras to Grow Significantly During Forecast Period
6.5.2.2 Line Scan Cameras
6.5.2.2.1 Market for Line Scan Cameras to Hold the Largest Share of the Market By Format During Forecast Period
6.5.3 Sensing Technology
6.5.3.1 CCD
6.5.3.1.1 The Demand for CCD Sensing Technology to Grow Significantly During Forecast Period
6.5.3.2 CMOS
6.5.3.2.1 CMOS to Hold the Largest Share of the Market By Sensing Technology in 2018
6.5.4 Interface Standards
6.5.4.1 Camera Link
6.5.4.1.1 Market for Camera Link to Hold the Largest Share of the Market By Interface Standard in 2018
6.5.4.2 Gige Vision
6.5.4.2.1 The Market for Gige Vision to Grow at A Significant Rate During Forecast Period
6.5.4.3 USB 3.0
6.5.4.3.1 Growing Demand for USB 3.0 to Drive the Market By Interface Standards During Forecast Period
6.5.4.4 Coaxpress
6.5.4.4.1 Increasing Usage of Coaxpress to Drive the Market By Interface Standards During Forecast Period
6.5.4.5 Others
6.5.4.5.1 Others to Drive the Market By Interface Standards During Forecast Period
6.5.5 Imaging Technology
6.5.5.1 Structured Light System
6.5.5.1.1 Market for Structured Light System to Grow Significantly During Forecast Period
6.5.5.2 Time-Of-Flight Technique
6.5.5.2.1 Time-Of-Flight Technique to Hold the Largest Share of the Market By Imaging Technology During Forecast Period
6.5.5.3 Stereo Vision System
6.5.5.3.1 Increasing Demand for Stereo Vision System to Drive the Market By Imaging Technology During Forecast Period
6.5.5.4 Comparison Between Various Imaging Technologies
6.6.1 Market for Processors to Grow Significantly During Forecast Period
6.7 Software
6.7.1 Market for Software to Grow at the Highest CAGR During Forecast Period
6.8 Others
6.8.1 Increasing Usage of Others Component to Drive the Overall Market
7 Surface Roughness Measurement Market, By Surface Type (Page No. - 64)
7.1 Introduction
7.2 2D
7.2.1 Market for 2D Surface Roughness Measurement Equipment to Hold the Largest Share of the Market By Surface Type
7.3 3D
7.3.1 Market for 3D Surface Roughness Measurement Equipment to Grow at the Highest CAGR During Forecast Period
8 Surface Roughness Measurement Market, By Technique (Page No. - 68)
8.1 Introduction
8.2 Contact Technique
8.2.1 Market for Contact Technique to Hold the Largest Share of the Market By Technique in 2018
8.3 Noncontact Technique
8.3.1 Market for Noncontact Technique to Grow Significantly During Forecast Period
9 Surface Roughness Measurement Market, By Vertical (Page No. - 72)
9.1 Introduction
9.2 Automotive
9.2.1 Automotive Design and Styling
9.2.1.1 Growing Demand for Surface Roughness Measurement Machines for Automotive Design and Styling
9.2.2 Pilot Plant Metrology
9.2.2.1 Increasing Use of Surface Roughness Measurement Machines in Pilot Plant Metrology to Reduce the Overall Cost of Assembly Line
9.2.3 Automotive Component Inspection
9.2.3.1 Growing Usage of Surface Roughness Measurement Machines in Automotive Component Inspection to Drive the Market for Automotive Vertical
9.2.4 Other Applications of SRMms in Automotive Industry
9.2.4.1 Other Applications to Drive the Demand for Surface Roughness Measurement Machines During the Forecast Period
9.3 Aerospace & Defence
9.3.1 Aircraft Component Design and Inspection
9.3.1.1 Growing Use of Surface Roughness Measurement Machines in Aircraft Component Design and Inspection to Drive the Market for Aerospace & Defence Vertical
9.3.2 Defence Equipment Design and Inspection
9.3.2.1 Defence Equipment Design and Inspection Application to Drive the Demand for Surface Roughness Measurement Machines
9.3.3 Space Exploration Equipment Design and Inspection
9.3.3.1 Space Exploration Equipment Design and Inspection Application to Drive the Market for Aerospace & Defence Vertical
9.4 Optics and Metal Bearing
9.4.1 Growing Demand for Surface Roughness Measurement Application in Optical and Metal Bearing Vertical
9.5 Medical& Pharmaceuticals
9.5.1 Growing Demand for the Surgical Implants Inspection to Drive the Market for Medical & Pharmaceutical Vertical
9.6 Semiconductor
9.6.1 Increasing Usage of Surface Roughness Measurement Machines for Inspection of Electronic Components to Drive the Market for Semiconductor Vertical
9.7 Energy & Power
9.7.1 Inspection and Maintenance of Turbines (Gas, Wind, Hydro)
9.7.1.1 Growing Demand of Component Inspection in Energy & Power Vertical to Drive the Market
9.7.2 Inspection and Maintenance of Solar Panels
9.7.2.1 Increasing Demand for Inspection and Maintenance of Solar Panels to Drive the Market
9.8 Other Verticals
9.8.1 Growing Demand From Others Vertical to Drive the Market During Forecast Period
10 Geographic Analysis (Page No. - 96)
10.1 Introduction
10.2 North America
10.2.1 US
10.2.1.1 US to Hold the Largest Share of the Market in 2018
10.2.2 Canada
10.2.2.1 Growing Demand for Component Inspection and Maintenance to Drive the Market in Canada
10.2.3 Mexico
10.2.3.1 Market in Mexico to Grow at A Significant CAGR During Forecast Period
10.3 Europe
10.3.1 Germany
10.3.1.1 Growing Demand From the Automotive Industry to Drive the Market in Germany
10.3.2 France
10.3.2.1 Aerospace & Defence Industry to Drive the Market in France
10.3.3 UK
10.3.3.1 Increasing Research and Development Expenditure to Drive the Market in UK
10.3.4 Italy
10.3.4.1 Increasing Demand for Quality Control and Reverse Engineering Application to Drive the Market
in Italy 102
10.3.5 Spain
10.3.5.1 Increasing Demand for Component Inspection Across Industries to Drive the Market in Spain
10.3.6 Rest of Europe
10.3.6.1 Growing Demand From OEMS and Manufacturer to Drive the Market in Rest of Europe
10.4 APAC
10.4.1 China
10.4.1.1 Major Industrial Base and Growing Manufacturing Activities to Drive the Market China
10.4.2 Japan
10.4.2.1 Growing Demand From Optics and Semiconductor Industries to Drive the Market in Japan
10.4.3 South Korea
10.4.3.1 Growing Demand From Electronic Component Manufacturer to Drive the Market in South Korea
10.4.4 Rest of APAC
10.4.4.1 Growing Demand From End Use Industries to Drive the Market in Rest of APAC
10.5 RoW
10.5.1 South America
10.5.1.1 Growing Demand From Energy & Power Industry to Drive the Market in South America
10.5.2 Middle East and Africa
10.5.2.1 Increasing Demand From Aerospace Industry to Drive the Market in Middle-East and Africa
11 Competitive Landscape (Page No. - 108)
11.1 Introduction
11.2 Market Ranking Analysis, 2018
11.3 Competitive Leadership Mapping, 2018
11.3.1 Visionary Leaders
11.3.2 Innovators
11.3.3 Dynamic Differentiators
11.3.4 Emerging Companies
11.4 Business Strategy Excellence (For All 25 Players)
11.5 Strength of Product Portfolio (For All 25 Players)
11.6 Competitive Situations and Trends
11.6.1 Product Launches
11.6.2 Partnerships, Joint Ventures, and Contracts
11.6.3 Expansions
11.6.4 Collaborations and Agreements
11.6.5 Acquisitions
12 Company Profiles (Page No. - 118)
12.1 Key Players
(Business Overview, Products and Services Offered, Recent Developments, SWOT Analysis, and MnM View)*
12.1.1 Mahr
12.1.2 Taylor Hobson
12.1.3 Hexagon AB
12.1.4 EXTECH
12.1.5 Starrett
12.1.6 Carl Zeiss
12.1.7 Mitutoyo Corporation
12.1.8 KEYENCE Corporation
12.1.9 JENOPTIK AG
12.1.10 Tokyo Seimitsu Co., Ltd.
* Business Overview, Products and Services Offered, Recent Developments, SWOT Analysis, and MNM View Might Not Be Captured in Case of Unlisted Companies.
12.2 Other Companies
12.2.1 Faro Technologies
12.2.2 Optimax Imaging Inspection & Measurement Ltd.
12.2.3 Alicona Imaging GmbH
12.2.4 Kosaka Laboratory Ltd.
12.2.5 Wenzel
12.2.6 KRÜSS GmbH
12.2.7 Zygo Corporation
12.2.8 Horiba Ltd.
12.2.9 The Sempre Group
12.2.10 Fowler
13 Appendix (Page No. - 155)
13.1 Discussion Guide
13.2 Knowledge Store: Marketsandmarkets’ Subscription Portal
13.3 Available Customizations
13.4 Related Reports
13.5 Author Details
List of Tables (68 Tables)
Table 1 Surface Roughness Measurement Market, 2016–2025 (Units)
Table 2 Characteristics of Typical Contact and Noncontact Type Measuring Instruments
Table 3 Market, By Component, 2016–2025 (USD Million)
Table 4 Market for Probes, By Surface Type, 2016–2025 (USD Million)
Table 5 Market for Frame Grabbers, By Surface Type, 2016–2025 (USD Million)
Table 6 Market for Lighting Equipment, By Surface Type, 2016–2025 (USD Million)
Table 7 SRM Market for Cameras, By Surface Type, 2016–2025 (USD Million)
Table 8 Market for Cameras, By Frame Rate, 2016–2025 (USD Million)
Table 9 Market for Cameras, By Format, 2016–2025 (USD Million)
Table 10 Market for Cameras, By Sensing Technology, 2016–2025 (USD Million)
Table 11 Market for Cameras, By Interface Standard, 2016–2025 (USD Million)
Table 12 Market for Cameras, By Imaging Technology, 2016–2025 (USD Million)
Table 13 Comparative Study of Imaging Technologies
Table 14 Market for Processors, By Surface Type, 2016–2025 (USD Million)
Table 15 Market for Software, By Surface Type, 2016–2025 (USD Million)
Table 16 Market for Other Components, By Surface Type, 2016–2025 (USD Million)
Table 17 Market, By Surface Type, 2016–2025 (USD Million)
Table 18 2D Surface Roughness Measurement Market, By Technique, 2016–2025 (USD Million)
Table 19 3D Surface Roughness Measurement Market, By Technique, 2016–2025 (USD Million)
Table 20 Surface Roughness Measurment Market, By Technique, 2016–2025 (USD Million)
Table 21 Surface Roughness Measurement Market for Contact Technique, By Vertical, 2016–2025 (USD Million)
Table 22 Market for Noncontact Technique, By Vertical, 2016–2025 (USD Million)
Table 23 Market, By Vertical, 2016–2025 (USD Million)
Table 24 Market for Automotive Vertical, By Region, 2016–2025 (USD Million)
Table 25 Market in North America for Automotive Vertical, By Country, 2016–2025 (USD Million)
Table 26 Market in APAC for Automotive Vertical, By Country, 2016–2025 (USD Million)
Table 27 Market in Europe for Automotive Vertical, By Country, 2016–2025 (USD Million)
Table 28 Surface Roughness Measurement Market in RoW for Automotive Vertical, By Region, 2016–2025 (USD Million)
Table 29 Surface Roughness Measurement Market for Aerospace & Defence Vertical, By Region, 2016–2025 (USD Million)
Table 30 Surface Roughness Measurement Market in APAC for Aerospace & Defence Vertical, By Country, 2016–2025 (USD Million)
Table 31 Surface Roughness Measurement Market in Europe for Aerospace & Defence Vertical, By Country, 2016–2025 (USD Million)
Table 32 Surface Roughness Measurement Market in North America for Aerospace & Defence, By Country, 2016–2025 (USD Million)
Table 33 Surface Roughness Measurement Market in RoW for Aerospace & Defence Vertical, By Region, 2016–2025 (USD Million)
Table 34 Surface Roughness Measurement Market for Optics and Metal Bearing Vertical, By Region, 2016–2025 (USD Million)
Table 35 Surface Roughness Measurement Market in APAC for Optics and Metal Bearing, By Country, 2016–2025 (USD Million)
Table 36 Surface Roughness Measurement Market in North America for Optics and Metal Bearing Vertical, By Country, 2016–2025 (USD Million)
Table 37 Surface Roughness Measurement Market in Europe for Optics and Metal Bearing Vertical, By Country, 2016–2025 (USD Million)
Table 38 Surface Roughness Measurement Market in RoW for Optics and Metal Bearing Vertical, By Region, 2016–2025 (USD Million)
Table 39 Surface Roughness Measurement Market for Medical and Pharmaceuticals Vertical, By Region, 2016–2025 (USD Million)
Table 40 Surface Roughness Measurement Market in North America for Medical and Pharmaceuticals Vertical, By Country, 2016–2025 (USD Million)
Table 41 Surface Roughness Measurement Market in Europe for Medical and Pharmaceuticals Vertical, By Country, 2016–2025 (USD Million)
Table 42 Surface Roughness Measurement Market in APAC for Medical and Pharmaceuticals Vertical, By Country, 2016–2025 (USD Million)
Table 43 Surface Roughness Measurement Market in RoW for Medical and Pharmaceuticals Vertical, By Region, 2016–2025 (USD Million)
Table 44 Surface Roughness Measurement Market for Semiconductor Vertical, By Region, 2016–2025 (USD Million)
Table 45 Surface Roughness Measurement Market in North America for Semiconductor Vertical, By Country, 2016–2025 (USD Million)
Table 46 Surface Roughness Measurement Market in Europe for Semiconductor Vertical By Country, 2016–2025 (USD Million)
Table 47 Surface Roughness Measurement Market in APAC for Semiconductor Vertical By Country, 2016–2025 (USD Million)
Table 48 Surface Roughness Measurement Market in RoW for Semiconductor Vertical, By Region, 2016–2025 (USD Million)
Table 49 Surface Roughness Measurement Market for Energy & Power Vertical, By Region, 2016–2025 (USD Million)
Table 50 Surface Roughness Measurement Market in North America for Energy & Power Vertical, By Country, 2016–2025 (USD Million)
Table 51 Surface Roughness Measurement Market in Europe for Energy & Power Vertical, By Country, 2016–2025 (USD Million)
Table 52 Surface Roughness Measurement Market in APAC for Energy & Power Vertical, By Country, 2016–2025 (USD Million)
Table 53 Surface Roughness Measurement Market in RoW for Energy & Power Vertical, By Region, 2016–2025 (USD Million)
Table 54 Surface Roughness Measurement Market for Other Verticals, By Region, 2016–2025 (USD Million)
Table 55 Surface Roughness Measurement Market in North America for Other Verticals, By Country, 2016–2025 (USD Million)
Table 56 Market in Europe for Other Verticals, By Country, 2016–2025 (USD Million)
Table 57 Market in APAC for Other Verticals, By Country, 2016–2025 (USD Million)
Table 58 Market in RoW for Other Verticals, By Region, 2016–2025 (USD Million)
Table 59 Market, By Region, 2016–2025 (USD Million)
Table 60 Market in North America, By Country, 2016–2025 (USD Million)
Table 61 Market in Europe, By Country, 2016–2025 (USD Million)
Table 62 Market in APAC, By Country, 2016–2025 (USD Million)
Table 63 Market in RoW, By Region, 2016–2025 (USD Million)
Table 64 Product Launches, 2016–2018
Table 65 Partnerships, Joint Ventures, and Contracts, 2016–2017
Table 66 Expansions, 2016–2018
Table 67 Collaborations and Agreements, 2016–2018
Table 68 Acquisitions, 2016–2018
List of Figures (47 Figures)
Figure 1 Segmentation of Surface Roughness Measurement Market
Figure 2 SRM Market: Research Design
Figure 3 SRM Market: Bottom-Up Approach
Figure 4 SRM Market: Top-Down Approach
Figure 5 Data Triangulation
Figure 6 Probes to Hold Largest Size of Surface Roughness Measurement Market, By Component, in 2019
Figure 7 Noncontact Technique to Witness Higher CAGR in Surface Roughness Measurement Market During Forecast Period
Figure 8 Market for 3D Surface Roughness Measurement Instruments to Grow at Higher CAGR During Forecast Period
Figure 9 Automotive Vertical Held Largest Size of Surface Roughness Measurement Market in 2018
Figure 10 North America Accounted for Largest Share of Surface Roughness Measurement Market in 2018
Figure 11 Increasing Demand for Surface Roughness Measurement Equipment Will Propel Market Growth During Forecast Period
Figure 12 2D Surface Roughness Measurement Machines Accounted for Larger Market Share in 2018
Figure 13 Contact Technique to Capture Larger Share of Surface Roughness Measurement Market in 2025
Figure 14 China and Automotive Vertical to Hold Largest Share of Surface Roughness Measurement Market in APAC in 2019
Figure 15 US Accounted for Largest Share of Overall Market in 2018
Figure 16 Evolution of Surface Roughness Measurement Technology
Figure 17 Growing Requirement for Improving Product Quality and Manufacturing Processes Propel Surface Roughness Measurement Market Growth
Figure 18 Original Equipment Manufacturers Add Maximum Value to Surface Roughness Measurement Value Chain
Figure 19 Pictorial Representation of Contact-Type Probing System
Figure 20 Pictorial Representation of Working Principle of White Light Scanner
Figure 21 Pictorial Representation of Noncontact Laser Measurement Device
Figure 22 Market for Software Expected to Grow at Highest CAGR During Forecast Period
Figure 23 Pictorial Representation of Probing System
Figure 24 Time-Of-Flight Segment to Command SRM Market for Cameras Based on Imaging Technology During Forecast Period
Figure 25 3D Surface Roughness Measurement Market for Software to Grow at Higher CAGR During Forecast Period
Figure 26 2D Surface Roughness Measurement Market Expected to Continue to Account for Largest Market Size During Forecast Period
Figure 27 Noncontact Technique to Exhibit Higher CAGR During Forecast Period
Figure 28 Automotive Vertical to Hold Largest Size of Surface Roughness Measurement Market During Forecast Period
Figure 29 APAC to Commandsurface Roughness Measurement Market for Aerospace & Defence Vertical During Forecast Period
Figure 30 APAC to Witness Highest CAGR in Surface Roughness Measurement Market for Optics and Metal Bearing Vertical During Forecast Period
Figure 31 Surface Roughness Measurement Market in UK for Semiconductor Vertical to Grow at Highest CAGR During Forecast Period
Figure 32 China to Account for Largest Size of Surface Roughness Measurement Market in APAC for Energy & Power Vertical During Forecast Period
Figure 33 Market in APAC Expected to Grow at Highest CAGR During Forecast Period
Figure 34 North America: Snapshot of SRM Market
Figure 35 Europe: Snapshot of SRM Market
Figure 36 APAC: Snapshot of SRM Market
Figure 37 Market in South America to Grow at Higher CAGR During Forecast Period
Figure 38 Players in SRM Market Adopted Product Launches as Their Key Growth Strategy During 2016–2018
Figure 39 Ranking Analysis of Surface Roughness Measurement Market Players, 2018
Figure 40 Market Competitive Leadership Mapping
Figure 41 Product Launches and Acquisitions Emerged as Key Business Strategies Adopted By Market Players From 2016 to 2018
Figure 42 Hexagon AB: Company Snapshot
Figure 43 Starrett: Company Snapshot
Figure 44 Carl Zeiss: Company Snapshot
Figure 45 KEYENCE Corporation: Company Snapshot
Figure 46 JENOPTIK AG: Company Snapshot
Figure 47 Tokyo Seimitsu Co., Ltd.: Company Snapshot
The study involved 4 major activities in estimating the current size of the surface roughness measurement market. Exhaustive secondary research has been done to collect information about the market, the peer market, and the parent market. Validating findings, assumptions, and sizing with industry experts across the value chain through primary research has been the next step. Both top-down and bottom-up approaches have been employed to estimate the complete market size. After that, market breakdown and data triangulation methods have been used to estimate the market size of segments and sub segments.
Secondary Research
In the secondary research process, various secondary sources have been referred to for identifying and collecting information pertinent to this study. Secondary sources include annual reports; press releases; investor presentations; white papers; journals and certified publications; and articles from recognized authors, directories, and databases. Secondary research has been conducted to obtain important information about the industry’s supply chain, value chain, total pool of key players, market segmentation according to the industry trends (to the bottommost level), geographic markets, and key developments from both market- and technology-oriented perspectives.
Primary Research
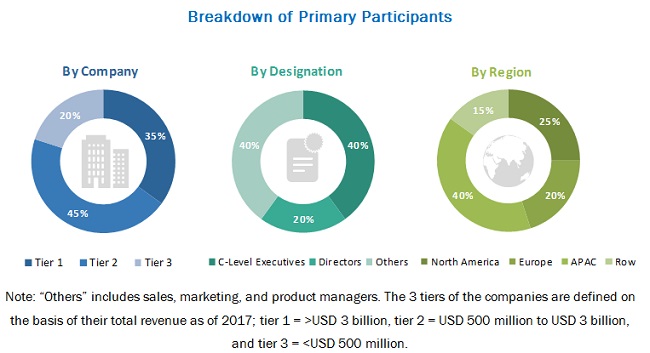
Extensive primary research has been conducted after gaining knowledge about the SRM market scenario through secondary research. Several primary interviews have been conducted with market experts from both demand (commercial application providers) and supply (equipment manufacturers and distributors) sides across 4 major regions: North America, Europe, APAC, and RoW. Approximately 20% and 80% primary interviews have been conducted with parties from demand and supply sides, respectively. The primary data has been collected through questionnaires, emails, and telephonic interviews.
To know about the assumptions considered for the study, download the pdf brochure
Market Size Estimation
In the complete engineering process, both top-down and bottom-up approaches, along with several data triangulation methods, have been used to estimate and validate the size of the SRM market and other dependent submarkets. The key players in the market have been determined through primary and secondary research. This entire research methodology involves the study of the annual and financial reports of the top market players and extensive interviews with industry experts such as CEOs, VPs, directors, and marketing executives for key insights (both qualitative and quantitative) into the SRM market.
Data Triangulation
All the percentage shares, splits, and breakdowns have been determined using secondary sources and verified through primary sources. All the possible parameters that affect the markets covered in this research study have been accounted for, viewed in extensive detail, verified through primary research, and analyzed to get the final quantitative and qualitative data. This data has been consolidated and supplemented with detailed inputs and analysis from MarketsandMarkets and presented in the report.
Report Objectives
- To describe and forecast the surface roughness and measurement (SRM) market by component, surface type, technique, vertical, and region, in terms of value
- To forecast the global surface roughness and measurement (SRM) market, in terms of volume
- To describe and forecast the market for camera components, by frame rate, format, sensing technology, interface standard, and imaging technology, in terms of value
- To describe and forecast the market for various segments, by region—North America, Europe, Asia Pacific (APAC), and Rest of the World (RoW), in terms of value
- To provide detailed information regarding the drivers, restraints, opportunities, and challenges that influence the growth of the SRM market
- To provide a detailed overview of the surface roughness measurement value chain and industry trends and standards in the said market
- To strategically analyze micromarkets1 with respect to the individual growth trends, prospects, and contribution to the overall market
- To analyze opportunities in the market for various stakeholders by identifying high-growth segments of the SRM market
- To strategically profile key players and comprehensively analyze their market ranking in terms of revenue and core competencies2
- To analyze strategies such as joint ventures, mergers and acquisitions, product launches, expansions, partnerships, agreements, and collaborations in the SRM market
Available Customizations
With the given market data, MarketsandMarkets offers customizations according to the company’s specific needs. The following customization options are available for the report:
Product Analysis
- Product matrix that gives a detailed comparison of the product portfolio of each company
Company Information
- Detailed analysis and profiling of additional market players (up to 5).


Growth opportunities and latent adjacency in Surface Roughness Measurement Market